It's not what I think, but they have very different return characteristics.
In fact, the data shows much bigger differences than I thought. I previously think they should have some similarities because smaller stocks always have less analyst dispersions just because they only have one analyst each
If anyone has it I would be interested in the feature_importances for an Extra Trees Regressor and/or LightGBM (preferably using gain for feature importances if you have it), and the number of positive coefficients for LASSO Regression when using 500 features.
I think this data would add to this discussion. Whatever your results happen to be.
My contribution for anyone else interested in this question: I recently added some features to a regularized regression with the net result of 13% of the total features (including some of the original features) getting a zero coefficient. Meaning that even though I added some features to the model many were never actually used by the model to make predictions. That is just anecdotal, I understand, and I would be interested in other people's objective results.
BTW, When using Extra Tress Regressor feature importances results are based on MDI which "refers to the average reduction in variance across all nodes where a particular feature is used to split."
When adding features I don't always mind having some idea of what the model is actually doing with them and how important they really are. Marco makes that possible, at least to some extent with, feature_importances. I wonder what other people find when using the feature_importances feature.
I have to digg deeper into the AI Component of P123 -->
But this is very interesting -->
Meaning that even though I added some features to the model many were never actually used by the model to make predictions.
I got feedback from several user making demos about the AI Component -->
"Time Saver to test assumptions"
"interesting to see which factors the model is using" --> to get new ideas!
Again, not in the shotgun camp, BUT --> lets see I find a factor an AI Model is using and I never thought about it, but can find papers to back what the model found --> I would be interested.
So, still a ton to learn for me, but this gets more and more interesting...
I have to admit, my take was just an expectation. I asked Gemini the correlation between MktCap and CurFYSalesStdDev after showing it screener results for the SP500. The correlation is 0.87.
If I were to make another guess, the correlation is probably lower for a bigger universe.
It would be nice to have a LLM interface to p123 data.
Is there a serious question about this here in October of 2024? I get that LLM capabilities are moving fast.
AND I am fine using simple downloads and using ChatGPT, Claude 3 or something else. There is something to be said for being able to choose the LLM.
But for hard-to-download data someone has a question about whether it would be nice to say: "what is the correlation of these 2 features and while you are at it give me the mutual_infromation_score for each with the target? Serious debate on this?
BTW, Claude 3 has the option of several people contributing at once to "Projects". A kind of ongoing fact-check and pertinence of a contribution to the subject of a thread. Maybe even some new ideas on a topic. Not perfect I know, but seems to me thumbs up may not always be related to how factually correct a post is (and probably Claude's opinion are better in most cases).
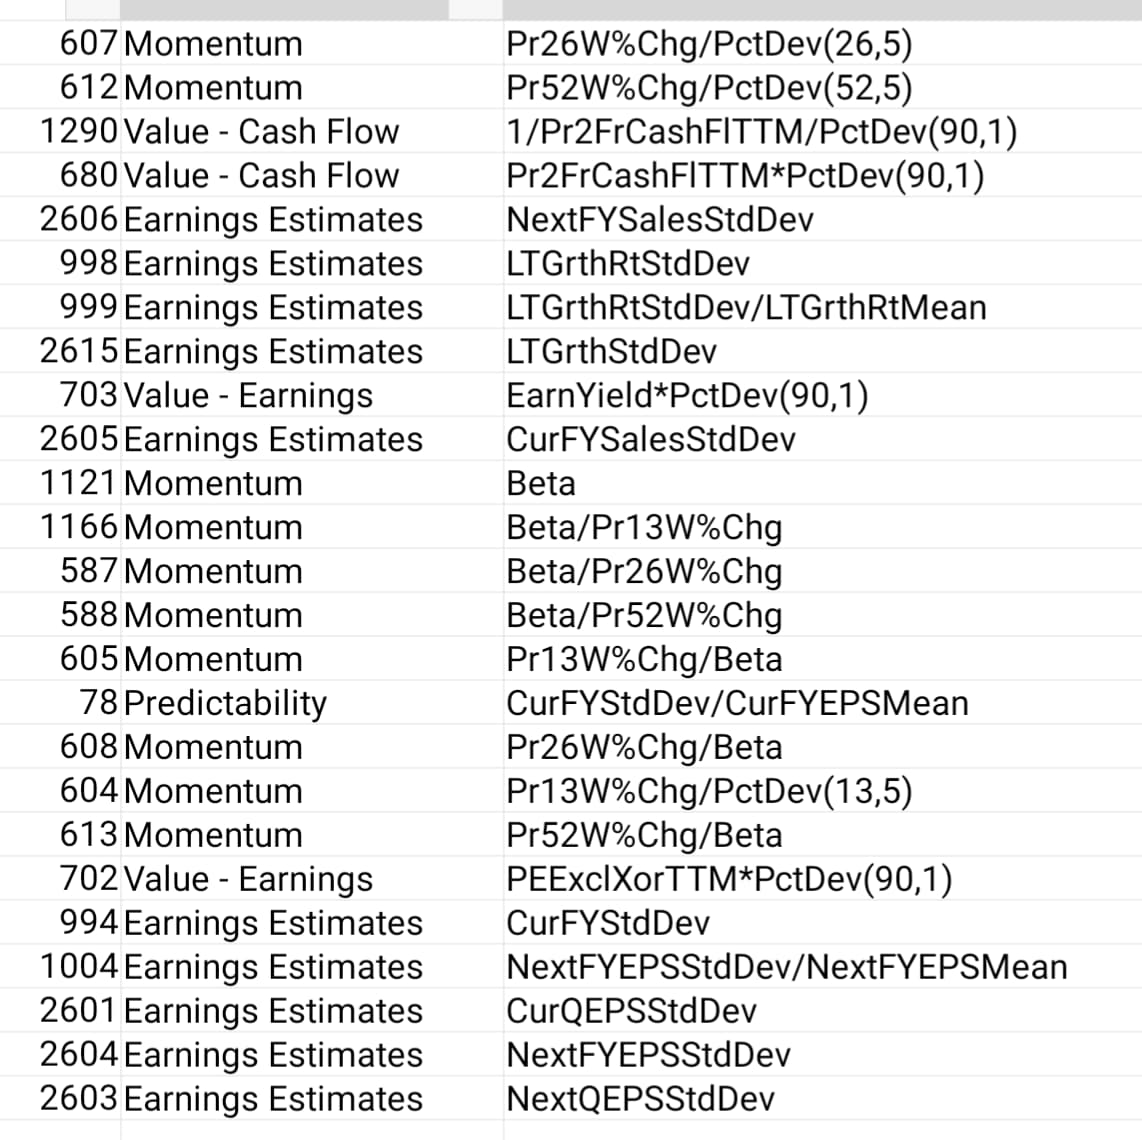
None of these will give you information like LoopRelStdDev("Sales(Ctr)",X). Not even close. The relative standard deviation of analyst estimates is certainly valuable, but not one of the above factors directly measures the stability of an item on the financial statement over time.
In fact, analysts expect dispersion include not only information about historical performance dispersion, but also information that cannot be inferred from historical performance only. While the former part is not a substitute for information about historical performance dispersion alone, it is absolutely not so-called "not even close" because these factors (including volatility) are all proxies for the uncertainty faced by firms (rather than proxies for market capitalization).
Also, there is value in systematically searching for more factors in more "fishing spots" for factors. I have agreed with this before. But Dan's list is good enough for beginners like OP to start from, not so-called "can't put ... into" or "has to be curated"
Yes, that's a very reasonable response, and your advice to OP is good. I went too far in my last post.
But there are many cases in which a company is followed by no analysts or only one or two. In those cases, fundamental stability measures can save your ass. PctDev doesn't go nearly so far, and you might actually want to invest in some companies with high PctDev as long as their financials are relatively stable because that might correspond with price movements that are in line with improving fundamentals. I don't pay much attention to PctDev when going long, though it makes an enormous difference when going short.