PREVIEW: Screenshots of upcoming AI Factors

Dear All,

Yes, it's finally coming together: our fully integrated AI/ML product we call "AI Factors". We're doing testing right now, and I just wanted to share some screenshots. Of course it's still just a tool: garbage IN will still give you garbage OUT, and it will take time to learn how to best utilize it, but it is living up to our expectations. We will likely do a limited release initially. More info soon.

Couple of details

  • The target below is the 3mo future relative performance in a small cap universe.
  • The portfolio performance is calculated by concatenating the Validation Holdout periods.
  • We have four validation methods: Basic Holdout, Time Series CV, Rolling Time Series CV, blocked K-fold CV (shown below)

Without further ado, please meet AI Factor

Cheers

Fig 1. Features Page

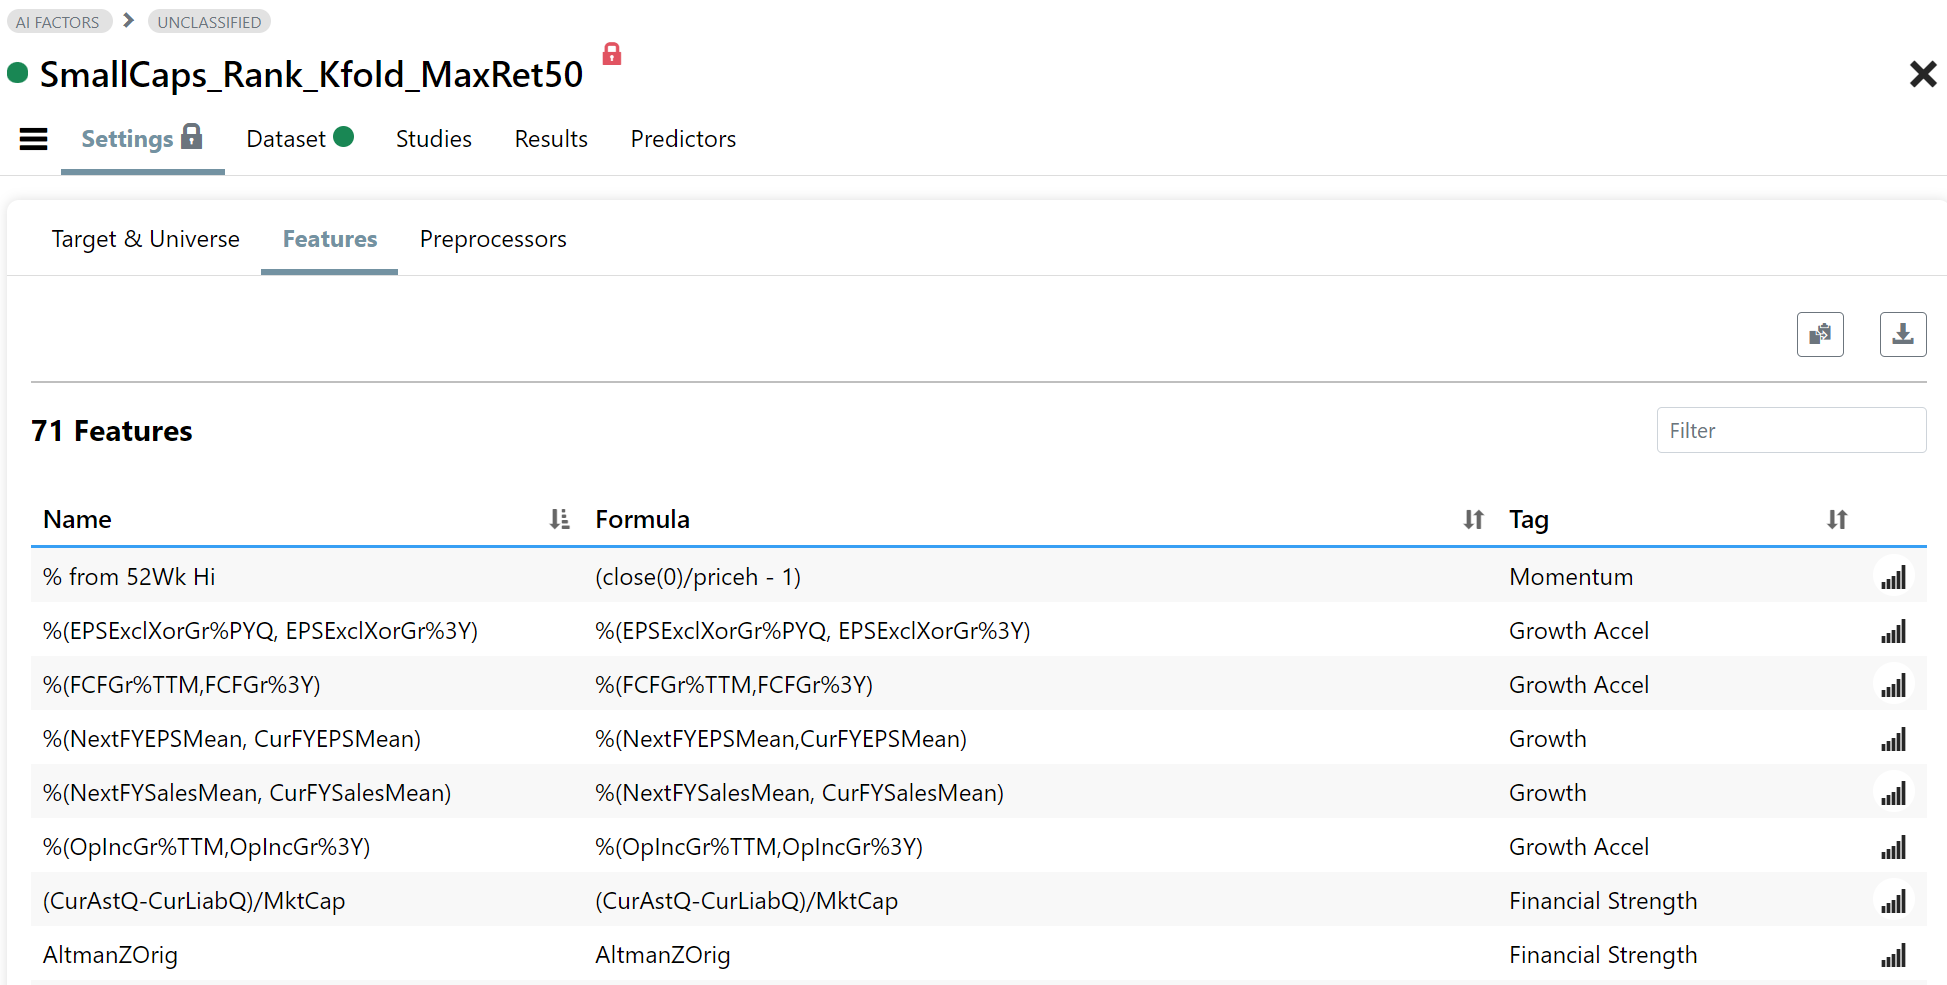
Fig 2. Validation Setup

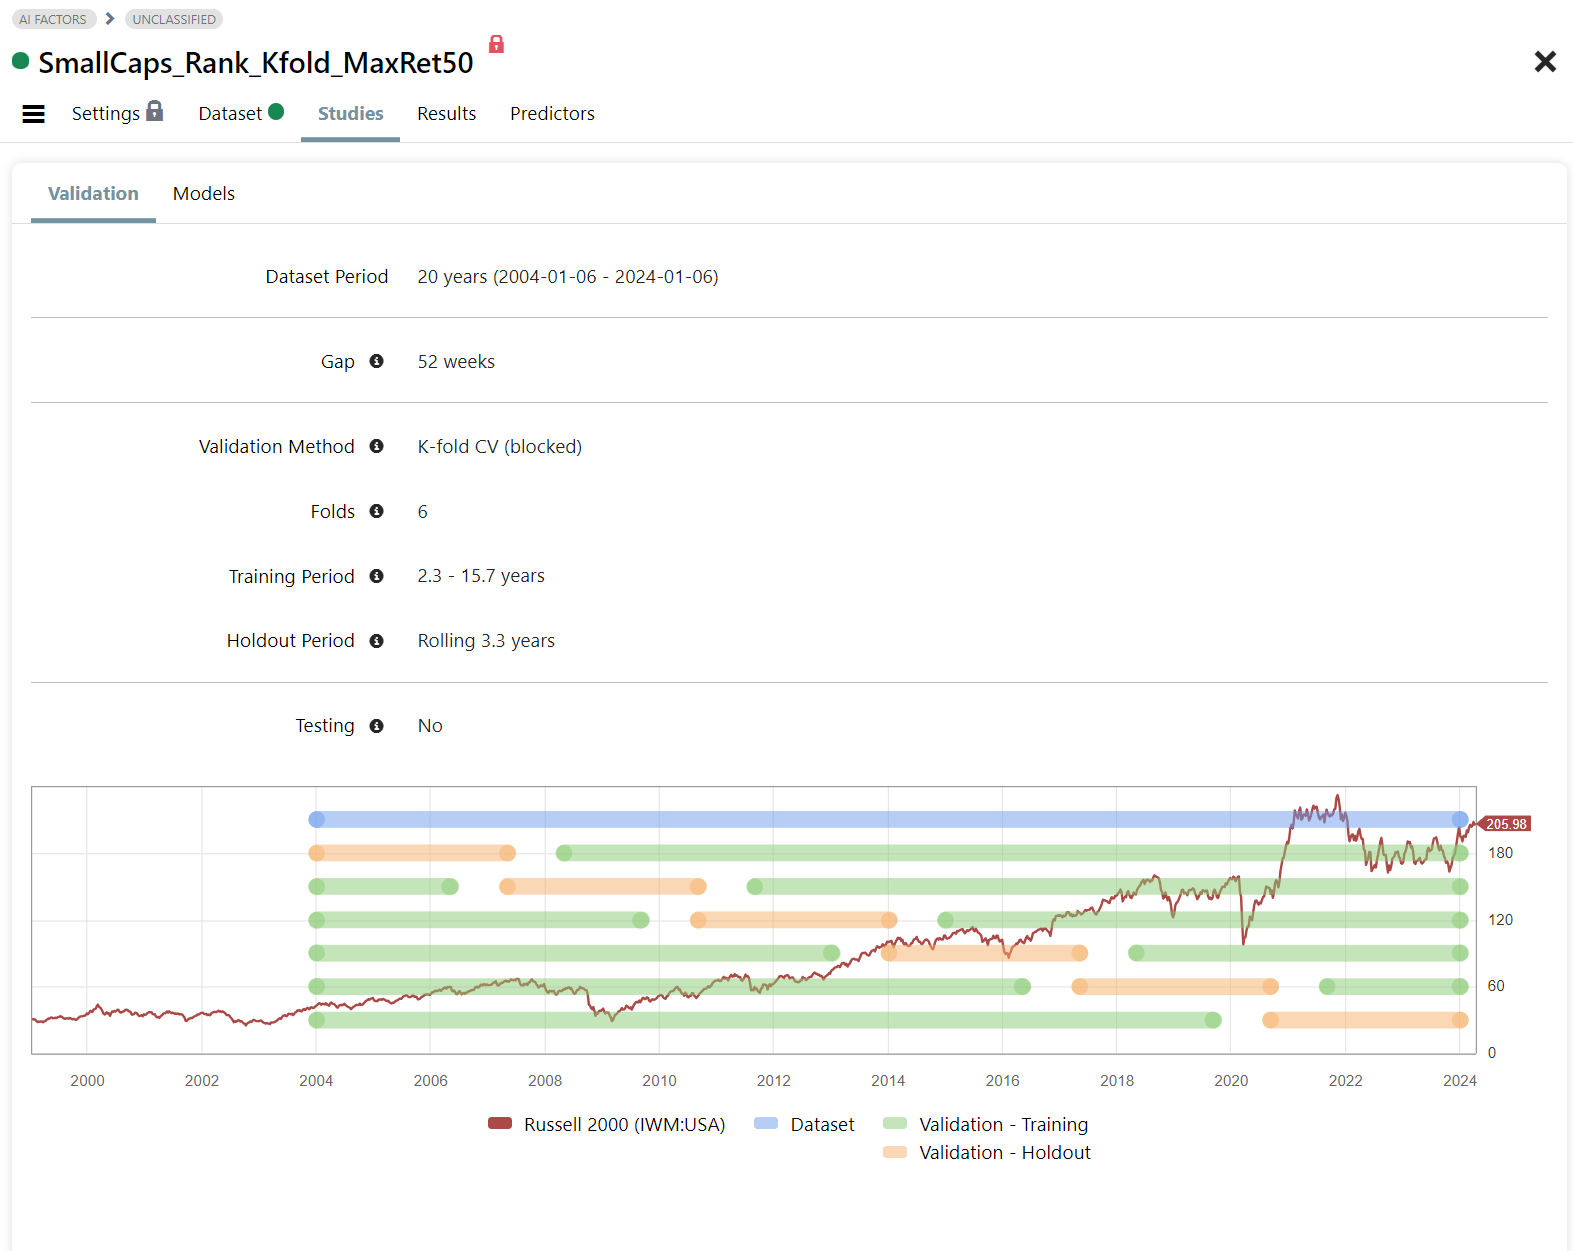
Fig 3. Models for Validation

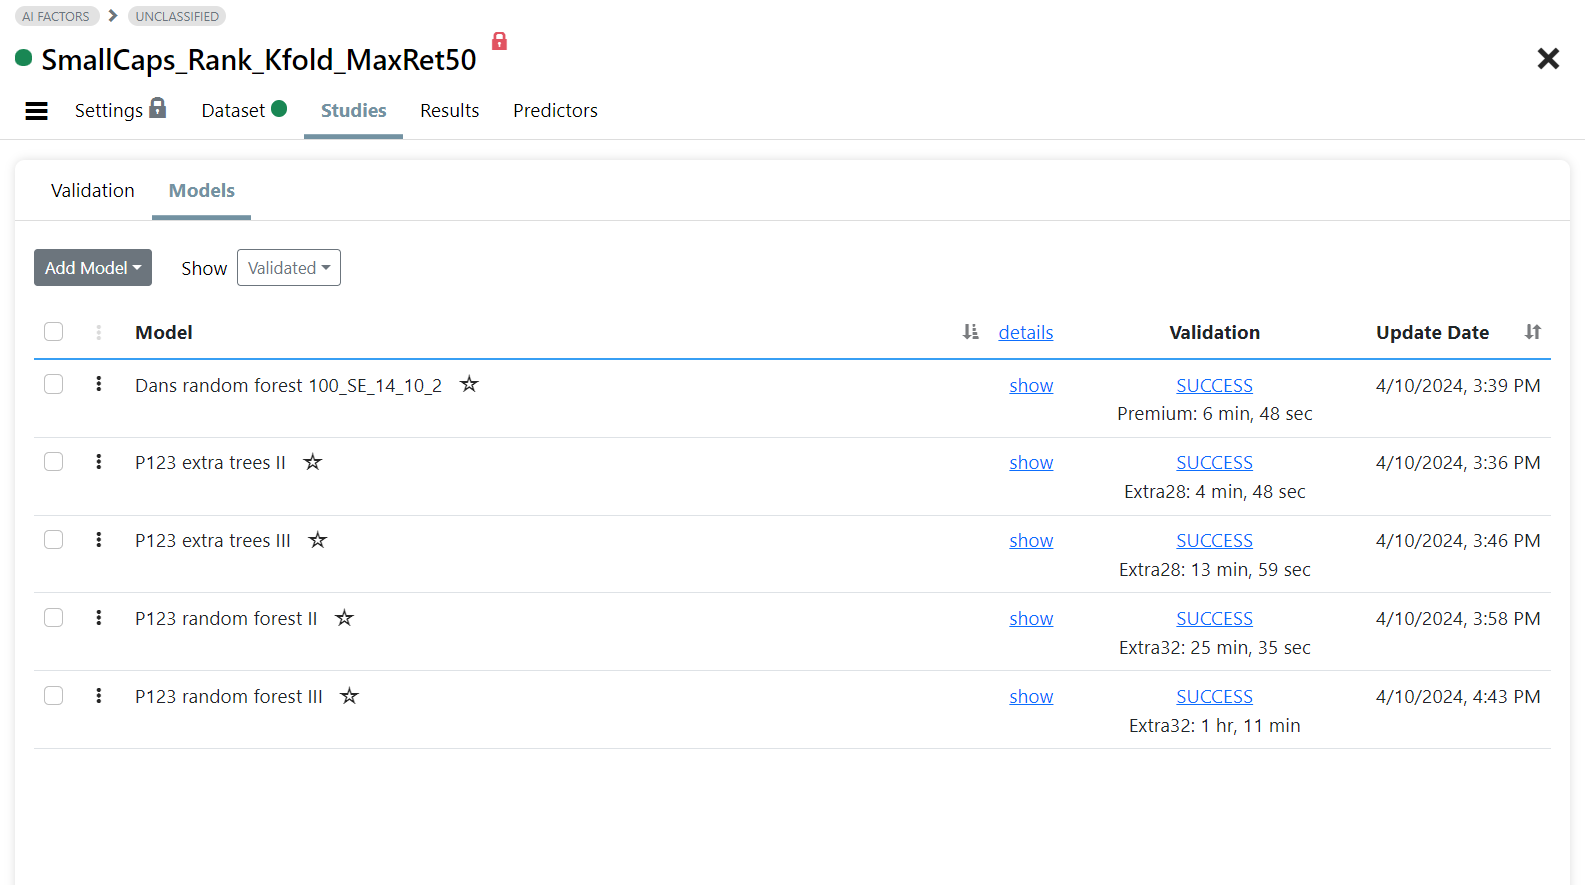
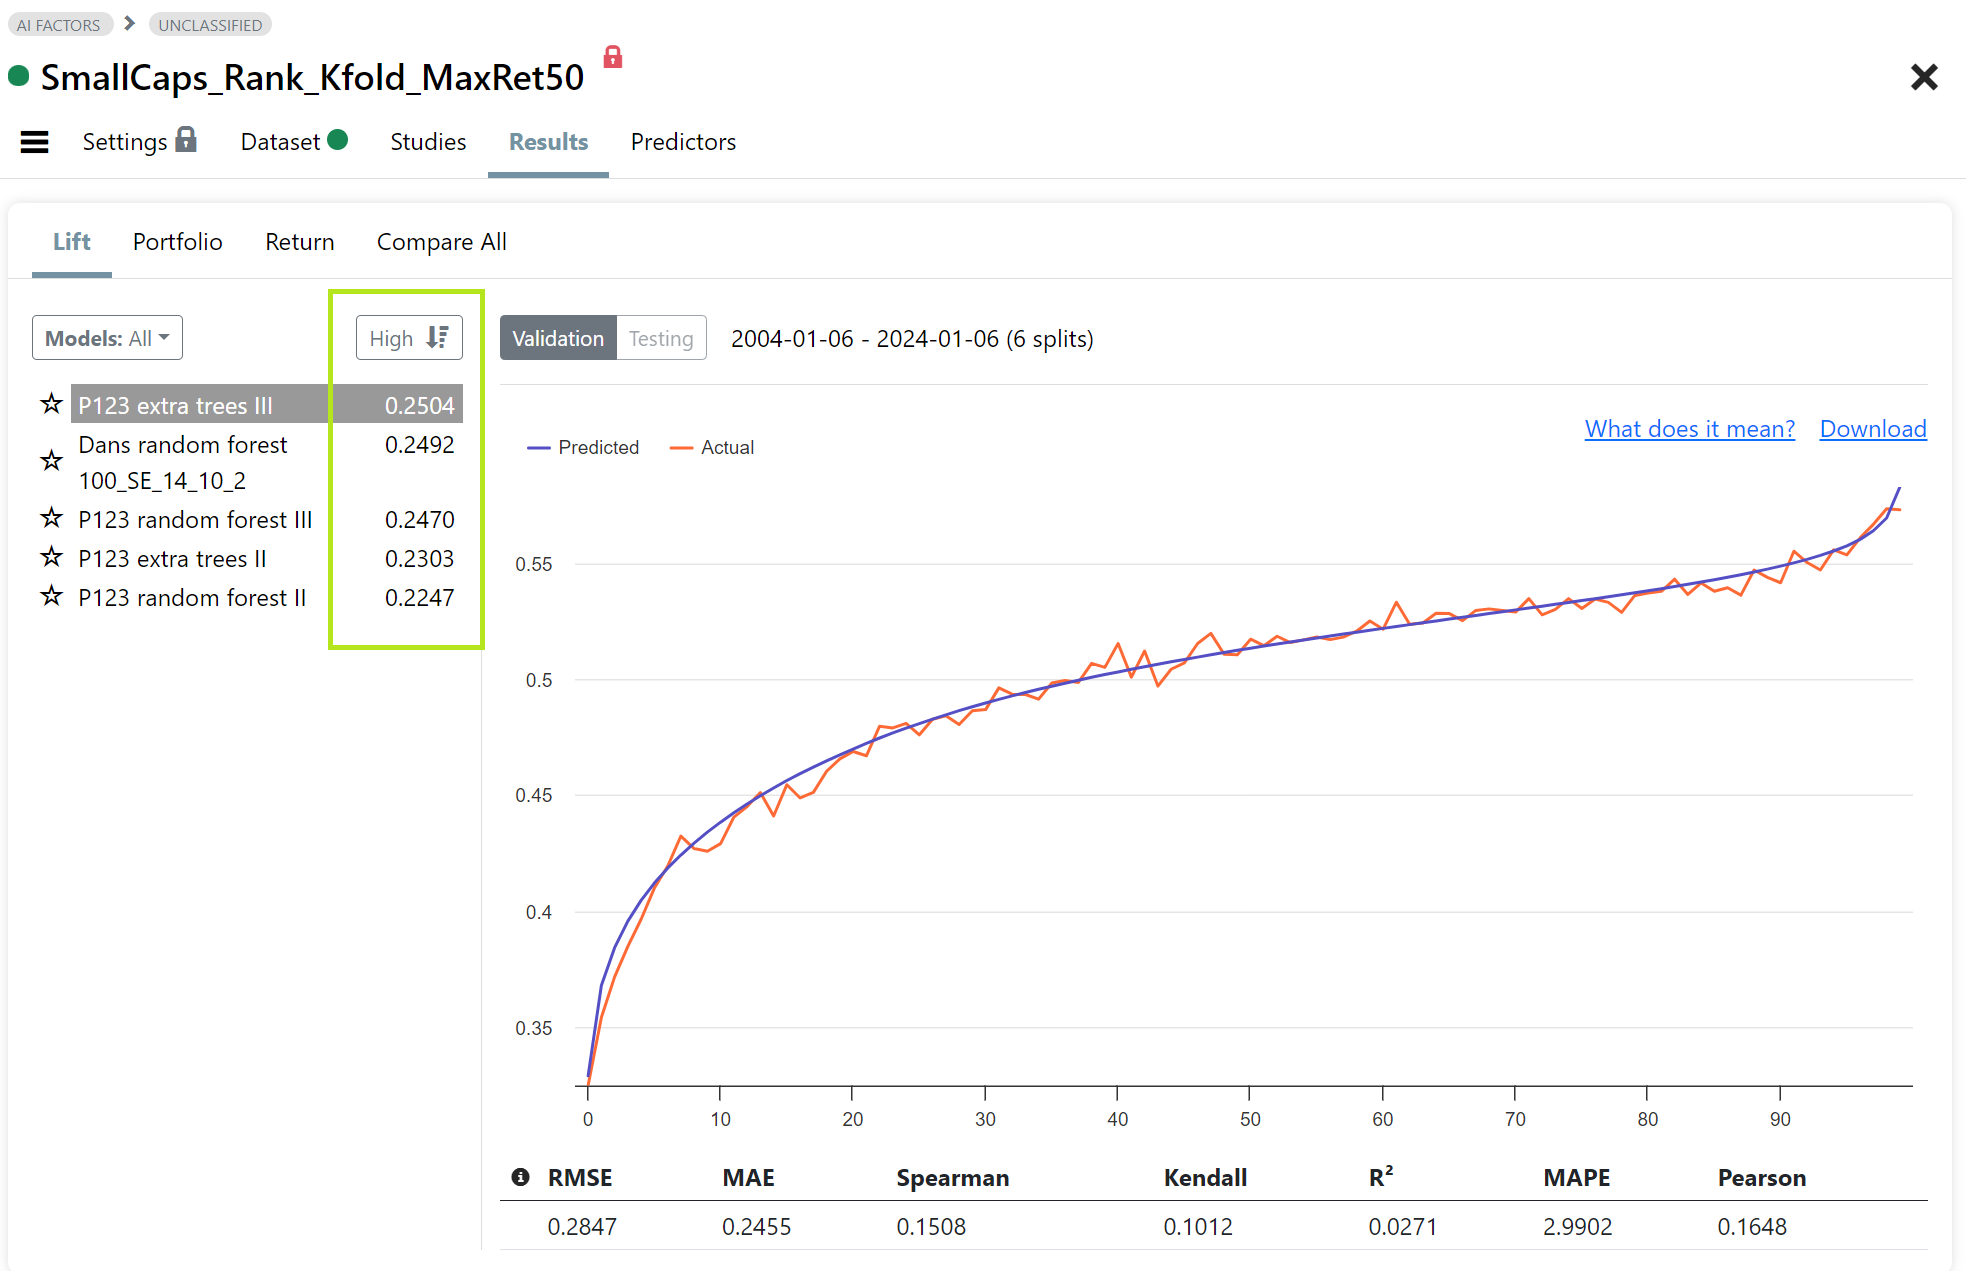
Fig 4. Results: Lift Chart

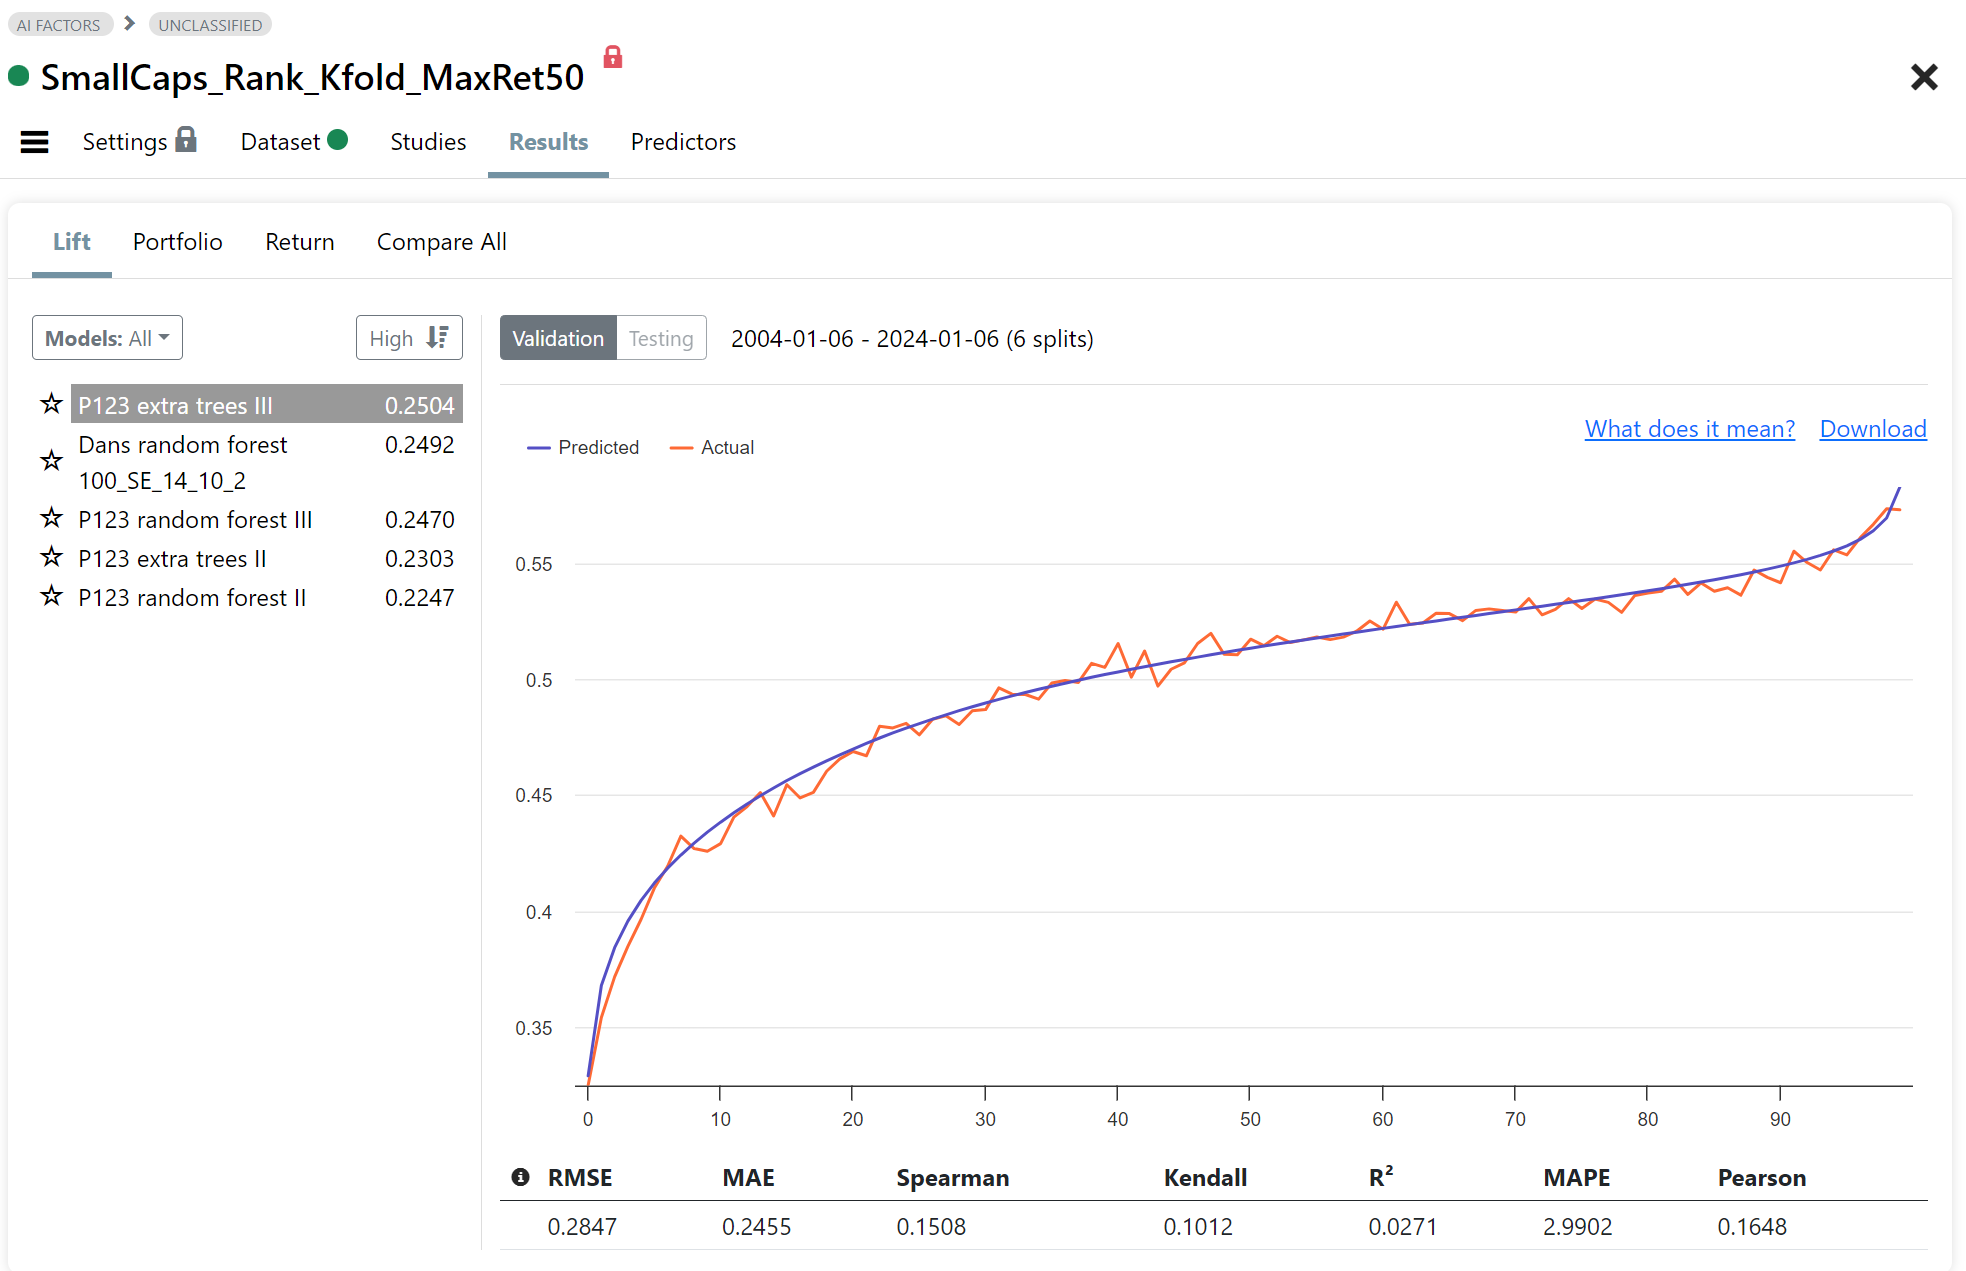
Fig 5. Results: Portfolio (H=top decile, L=bottom decile)

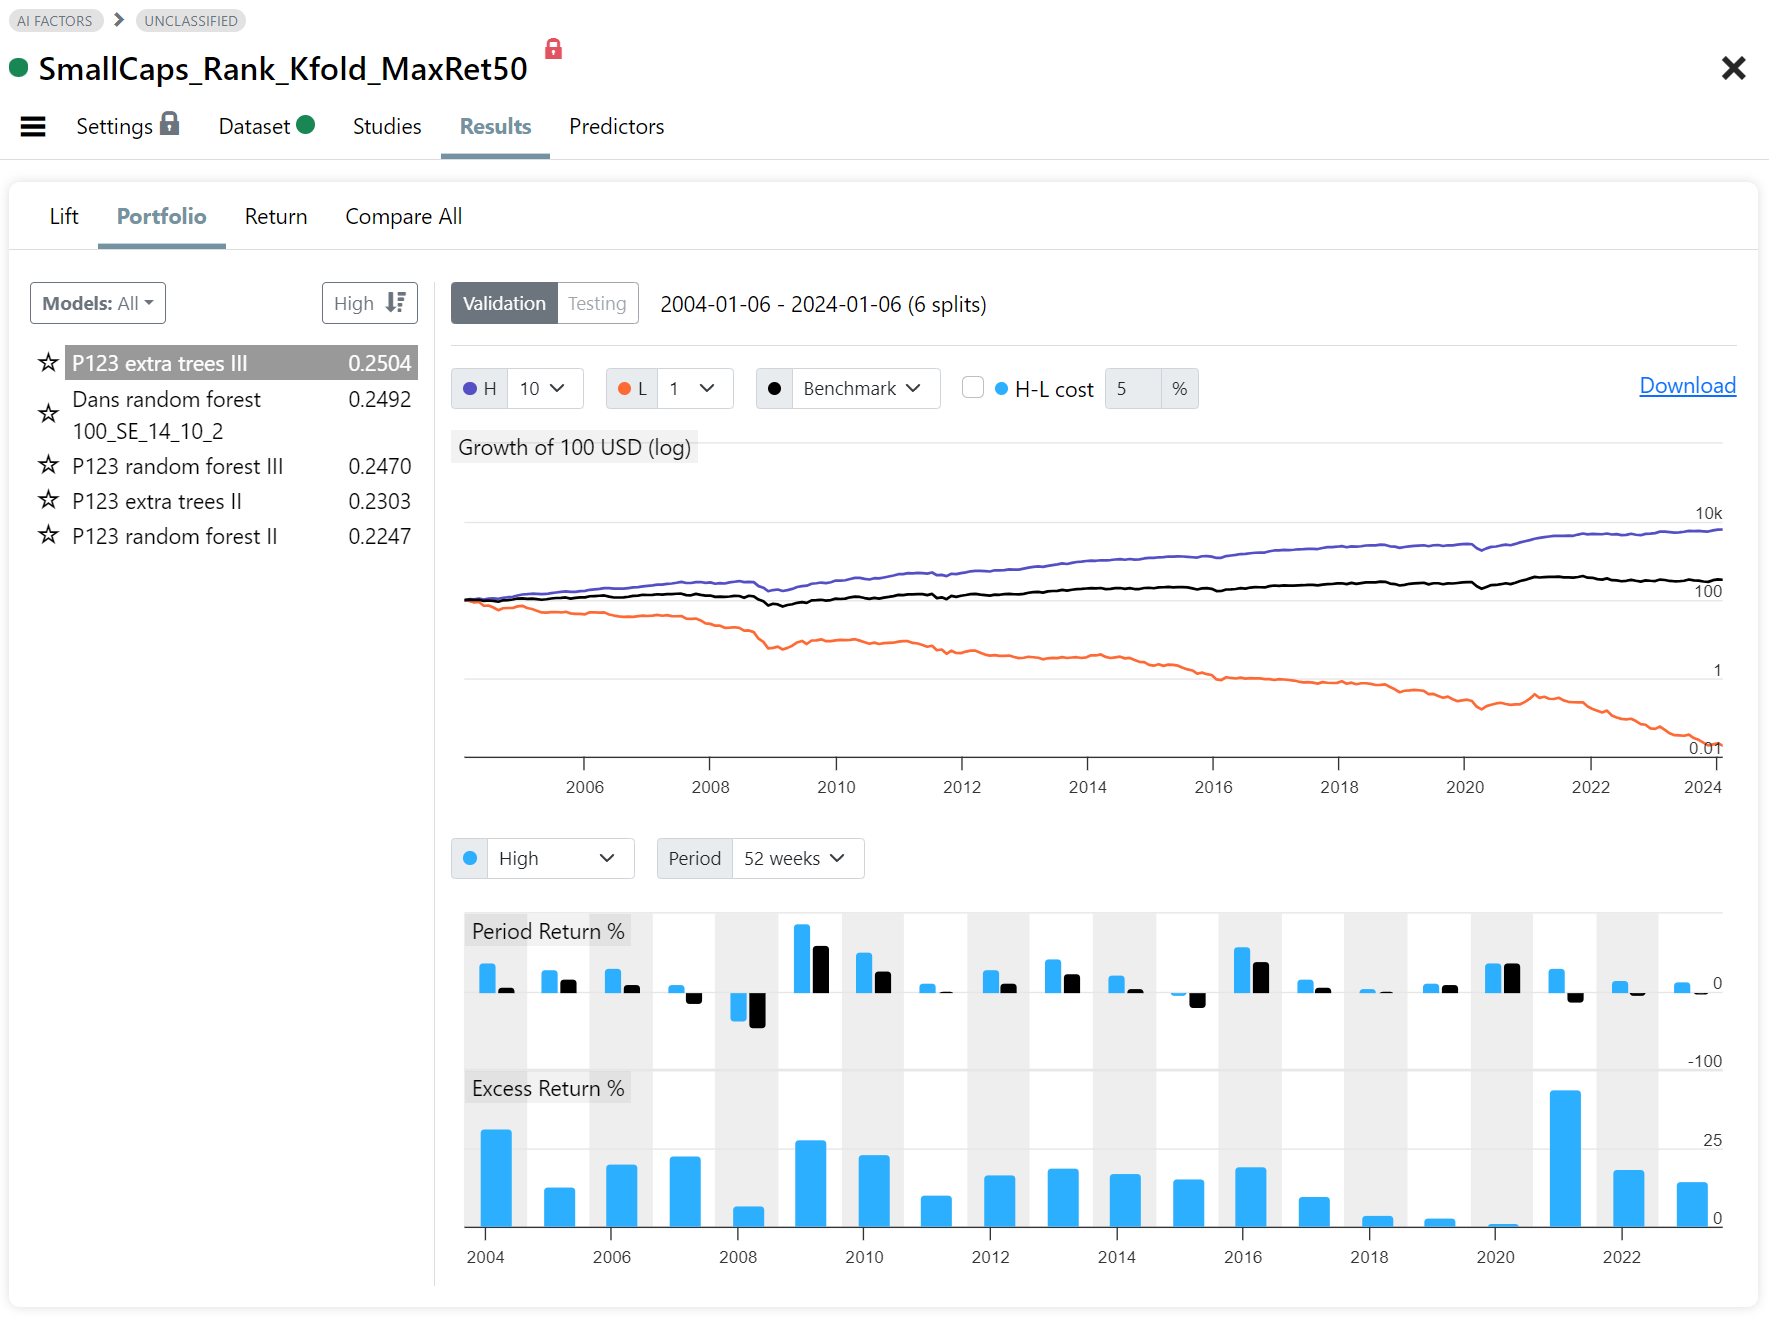
Fig 6. Results: Annualized returns for prediction deciles

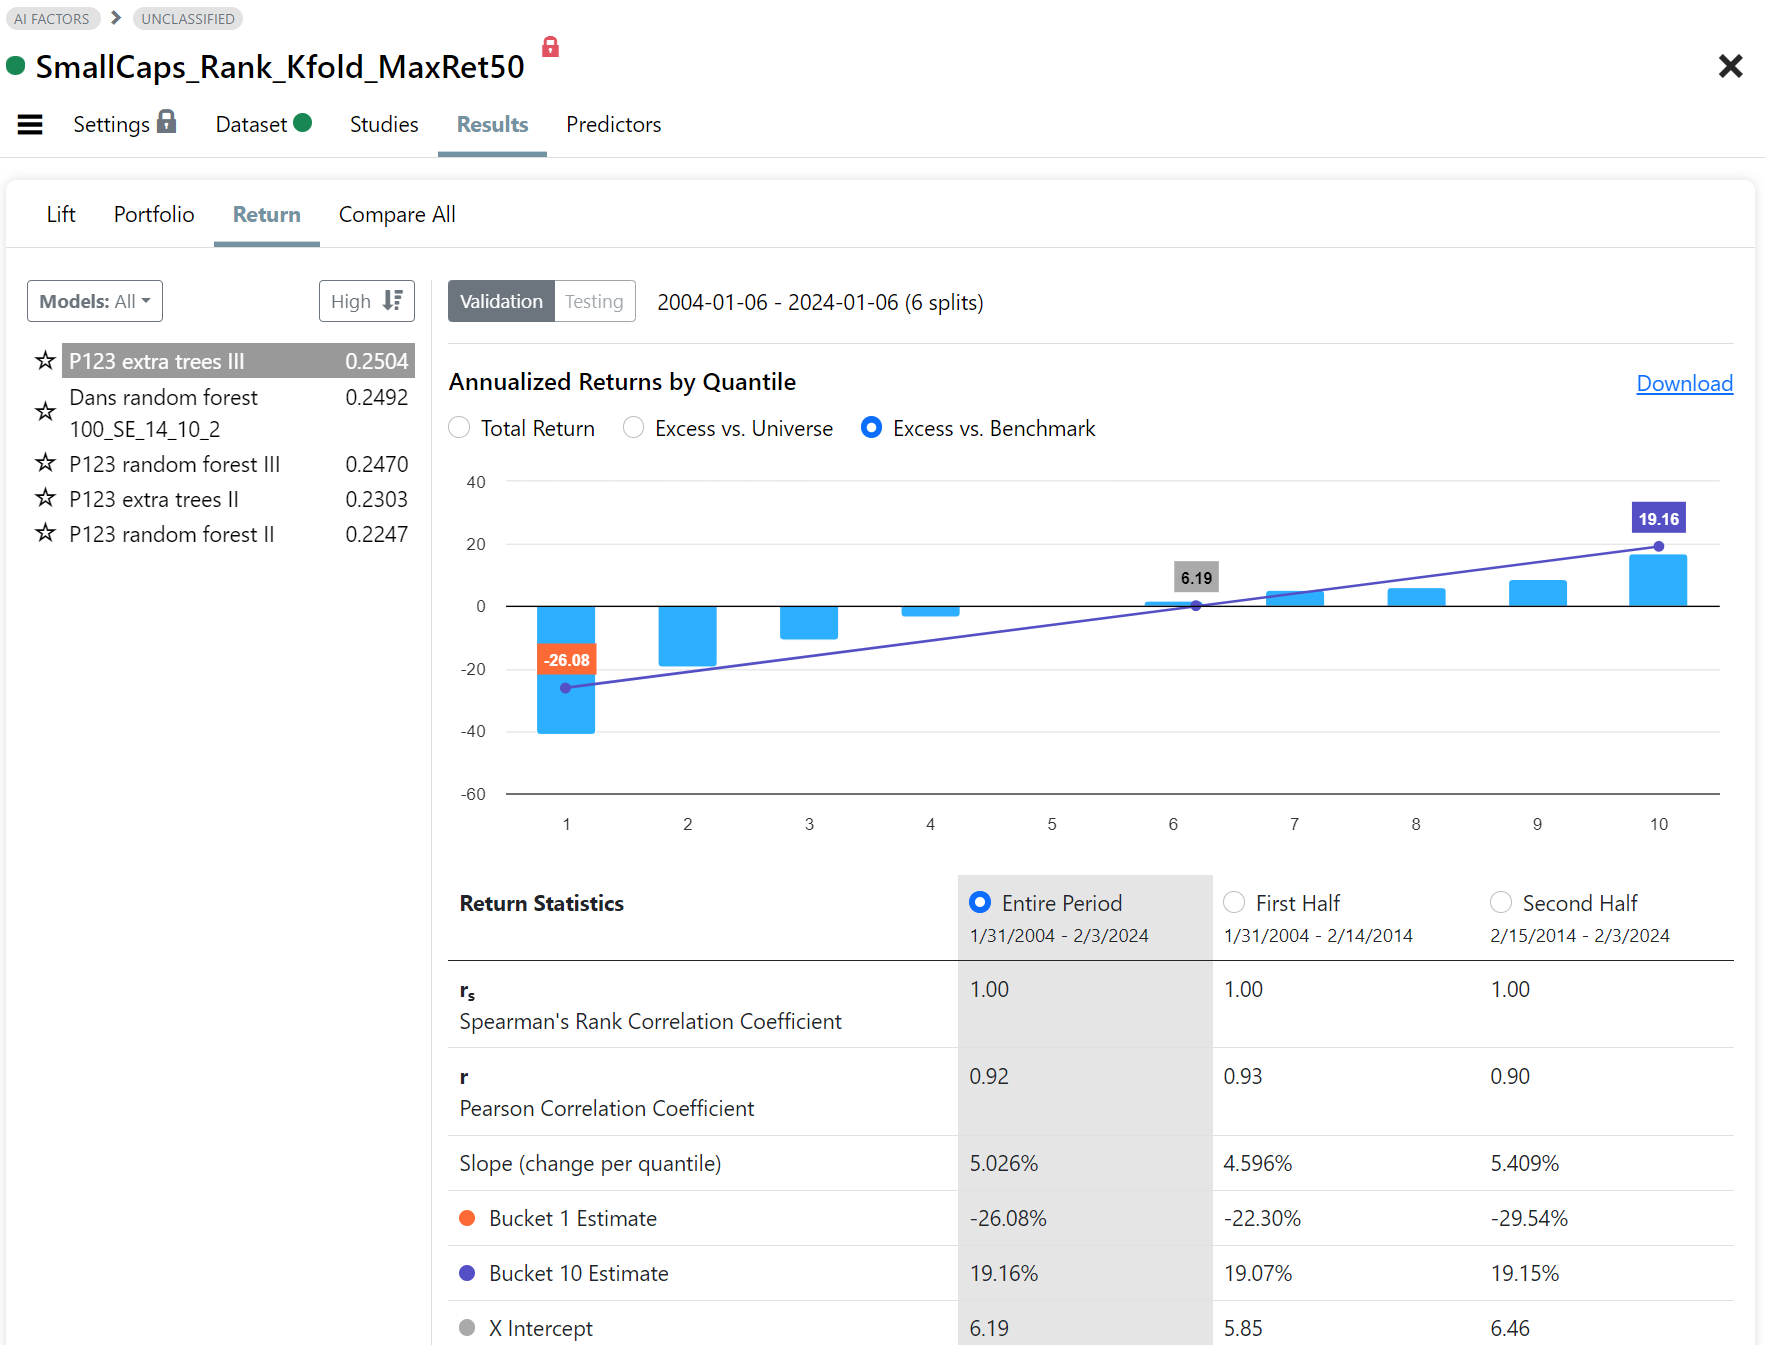
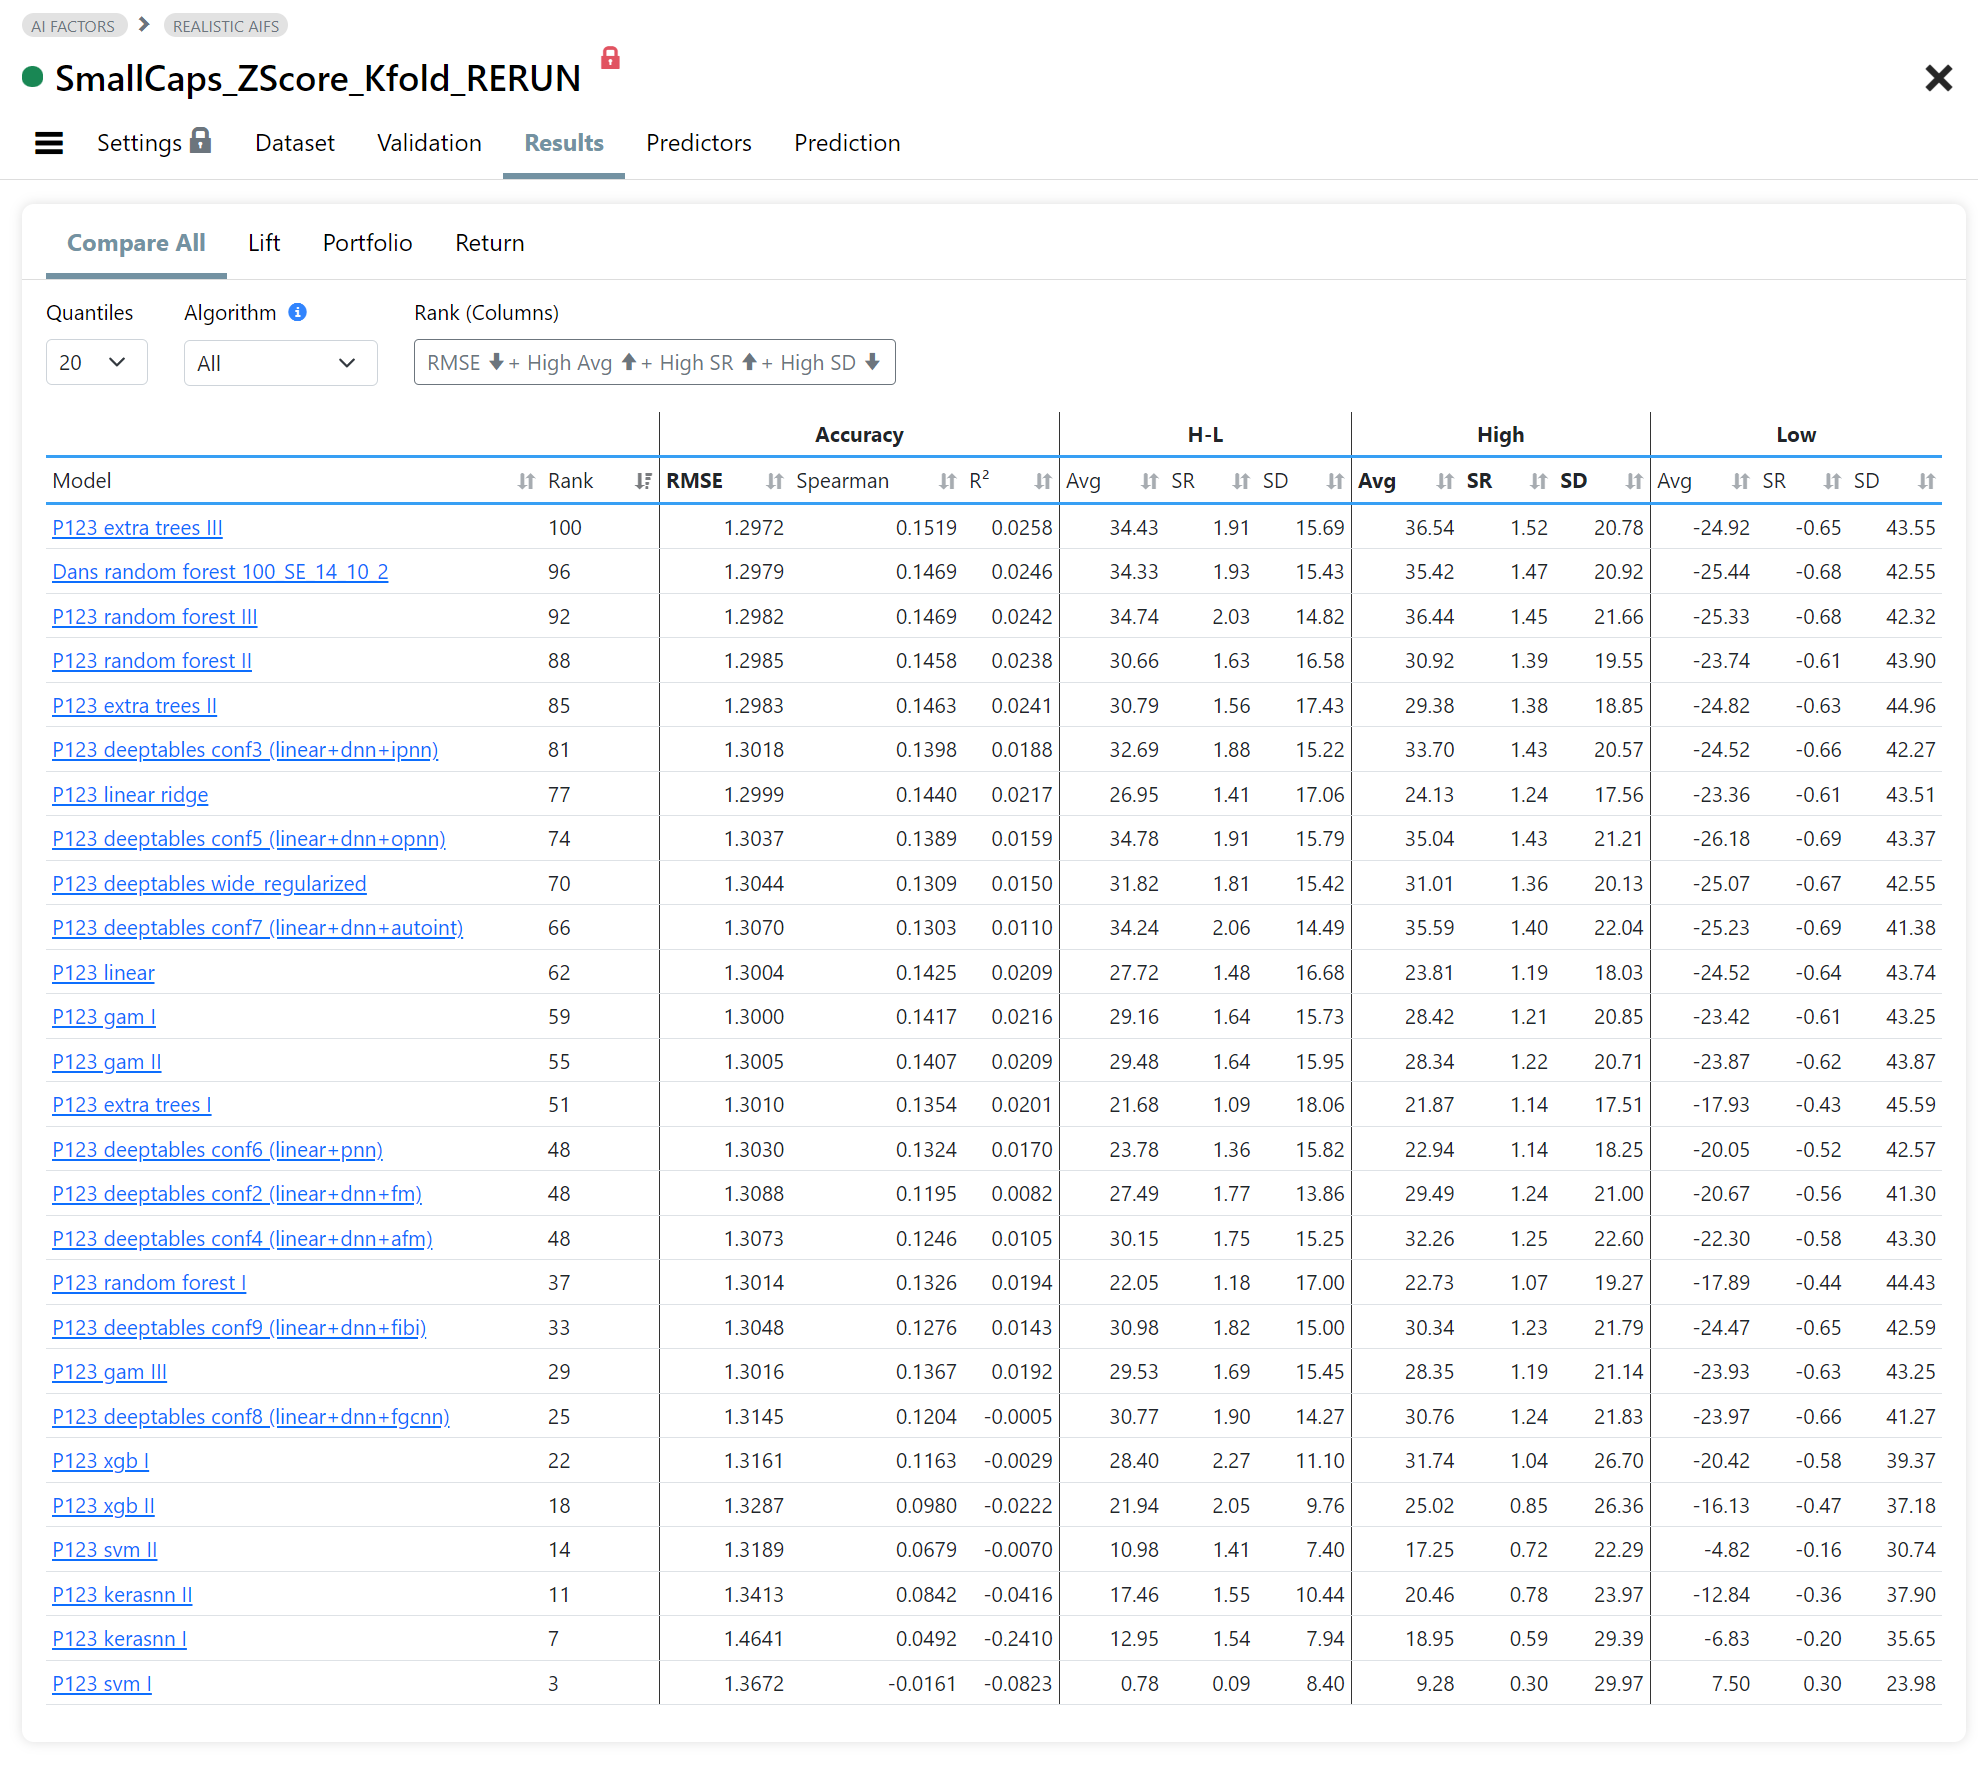
Fig 7. Compare Results

Table that compares accuracy statistics and portfolio statistics for each validated model (H=top bucket, L=bottom bucket, H-L=long short). The table is sorted by Rank which is a composite score of user selectable stats.

11 Likes

Looking good!

I have some questions about the screenshots, if I may dive into that already.

When it comes to the Lift Chart page, I can see that the models are sorted based on some sort of performance metric, used to rank the models. What is this metric?

I'm also trying to understand the Lift Chart itself better. I could wait until the tool goes live so I can click on the 'What does it mean?'-button, but I really want to find out now tbh :upside_down_face:.

When it comes to the x-axis, I guess 'm looking at the different percentiles of stocks (sorted by return from low to high). When it comes to the y-axis then, I'm guessing I'm looking at a return metric.

I'm not sure about what type of returns I'm looking at though, because 0.30 seems too high to be average 3m returns of the bottom percentiles of stocks in the validation holdout periods. It probably is also not the returns of the stocks held over the whole validation holdout period, because then 0.60 would seem to be too low for the cumulative returns of the stocks in the top percentile over the 20 years between 2004 and 2024. So if I would have to guess, I would say it is the average annualized returns over the validation holdout period. Would love to learn more.

Finally, when it comes to the system being trained by the models, I'm guessing it is a ranking system where the parameters that are being optimised are the weights of these factors. The ranking system that ends up being chosen is the one with where the factors best explain the variation in 3m future returns among the percentiles. The weights of the 'output' ranking system are fixed and do not fluctuate through time. Am I understanding that right?

1 Like

Can you already give us some insights about which AI methods you were using to optimize the target?

1 Like

Nice understanding of existing machine learning methods, I think! Using blocked CV with what appears to be an embargo period and recognizing the advantages of the Extra Trees regressor are examples of a deep understanding of machine learning. Not everyone has even heard of an Extra Trees regressor or the advantages the method has over a random forest (e.g., much more efficient use of computing resources).

But also, I am not aware of anyone explicitly sorting, then ranking, the machine learning predictions and then plugging that back into anything like P123 classic as a method. Probably some people already do something like that as it is pretty intuitive, but I have not seen it explicitly written up anywhere. And no where else will it be as easy to rebalance on a weekly or daily basis as P123 is making it here. P123 then even edits the transactions in the port automatically (if you want).

I don't think you can get that anywhere else.

1 Like

The "High" metric is the average annual return of the top decile of the predictions. You will be able to sort using several "data science" and "portfolio" stats, and combos.

The blue line is all the target predictions grouped in 100 percentiles. The red line is the average of the target actuals (in this case 3mo future relative return). Everything is normalized to the chosen preprocessor. In this example the "rank" preprocessor was used which normalized everything from 0 to 1, including the prediction. So 0.5 corresponds to around 0% relative return vs benchmark.

A key point with lift chart is that the actuals is an average, and they have a wide range. We experimented with different charts to show this volatility but it's pointless. Everything just looked like a blob. There's a lot of noise in financial predictions but all you need is a slight edge, and a way to detect it.

There's no system. All we are doing is creating portfolios based on deciles of the predictions in the holdout period of each split, then slapping it together in one contiguous performance. It's like running a rank performance analysis of a ranking system with only one factor: the AI factor prediction.

Caveat: we're still missing an important adjustment, which is slippage (which is available in the rank perf tool). So the results are optimistic right now.

4 Likes

I should mention that, unlike a ranking system performance test where the factor weights are static, the AI Factor performance uses different trained models: one for each split. So it's like adjusting the weights every three years in the example above.

This seems to be working quite well with more consistent results over the span of 20 years.

3 Likes

You mean which ML algorithms we are using and hyperparams? We have around 7 algos (some may be excluded since we can't get them to work) and a bunch of predefined models, but you will be able to create your own.

PS we define a Model as the ML algorithm + hyper parameters values.

3 Likes

Kudos for what looks like one superb system that appears to be relatively user friendly with excellent

analytic feedback. Especially like the inclusion of the four validation methods with k-fold cross-validation

and holdouts.

Especially like your retraining every selectable period:

β€œI should mention that, unlike a ranking system performance test where the factor weights are static, the

AI Factor performance uses different trained models: one for each split. So it's like adjusting the weights

every three years in the example above.”

For the example you show 3 random forest and one extra trees models. Are those the only

model options? In many papers ensemble models with SVM seem to improve the results.

Not trying to be greedy, what you have looks fantastic!

Our current lineup is:

XGBoost
Random Forest
Extra Trees
Linear Regression
Support Vector Machines
Generalized Additive Models
Keras NN
Deep Tables NN

You will be able to specify your own parameters. We're having issues with some of the above, so we may not include all of them initially.

We plan to fully support ensembles either directly or indirectly. BTW, I'm making up my own definitions:

Directly means that you can create an ensemble model which is then validated as any other single model. So it would just be another row in Fig 3, and you'd get a lift chart, and other stats. The disadvantage is that it's an ensemble of models trained used the same exact features.

An example of indirect ensemble is a ranking system made up of three models. The main advantage is that it can be composed of models trained on completely different features. The disadvantages are that you don't have the reporting you see here since they are three distinct AI factors (each with its own lift chart and stats).

I added an additional screenshot to my original post: Fig 7. Compare All, which shows all the validated models and their statistics. They are sorted by a user configurable Rank. Very powerful!

Click on the top of the scrollbar on Apr 10 to go back to the top to see the screenshot

Cheers

3 Likes

I'm relatively new to AI, but captivated by its potential applications. I'm eager to learn how AI-driven systems compare to our conventional, static systems, particularly in terms of transparency and replicability.

When you discuss constructing portfolios based on deciles of predictions for each split, this method seems robust. However, this approach appears to heavily rely on AI predictions. I'm curious about the transparency of such a system to its users. Could this reliance on AI lead to a situation where the decision-making processes and outcomes are not easily interpretable or verifiable?

Given the unique nature of AI outputs, I also wonder how this impacts the ability to conduct independent backtesting. Is it challenging, or perhaps even impractical, to replicate such analyses? Furthermore, how can we ensure the reliability of these AI systems? Are there established methods or standards in place to verify and validate the outputs of these systems, and how transparent are these processes to its users?

looks good :clap:

@Hedgehog It should be possible to replicate results for linear regression, ridge regression and a relatively shallow decision tree if p123 will disclose parameters/rules of the model for each period.

Then you may discover that in a specific period you invest in stocks with high P/E... because these stocks performed well in previous period.

One suggestion : I would be happy to see an option to force parameters to be either positive or zero for linear models.

I can see that Linear and Ridge Regression do pretty well in comparison to deep ml models.

1 Like

I agree that regression coefficients are pretty transparent. Pretty similar to the weights in a ranking system for me.

As Pitmaster suggests, it is helpful to look at some decisions trees and understand why they are making the splits that they make. After doing that, looking at the feature importances. is enough for me personally.

2 Likes

@pitmaster, I've been following your discussions on AI/ML here. It's clear you have a solid understanding, especially in finance math.

I was wondering if you'd be open to discussing my requests for covariance matrices, risk models, volatility adjusted studies, or more detailed betas/alpha studies. It seems like these topics have been overlooked, and I value your insights on them. Could you share your thoughts?

Gradient boosted decision trees (GBDT) are most often the winning models in Kaggle tabular data (such as P123 data) competitions. From those, CatBoost is the most modern one. Linear regression with regularization is a great baseline model and for explainability but requires more work on feature engineering and not sure if P123 would provide tools for that. My personal experience, evidence from Kaggle and some papers is that neural networks do not work well with tabular data. I wouldn't bother if need to prioritize.

One question @marco: How do you handle missing values for AI? GBDT can handle missing values natively but other algorithms require imputation or removal.

We'll look into adding GBDT. Should be straight forward. Thanks

Can you delve into some examples of feature engineering? What we have now is not much:

  • mutual info regression with target
  • stats on NA's for each feature
  • histogram tools like in the factor download tool

We have plans for adding a feature importance analysis using different models.

Re. NAs. All data in the dataset is normalized (either Z-score or rank) and NA's go to the middle. If a stock has over 30% NA's on a particular date it's removed from training, and on the prediction side it gets none.

Of course you can manage NA's yourself using formulas (like IsNA(xxx,999) and adjusting your custom universe

We've been noticing that as well. We didn't invest too much in GPU hardware (although they do take up a lot of space in the rack).

Guess we'll repurpose them for other things: chart pattern recognition, reading filings ? Or with other models like 🧠 NeuralForecast - Nixtla

Making XGBoost (and the other AI/ML methods) available is an impressive accomplishment and you have already provided GBDT.

XGBoost IS gradient boosting (GBDT) and uses decision trees. And you can do Stochastic Gradient Boosting (link is to original paper) with XGBoost too, if you want to get wonky. In fact, you probably should try it if you have access to that hyper-parameter in XGBoost.

Stochastic gradient descent is faster and the paper suggests is can be better by preventing overfitting.

CatBoost is well-liked, I understand. It has advantages for both continuous and categorical variables. The "Cat-" in CatBoost stands for categoricalβ€”where CatBoost really shines.

Put simply, CatBoost would be particularly good for Boolean variables (e.g., Piotroski's 9 variables). You have to use one-hot coding with XGBoost to use categorical variables but you can use categorical variable in XGBoost too.

It would be nice tho have access to any library in Python within the AI/ML, including CatBoost. But P123 is already making a very capable gradient boosting method available with XGBoost.

Thanks P123.

Jim

@marco In Python, you can enable GPU acceleration in XGBoost by setting the tree_method parameter to 'gpu_hist' when creating the XGBoost model.

As long as you happen have those GPU units available and they are not being used for something else, it speeds things up TREMENDOUSLY and the histogram method (with or without a GPU) can act as a regularizerβ€”often improving the resultsβ€”in addition to speeding things up.

Using hist is equivalent to grouping the factors into buckets (or bins) which we are used to doing at P123. And most users can intuitively understand that the data gets noisy with 200 or more buckets. Hist can reduce this noise, often giving better results while being much faster.

"gpu_exact" and "gpu_approx" are also available for XGBoost. One of the main developers and maintainers of XGBoost, Rory Mitchell, works at NVIDIA (which makes GPUs). Parallelization has been one of the main advantages of XGBoost. But XGBoost can parallelize the computation of feature statistics and split the work across multiple CPU cores or GPU devices, as you probably know.

CatBoost does not have builtin GPU support but it makes good use of multicore CPUs for parallelization..
.
Jim

1 Like

I think this is a pretty good discussion of several topics in this thread (sent to me by James): ML paper.pdf (3.0 MB)

2 Likes

Thanks for paper. They are using classifiers algorithms (ex. RandomForestClassifier) with total return targets:

12-month return Target variable Target Variable
π‘Ÿπ‘’π‘‘π‘’π‘Ÿπ‘› β‰₯ 0.15 4
0.05 ≀ π‘Ÿπ‘’π‘‘π‘’π‘Ÿπ‘› < 0.15 3
0 ≀ π‘Ÿπ‘’π‘‘π‘’π‘Ÿπ‘› < 0.05 2
βˆ’0.15 ≀ π‘Ÿπ‘’π‘‘π‘’π‘Ÿπ‘› < 0 1
π‘Ÿπ‘’π‘‘π‘’π‘Ÿπ‘› < βˆ’0.15 0

It's strange that they used total return. I tried using a total return target (although with a regressor since we have not added classifier at the moment) also with SP500 universe, and it completely destroys the High - Low bucket performance. The High bucket I guess still shows some performance, but I would not use total return targets.

Intuitively only relative performance targets make sense, whether you use classifiers or regressors. Thoughts?

1 Like