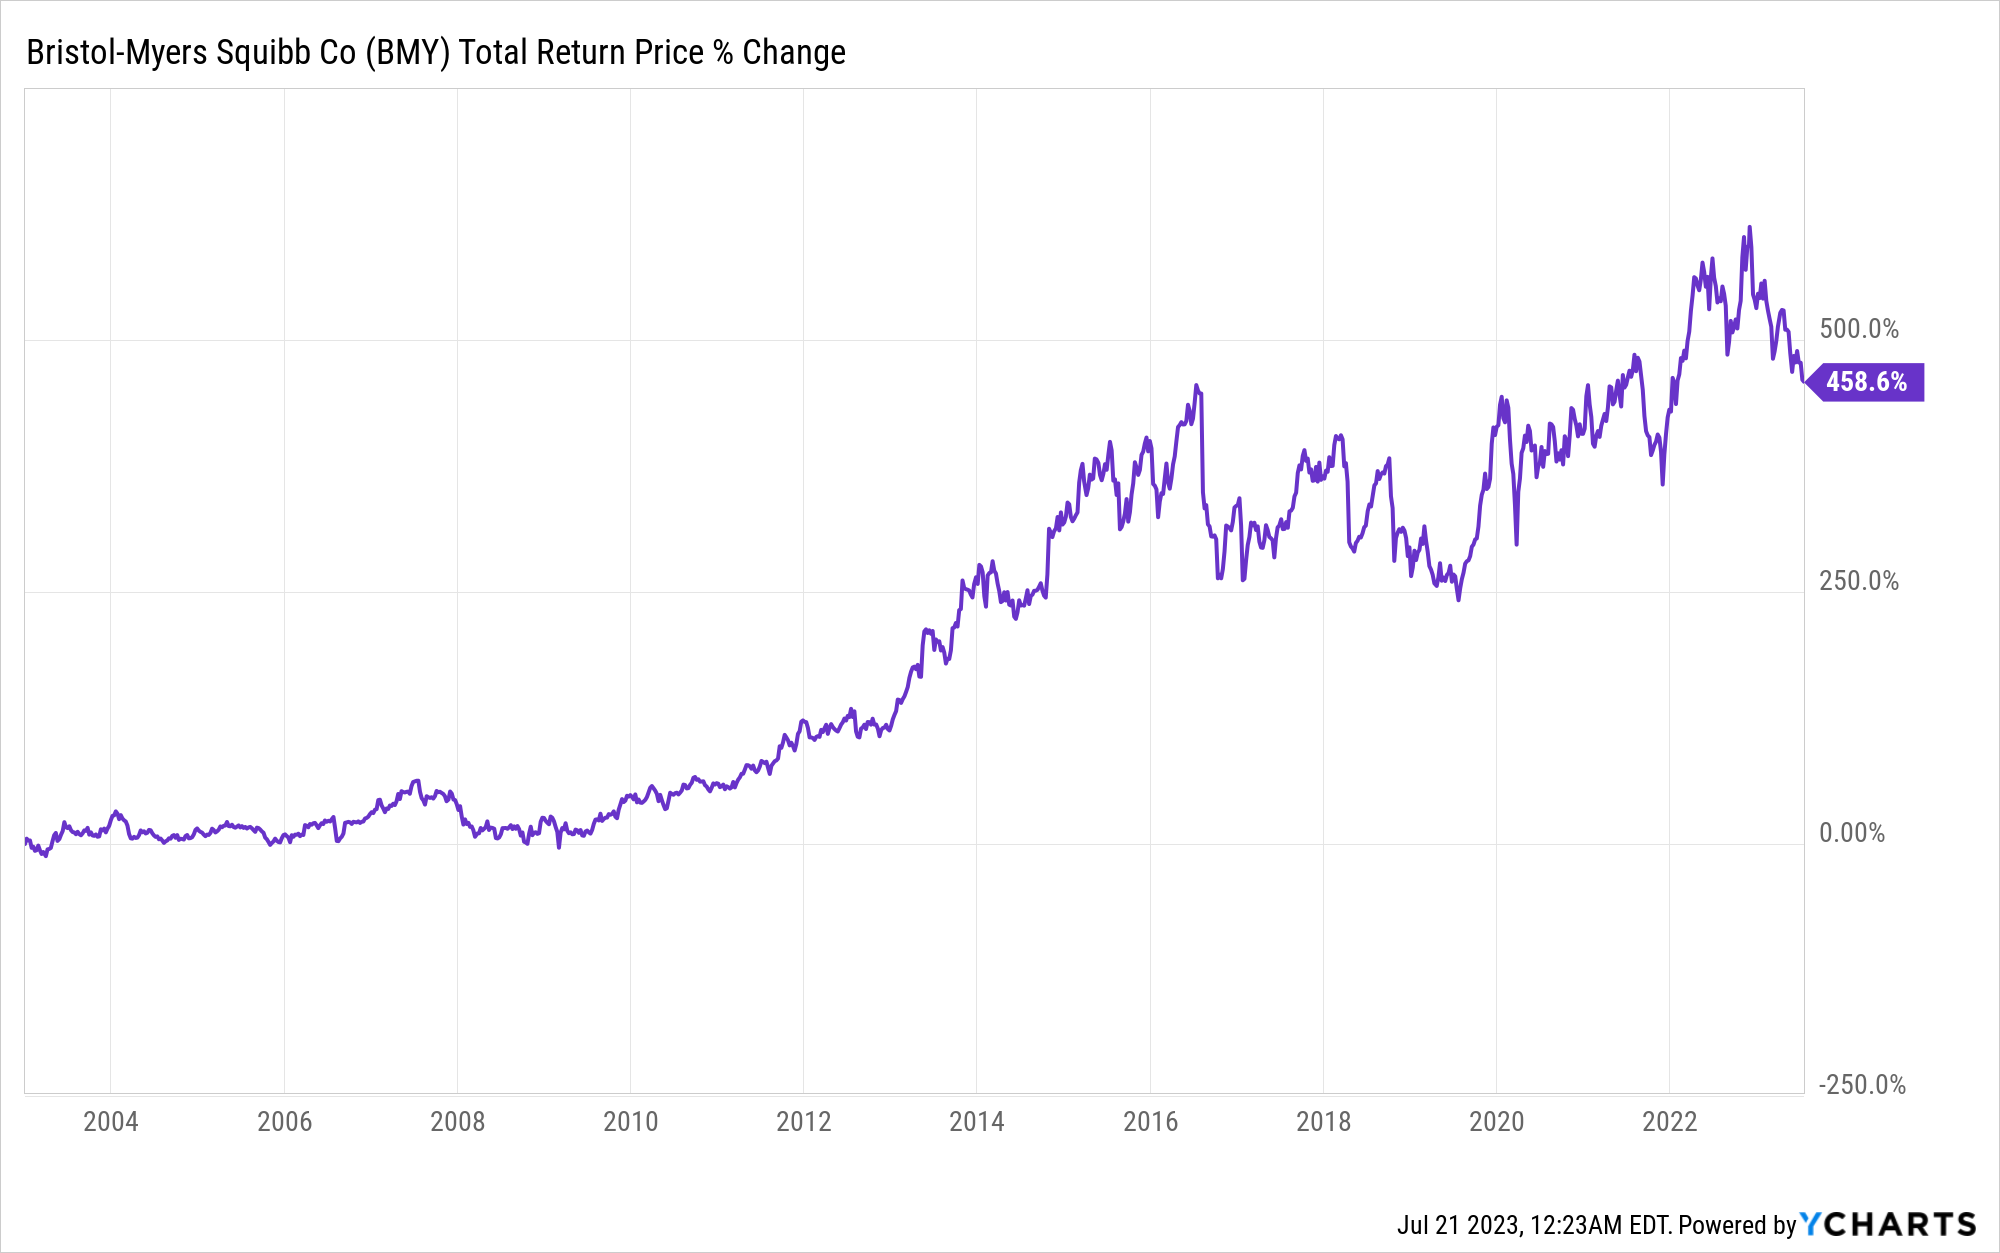
There seems to be an issue, i cannot explain, with the pricing data in portfolio123.com. The price data is dividend and split adjusted so its meant to reflect the total return an investor would receive (in price gains and dividends re-invested on the same date (?)) if he has a position during a period. I did a simulation with two ticker symbols (Altria Group - MO and Bristol Myers - BMY) between 01JAN2003 - 19JUL2023 and the results are substantially different between the portfolio123 pricing data and the return an investor would receive if he was invested during the same period and reinvested the dividends on the same date - see attached.
Basically the return exhibited by the portfoio123 pricing is substantially higher compared to the return an investor would get by reinvesting the dividends collected. The difference is more profound the higher the dividends that get paid through the period.
Doing a quick spot check. Seems like you are using the record date of the dividend, at least in BMY, instead of using the payable date. The dates you have listed in excel for dividends paid are off by a month. That may account for it.
Thank you @hemmerling! I don’t think that would explain such vast differences. Also the higher the dividend payouts during the period, the more profound the difference.
In any case I pushed the payment forward by 4 weeks and the difference remains as large if not larger.
But what is your dividend based on? Is it just for 1 share? The dividend should be multiplied by the amount of fractional shares owned. But I think it stays static as a dividend for just 1 share.
For instance, you have a 0.57 dividend on July 6 2023. But it should be 0.57 x 1.76 shares owned (or whatever the newer and higher shares owned will be now)
He is trying to calculate the dividend adjustment by hand. Which is fine. But in MO where he has close to 5 shares, he is still only adding in the dividend for 1 share. Once this is fixed I am sure it will work out fine. I cross-checked P123’s results with other data-bases.