I just finished this P123 Recommended Reading and it was pretty good. He draws some of the same conclusions as Greenblatt and OShauhnessy in terms of what factors/formulas work best - EV/EBITDA and ROIC but he also goes over many other examples of combinations of factors that make sense together. He debunks some too, like ROA. I am not sure I agree with all of his conclusions but I like how he creates a hypothesis of what should work based upon linking factors from different financial statements (income, balance and cash flow) and then trying to tie them together in a way that makes both theoretical as well as real world success. he gives many examples.
He uses a quality database and methodology and he has a broader timeframe for testing than what we currently have in P123 so it is good to see the extra data.
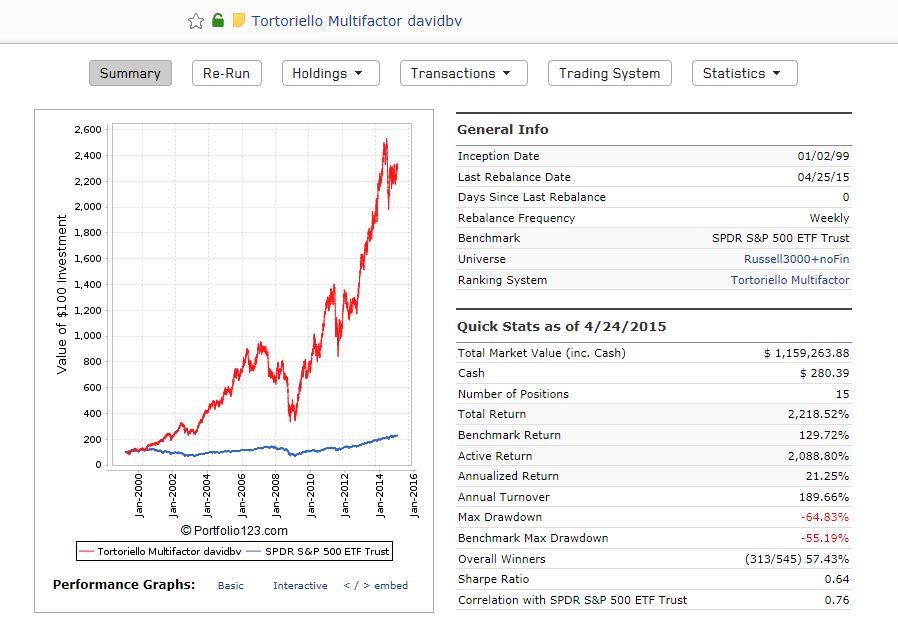
I created this sim based upon his multifactor model he gives at the end of the book. I copied his weightings since they seemed to make sense and worked ok (it was interesting that he weighted valuation factors in the same way that I normally do, about 40-50%).
Here you go if you are interested. It gives reasonable results for a 15 stock, low turnover, medium liquidity model. If you make any startling improvements, please let me know.
Tortoriello looked for companies that have reduced both their long term debt and number of shares. He looks at the actual dollar figures spent as a percent of assets. He admits that companies can play games with both so he added the share reduction factor as well (as Piotroski and OShaugnessy do) in the ranking system.
As an aside, he also said in the book that for a debt management factor (as an example), he found comparing debt (balance sheet) to EBITDA (income statement) or FCF (cash flow) was better than comparing debt to equity (both are balance sheet). ‘Mixed’ factors gave better performance. His reasoning and examples were a good part of the book.
Thanks, I never even thought to try searching for it from the Custom Formula area.
All of the factors except ROICttm and ROICfcfttm and Sharereduction were there. I guessed at those.
How much to you allow the maximum weight to drift? In a strong fundamental ranking I would favour allowing it to be 50%, particularly with the weekly rebalancing and tight Ranking.
Hi, I did not really due any tuning. 50% seems to give ~ the same as 30%. I did try it with other universes, holding sizes and Evenid over different time spans. With this universe (which I like because it is easily tradeable), the ranking system suggested 15 holdings. I like to use a 30% SecWeight buy rule to give diversification. Sell rule 98 gave consistent performance for Evenid over different time spans with low turnover.
The two things I wish were better are a AR>25% for the last 10 years and dealing with the big drawdown in 2011.
So I am not sure how good this model is overall but I do like the ideas and strategies he presents in the book. I’ll probably read it again.
I use Shsoutavg because it smooths the share count and gives more realistic results than sharesFD.
They are all unlocked now.
I check for negative equity because I am trying to be conservative in the companies selected. I know that some companies can temporarily have negative equity, and not die, but I don’t even want to take the chance.
Higher is better. EV can be negative, which is not always bad (no debt and lots of cash) but being conservative.
$52Wpricerange:
(Price-PriceL)/(PriceH-PriceL)
Looks for stock making recent highs. I think this is weird because it almost guarantees you are not buying at a low. But Torttoriello liked it, along with the 26W (he actually preferred 7 month) momentum.
FYI, I also found this book review on the website ‘Fat Pitch Financials’ from 2012. It too references P123.
Thank you for creating a Tortoriello ranking system. I tried to use your public ranking system but get an error
(Error generating graph: In ‘EBITDATTM2EV’-> Error near ‘$EBITDATTM2EV’: Invalid command ‘$EBITDATTM2EV’)
Derek, see my response to Gary earlier in the thread.
Since you are looking at this, I have done some more testing and honestly, the ranking system I created is not robust. Results vary too much using Evenid over different time frames. He used a Monte Carlo like data set to create the weighting and I think it is a good example of curve fitting. I think most of the factors make sense for finding sound companies with good cash flow (I like cash flow statement derived factors as he seems to). If you come up with a better model, please share, as well as your thought processes.