Renaissance Technologies

Thank you Yuval. EVERYTHING gets blamed on over optimization. Yuval presents evidence that the answer may be more nuanced. Nuanced enough that I am sure I do not have an answer now. Maybe someone else does. But it should be looked at rationally as Yuval is doing here.

If P123 can do it they should run the Designer Models WITH NO SLIPPAGE and see if that takes care of the problem. It could be that our result are fairly random with the guaranteed drag of slippage. It may be a simple answer.

Yuval posted an excellent reason that timing should not work most of the time (the market is usual up). P123 should see if they can look at this as a potential problem.

We now have some pretty convincing evidence that optimization of sims has some sort of problem—whatever that problems is. GEORG IS JUST CORRECT ABOUT THIS, PERIOD. Yuval presents anecdotal evidence that optimization may not be the problem or at least not the entire problem. Please correct me if that is not what this study shows or if there is another more important lesson from the study.

P123 hired an AI expert who looked at Random Forests. They were understandably frustrated with the fact that this was no better than Random. RANDOM IS LOOKING GOOD NOW AS THE EVIDENCE WE NOW HAVE SHOWS THAT RANDOM FORESTS ARE BETTER THAN SIMS.

Sims are not Random but are statistically inferior. The “null hypothesis” that sims are equivalent to a random selection of stocks from the universe can probably be rejected.

This specific experiment should be done to be sure this statement is true. Someone with knowledge of this LIKE GEORG should do a paired comparison of sims with equal weigh of factors that seem good and compare this to a random selection of stocks from the universe. Perhaps P123 could randomly select from the 50 factors that they gave to the AI expert for this. Do this enough times to get an answer (this is NOT rocket science).

P123 was going to look at support vector machines (hire the AI expert to do this). I think this can work ALONG WITH FEATURE SELECTION. The SVM must look a nonlinear solutions for this to work.

P123 should look for proof of concept. See if machine learning can work. Once it is shown let the P123 members find the best solutions and sell them as an expanded version of Designer Models. Of course, proof of concept may be desired first.

The first attempt at machine learning—with a Random Forest—seems to be better than sims already. At least it was not shown to be a way to steadily lose money.

I have few answers. I have some anecdotal evidence that machine learning can outperform sims. I certainly do not have access to enough data to prove it.

If P123 could find something that is proven to work with an intelligent selection of factors it would be helpful to their business model. This may be a proprietary method owned by Renaissance Technologies at this point. Maybe, knowledge is not owned by anyone. But it is NOT rocket science.

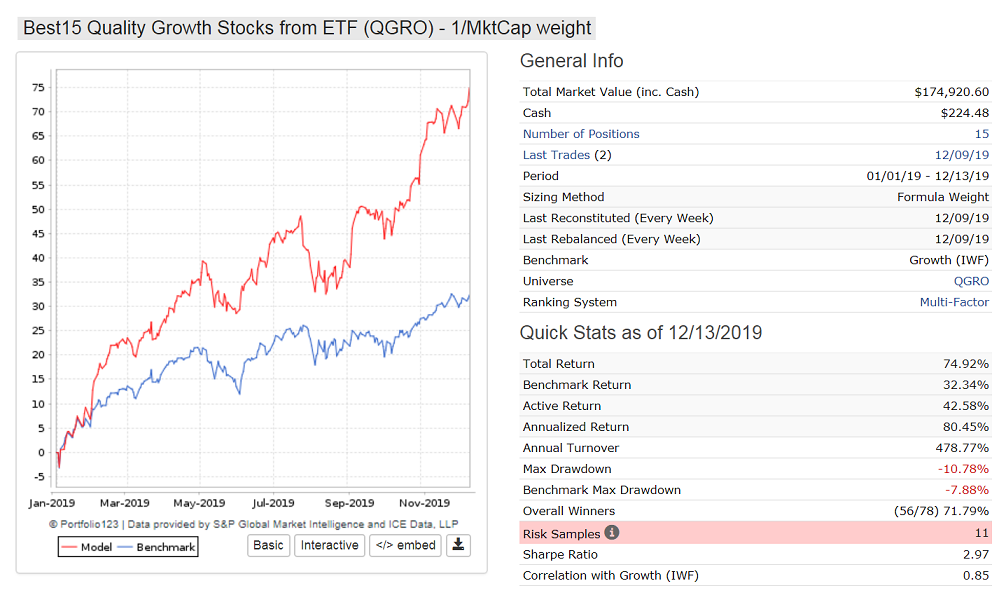
I do not think hiding the fact that a port is generally a method of gradually giving away your money is a good business model. A t-score of 11 is a tough handicap. People will eventually leave P123—because they have no money to invest if for no other reason. I miss Oliver Keating. Some of his GREAT IDEAS are performing terribly. Why did he leave? He is smart enough to know when something does not work. I would have bet that DennyHawles’ models would have work. Why didn’t they? Just market timing?

I had extreme respect for Oliver Keating!!! If his sims cannot perform then mine cannot either (long term). This is simple fact. Since he is gone now, because he has a large number of sims (24), and because there is no recent survivorship bias we could look at his stuff (with other good samples). 2-year excess returns -26. I have not looked at his 5-year excess returns. Denny’s models speak for themselves with out any statistics.

I have been a big fan of P123 but I am not going to chase a bunch of cherry-picked backtests. If the sims I have now (that have done okay out-of-sample up until now ) do not rebound in a year or two I will move completely to a method that uses price data to select Sector ETFs. I will probably stay with P123 to get this data. But Yahoo has this data.

I would check slippage and timing first. I am not saying I know here in December of 2019. But I will know at some point (it is NOT rocket science). I do not know if P123 will be with me then. So far they have been hostile toward finding out—with Yuval’s study here being (perhaps) sign of a change at P123. It is a first step.

-Jim

keating ranking, 3 Month rebalanced not changed since then…


used the same ranking from 2011 - 14 too… not optimized… was able to beat transaction costs realtime too!

Yes. It appears all quants are “over optimized”, even the old time pros like Assness and O’Shaughnessy, if they’ve been buying value or quality or small caps the last few years.

Andreas,

Make sure to share some of your abilities in the Designer Models when you get a chance. You have enough models that your average result on these models would be good if you had a secret that you are sharing with us in these models.

I am happy to keep the discussion to Olikea or the all of the Designers as a group if people would not make anecdotal claims that cannot be verified. This is important enough to P123 that we need objective data, I think.

Anecdotal stuff, Cherry-picking needs to stop if P123 is to survive.

Fundamental analysis until we buy black boxes that do not work is a business model that can be expanded upon, IMHO. Andreas’ model aside: it is not a black box perhaps. Maybe we can just all use his model. I might even subscribe to help Andreas. I will want out-if-sample result before I put any money in it.

-Jim

Good to know.

With regard to P123 we manage to underperform even value benchmarks when used.

One could repeat Georg’s study where a value index is used as benchmark for all models to get more information on this hypothesis. Not sure what it would show.

Georg presented convincing evidence for 5 years. Not a few.

But you present a hypothesis that will be tested with time.

I only suggest that we do a little active testing. If people would prefer to just let Designer Models run for another 5 years and see what comments we get in the forum it is a plan at least.

BTW, has anyone seen a p-value like Georg gets? I understand we are to accept anything we are linked to over at SeekingAlpha but not the best p-value you have ever seen.

Good luck with that.

-Jim

So here is the evidence that backtesting does not provide a good indication for OOS performance:

I have selected 25 DMs with large + mid caps >=70% all with inception date earlier than 5 years ago and put them into a book. (25 models is the max allowed in a book.)

Look at the backtest from 2002 to 2014. That is the backtest period which designers considered. From Figure-1 one can see that designers did very well. Annualized return= 28.6% with a max D/D= -18%. The 2008 financial crises is not even visible on the performance curve. Calendar year performance is equally impressive - every year has positive returns all exceeding that of SPY, all as shown in Figure-2.

So why did this great simulated performance not continue over the 5-year out-of-sample period 12/1/2014 to 12/2/2019 (Figure-3)?

Almost immediately the combo starts under-performing SPY, over 2015 by -4.0%. How can that be when for each of the preceding 13 years it out-performed SPY?

Over the last 5 years the annualized return= 5.0% with a max D/D= -21%. Calendar year performance is equally unimpressive - every year the 25 DMs underperformed SPY, 2015 to 2019: -4.04%, -6.34%, -4.33%, -4.89%, -11.48%.

Performance relative to Value is not much better. Calendar year performance relative to IWD is equally unimpressive - 2015 to 2019: 1.17%, -11.60%, 3.93%, -1.01%, -7.20%.


Georg,

Thank you.

Shouldn’t P123 hope this is overfitting? I think they should.

Twice you mentioned AIC which will stop overfitting in its tracks. I leave it to you to try to explain how you would implement this to the staff at P123 and the members—if you think anyone (other than me) will listen to you the third time. I think they should.

AIC is good. I also like LASSO regression. That would mean using that m x n array I keep mentioning to do a LASSO regression. But once the features are selected you could move back to a rank performance optimazation with the selected features. BTW, LASSO or AIC would not use much computer resources.

Result: no more overfitting. Gone, nada, none. Zero, zip overfitting. The big goose egg….

Ultimately I would use something related, myself, but I doubt we will get past AIC or LASSO regression in any discussion.

Anyway, I think P123 should hope the problem is the easily addressed problem of overfitting and give us the tools to end the problem (if that is what the problem is). P123 should hire a consultant if Georg is not understood by P123 staff this third time.

It is NOT rocket science. But you cannot read a post about this somewhere and become an expert either. Georg has obviously studied this to know this as well as he does. But I am going to stick my neck out and say that despite his obvious training and credentials he might not have been a “Rocket Scientist.”

Okay, it helps to be a Rocket Scientist or Engineer like Georg. People should really listen to his ideas about AIC and maybe some of the other methods of addressing overfitting. If overfitting is the cause of the poor Designer Model performance if would probably pay to hire a consultant to make sure Georg is understood.

-Jim

Yuval:

In my opinion your first two points are very plausible, and your final one is an absolute certainly.

From a logical and behavioral perspective point 3 has to be true — if a model or group of related models did not have “a blue streak … some long periods of underperformance” then everybody along with all their siblings and cousins would eventually be using the model and it would then stop working for — and this is key — stop working for long enough to get the majority of people to stop using it. At that point it would have a good probability of starting to work again.

Put in other words, if a method is going to work over the long term it has to inflict enough pain, from time to time, along the way to get most people to quit. It is a variation of “no pain, no gain”.

Our data only goes back to 1999, but I’ve heard some who have access to data from the 1990s say that value and small caps did not work very well compared to the growth and larger caps during that period. From that perspective it is not surprising that the typical P123 portfolio (mine included) back tested very well from 2000-2002 (general bear market for the large indexes and range bound for the R2000) and continued to do outstanding well for 2003-2007. Many of our models did well for 2009-2017. Our methods are currently in a 1.5 year period of painful underperformance.

Will this period of underperformance be over in 3 months or 3 more years. I have no idea of the duration but I believer it will need to be long enough and painful enough to get the majority of money to stop using the types of value and small cap models that worked will in the past.

Well that’s my 2 cents.

Brian

You’ve probably heard that a picture is worth a thousand words. Here is one of those pictures. In order to make the right decisions, you need to know the facts.

As you can see, this older ranking system did its job even over the most recent twelve tough months. Yet, it did not beat SPY!

Think: How could SPY beat all the buckets? What does this tell us about what happened? What does this tell us about the power of the ranking systems?

Suggestion: Use the correct benchmark. Russell 3000 equal weight is close enough, but an equal weight of the sims universe is even better, especially for targeted universes.

A DM might be working. Or it might not. But what do you learn by comparing it to the SPY?


Good thoughts. And ultimately it may take a lot of ideas to express our present situation.

The idea that there are a series of events for us to have only 8% of Designer Models beating their benchmark over a 5 year period is a good one. And as Georg said:

Not wrong to think there may be multiple problems including the above ideas, I would guess. I am not sure it is even possible for just one thing to do this.

I think posts implying there is just one problem–so no worries–are pure speculation.

BTW, Does equal weighting remove the problem of overfitting? I think not. Otherwise, feature selection to remove noise factors would not be the standard of for statistical learning. Look to Georg’s suggestion of AIC for an informed idea about removing noise factor that cause overfitting. You may need to search it for now.

Generally, factors are removed and not given equal weight to prevent overfitting.

Which is not to say overfitting is the only problem. But I see no evidence that it is not one of the factors—not in this thread for sure. I do think P123 should hire a consultant to give us the tools to end overfitting when it is a problem for a Designer.

-Jim

Over the last 5 years the annualized return of Morningstar’s “Small Value” category is 5.0%. O’Shaughnessy Asset Management’s Small Cap Value Fund’s performance isn’t 5 years old yet, but it has lagged the “Small Value” category by a compounded average of 61 basis points per year over the last three years, so I suspect that if it had been 5 years old, it would have done worse than 5%. I have read a lot about this fund, and it is not over-optimized based on backtests. It is a very well-run and well-designed fund that uses many of the same principles that Portfolio123 has always espoused.

I think we should all accept that the S&P 500 has outperformed everything in sight and that the markets over the last few years have been extremely kind to investors. Considering that capital inflows into public markets have been high recently while inflation has been low, it has been very hard for small-cap value-based strategies (and that’s what most of the designer models are) to outperform a large-cap index.

I also think that if one were to create a strategy that WOULD have outperformed SPY in the last five years, it would have no better chance of excellent out-of-sample returns than a strategy created by the same methods five years ago, which would have likely failed to beat SPY in the last five years. There is no single method to create a strategy with excellent out-of-sample returns. For example, people have been using machine learning to try to game the stock market for just as long as people have been using Portfolio123, and it certainly has potential, as RenTech’s Medallion Fund showed. But that fund held stocks for a day or two and used massive leverage (if you were to deleverage their results and not include their fee-based income, their performance may not have been so impressive, though that’s just a wild guess on my part).

The designer models placed a lot of faith in automation. I know stock pickers who don’t automate their strategy at all who have done very well over the last five years. Does that mean that automation is worse than manual stock picking? Absolutely not. They are two different approaches out of many, and that many includes machine learning and long-short hedging and market timing. In the end, what works? Hard work, experience, constant learning, and sticking to your guns when things go bad. And what else works? Large-cap index funds. At least for now.

SPY is dominated by mega caps. (See the attached chart). Mega caps have been outperforming. That might not explain everything, but it does explain some of it.

Why are megacaps now dominating? Here is what I wrote in 2012:

[quote]
…in the long run (over the next 7 years) large (as a class) will almost certainly do better than small.
[/quote]Source
Here we are 7.5 years later and my prediction has come true.

I see the market going in cycles. Mega caps outperformed in the U.S. during the 1960’s, the 1990’s, and the 2010’s. The common denominator is that all three periods were preceded by a long bull market.

Stage 1.
Bear market: Stocks are dumped. Stocks; especially small caps, take huge price hits, sometimes for reasons that have nothing to do with earnings; such as margin calls.

Stage 2.
1.5-3 years. Fundamental investors get to choose between buying fair businesses at great prices or great businesses at fair prices. The long-term investor would prefer great businesses, but in the short term prices for fair companies rebound sharply. That causes small value to outperform.

Stage 3.
People looking at past history stick with small value because of past performance.
Fundamental investors get to choose between fair businesses at fair to good to great prices and great business at good prices.

Stage 4.
The small value juice has been squeezed.
Fundamental investors get to choose between fair businesses at fair prices and great businesses at great prices. This starts a rotation into large growth.

Stage 5.
Momentum is king.
People start jumping off the small value bandwagon. Why own small caps? Past performance shows better returns and lower volatility for mega caps!

Stage 6.
Bubble trouble. As investors become less valuation conscious and more momentum conscious, valuation gets ignored. Nifty-Fifty, Dot-Com, FANG, stocks look like great deals at any price! Until they aren’t.

Stage 7.
Small value stocks do best in the next bear market because they started from depressed prices, had few momentum investors on the bandwagon (who jump abandon ship when prices fall, creating selling pressure) and have little room to fall. If prices were low enough, people will jump back onto the small value bandwagon during the next bull market.

We don’t always get stage 7. But in 2000-2002 as large growth was collapsing, small value was up!

Where are we now? Probably either stage 5 or 6. We will find out.


I am no longer predicting mega cap outperformance. In the short-term (over the next year or two), mega caps may continue their outperformance, but it is not sustainable long-term. This means that small value is due to be back in style over the next seven years.

But the real opportunity going forward is not U.S. small value but international small value. That’s why I have been from the few (maybe the only) U.S. based user who really wants international data.

New prediction:
It is likely that international small value will outperform over the next seven years!

Yuval,

Does not seem you are recommending the Designer Models for now. If that is what you are saying I would tend to agree.

-Jim

Chaim,

Correct.

One can easily download the returns of the Designer Models using the benchmark the Designer’s chose. The problem is still there with regard to the 2-year excess returns for sure.

I would be surprised if many of the small-cap model Designers used the S&P 500 as their benchmark which is not to say that there are not some problems with the benchmarks the Designers chose.

Of course there can be problems with the type of model we chose (e.g., small-cap value) as well as with models themselves (e.g., possible overfitting).

-Jim

Very well thought out. I am going to print this and put it on my wall. I have the same opinion on this but I never processed it and put it on a paper in writing. This will do.

Here is a new model which selects 15 stocks from ETF QGRO.

This ETF is only about 1 year old. I am using a similar algorithm for this model as for the iM-Best12(USMV)-Trader which has significantly out-performed both SPY and USMV since inception, on 6/30/2014 over five years ago. The other model with similar algo is the iM-Best10(VDIGX)-Trader.

I think that one can do much better using professional ETF providers know-how and select one’s stocks from their ETFs holdings. We have discussed this long ago in the forum and now one can judge the merits of such a strategy which I have tested for longer than 5 years for two models now. Both have performed out of sample relatively well over the same period where the 75 Designer Models failed to deliver.

I have launched this as a DM and you can find it here. https://www.portfolio123.com/app/r2g/summary?id=1592982. There is no performance to see yet but the description is there.

Below is YTD performance, 75% so far. Thanks to three P123 ranking systems and about 3 buy- and 2-sell rules. No market timing. All large-cap stocks.


Interesting. That looks like a sim result. So it’s a 75% YTD simulated? Right?

Yes 75% for this year so far for 15 positions, and you can design such a model easily as well.

Why don’t you try it out. Download the holdings of QGRO, put them in a list, create a new universe with this list, and then update the list/universe every 3 months. Try out some ranking systems and you will soon find superior performance than that of QGRO. Then please post the YTD return here so we can all see it, perhaps you can come up with something better.

In 5 years we can compare the performance of this model versus the average of the DMs.
It should perform better because the universe is continuously adjusted to what the ETF provider believes to be the best quality growth stocks. I don’t have to do it with some convoluted selection rules which are fixed and don’t reflect the change of the stock market environment.

In the meantime you can follow it life. No need to subscribe. I will keep it there.