So here is the evidence that backtesting does not provide a good indication for OOS performance:
I have selected 25 DMs with large + mid caps >=70% all with inception date earlier than 5 years ago and put them into a book. (25 models is the max allowed in a book.)
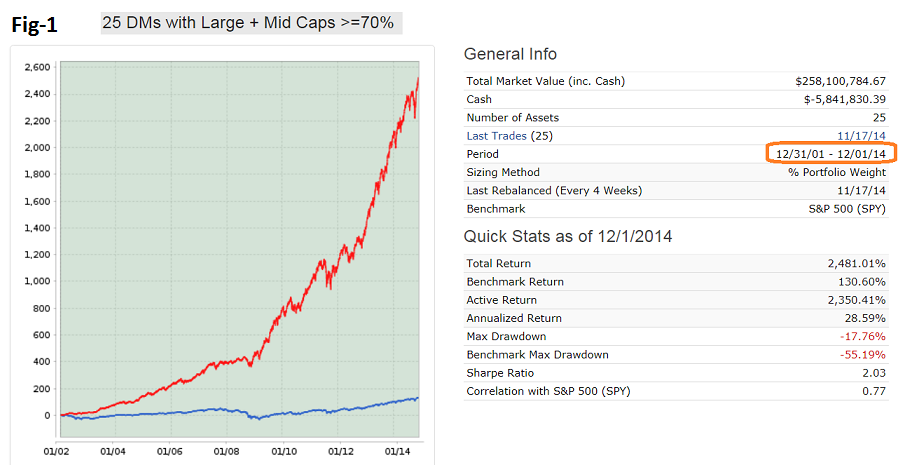
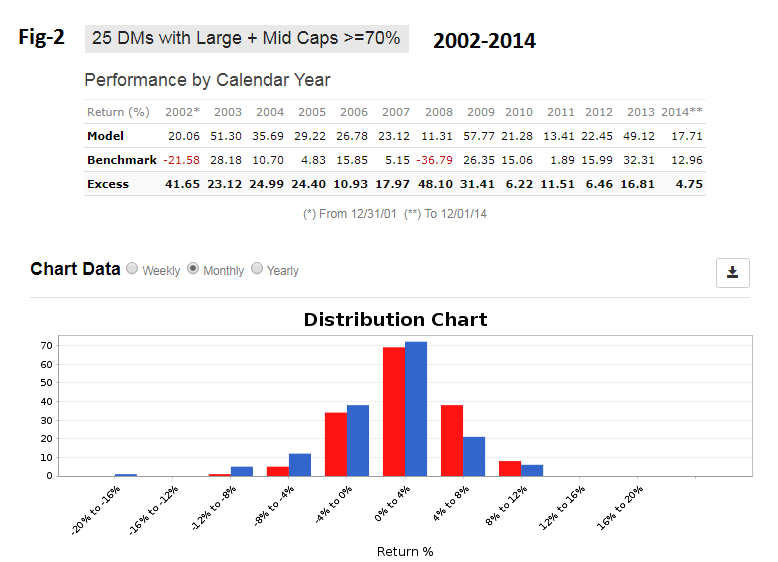
Look at the backtest from 2002 to 2014. That is the backtest period which designers considered. From Figure-1 one can see that designers did very well. Annualized return= 28.6% with a max D/D= -18%. The 2008 financial crises is not even visible on the performance curve. Calendar year performance is equally impressive - every year has positive returns all exceeding that of SPY, all as shown in Figure-2.
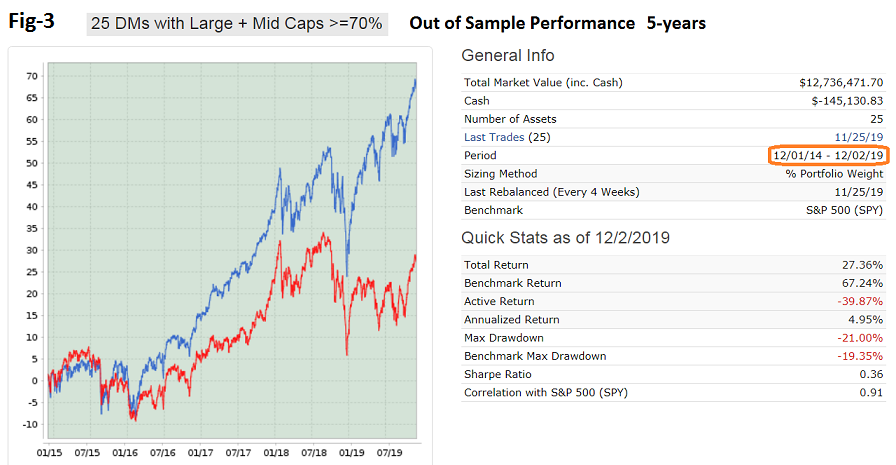
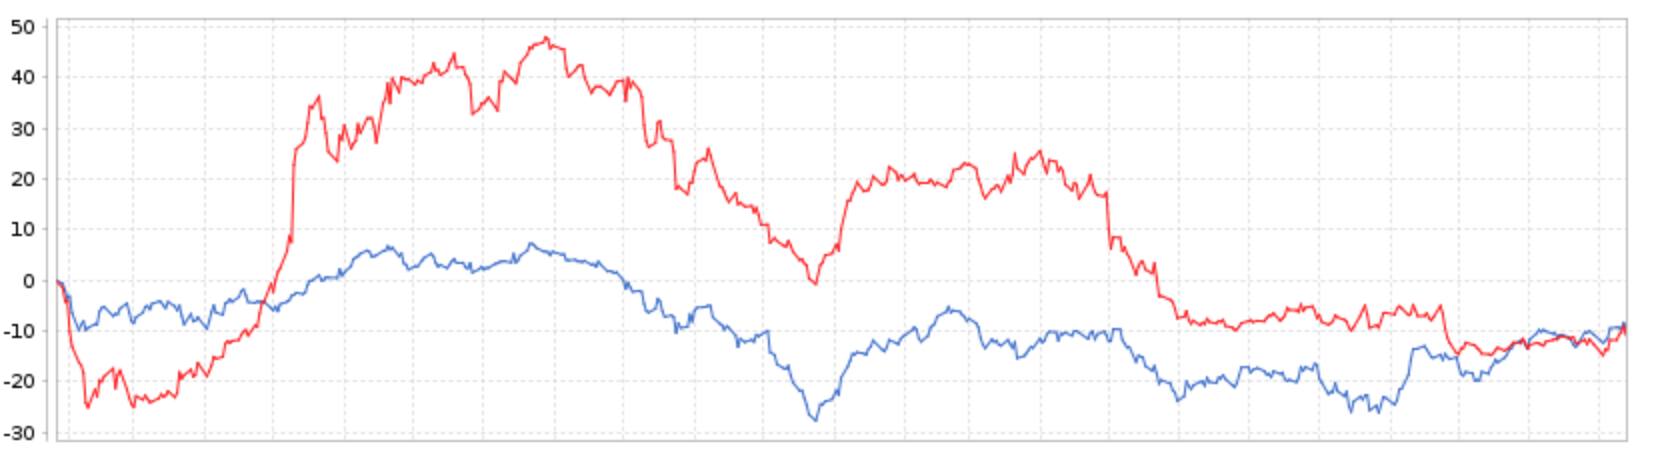
So why did this great simulated performance not continue over the 5-year out-of-sample period 12/1/2014 to 12/2/2019 (Figure-3)?
Almost immediately the combo starts under-performing SPY, over 2015 by -4.0%. How can that be when for each of the preceding 13 years it out-performed SPY?
Over the last 5 years the annualized return= 5.0% with a max D/D= -21%. Calendar year performance is equally unimpressive - every year the 25 DMs underperformed SPY, 2015 to 2019: -4.04%, -6.34%, -4.33%, -4.89%, -11.48%.
Performance relative to Value is not much better. Calendar year performance relative to IWD is equally unimpressive - 2015 to 2019: 1.17%, -11.60%, 3.93%, -1.01%, -7.20%.