S&P 500 stock selection using machine learning classifiers: A lookinto the changing role of factors

Summary of the conclusion: (https://www.sciencedirect.com/science/article/pii/S0275531924001296)

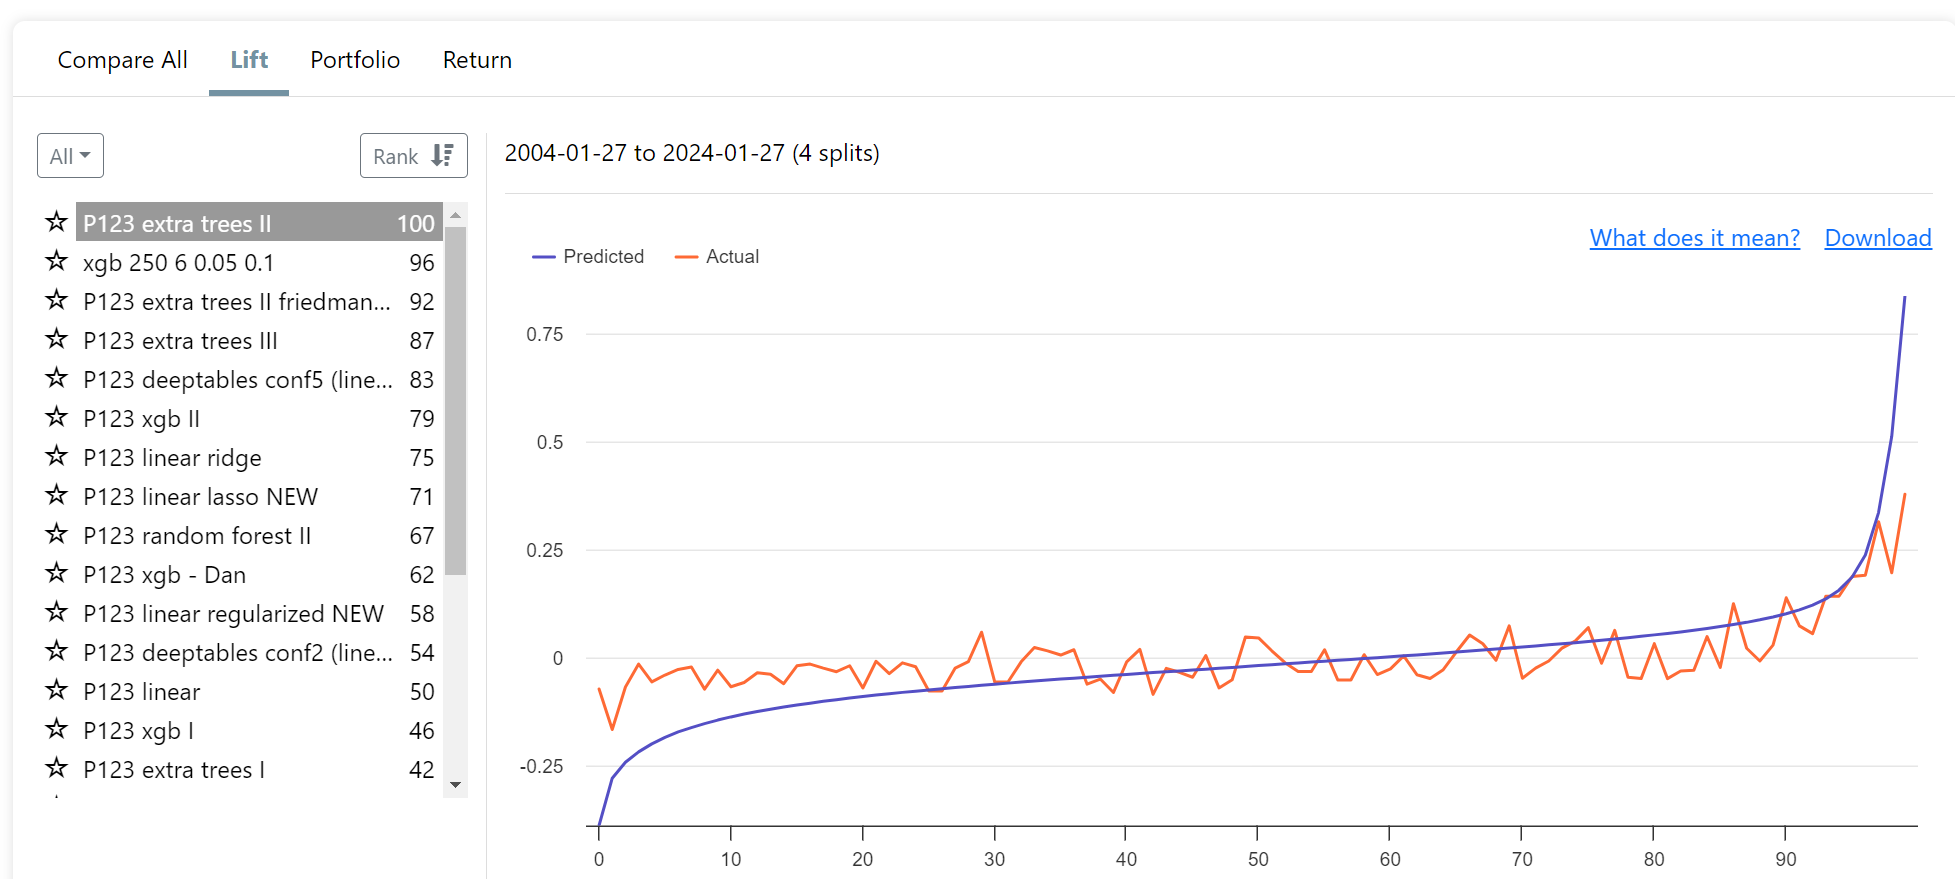
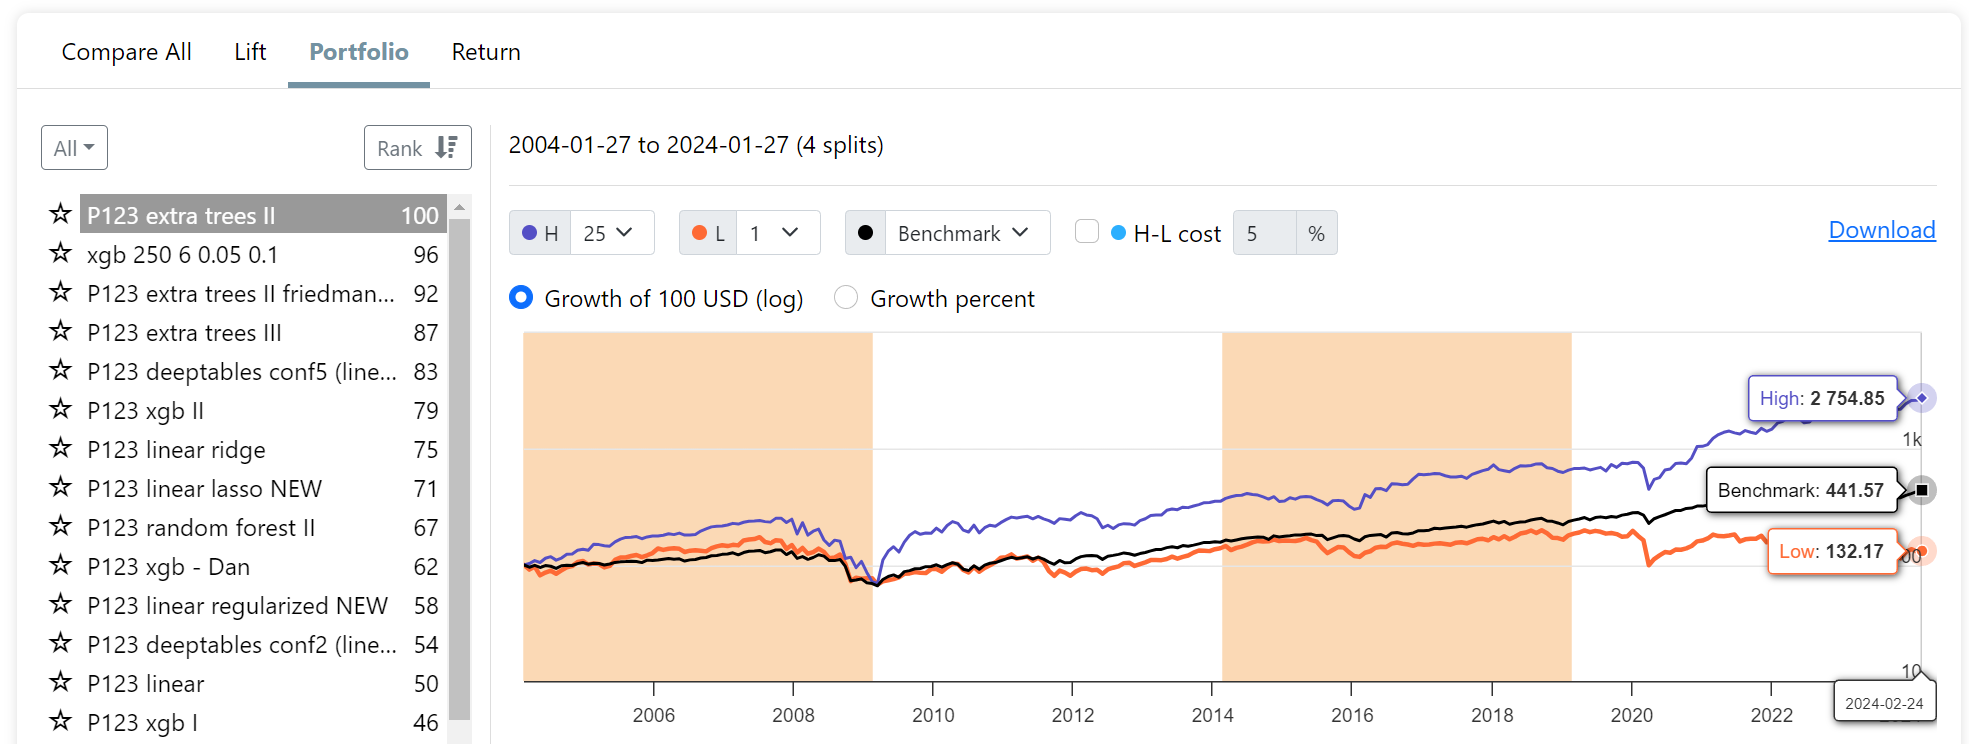
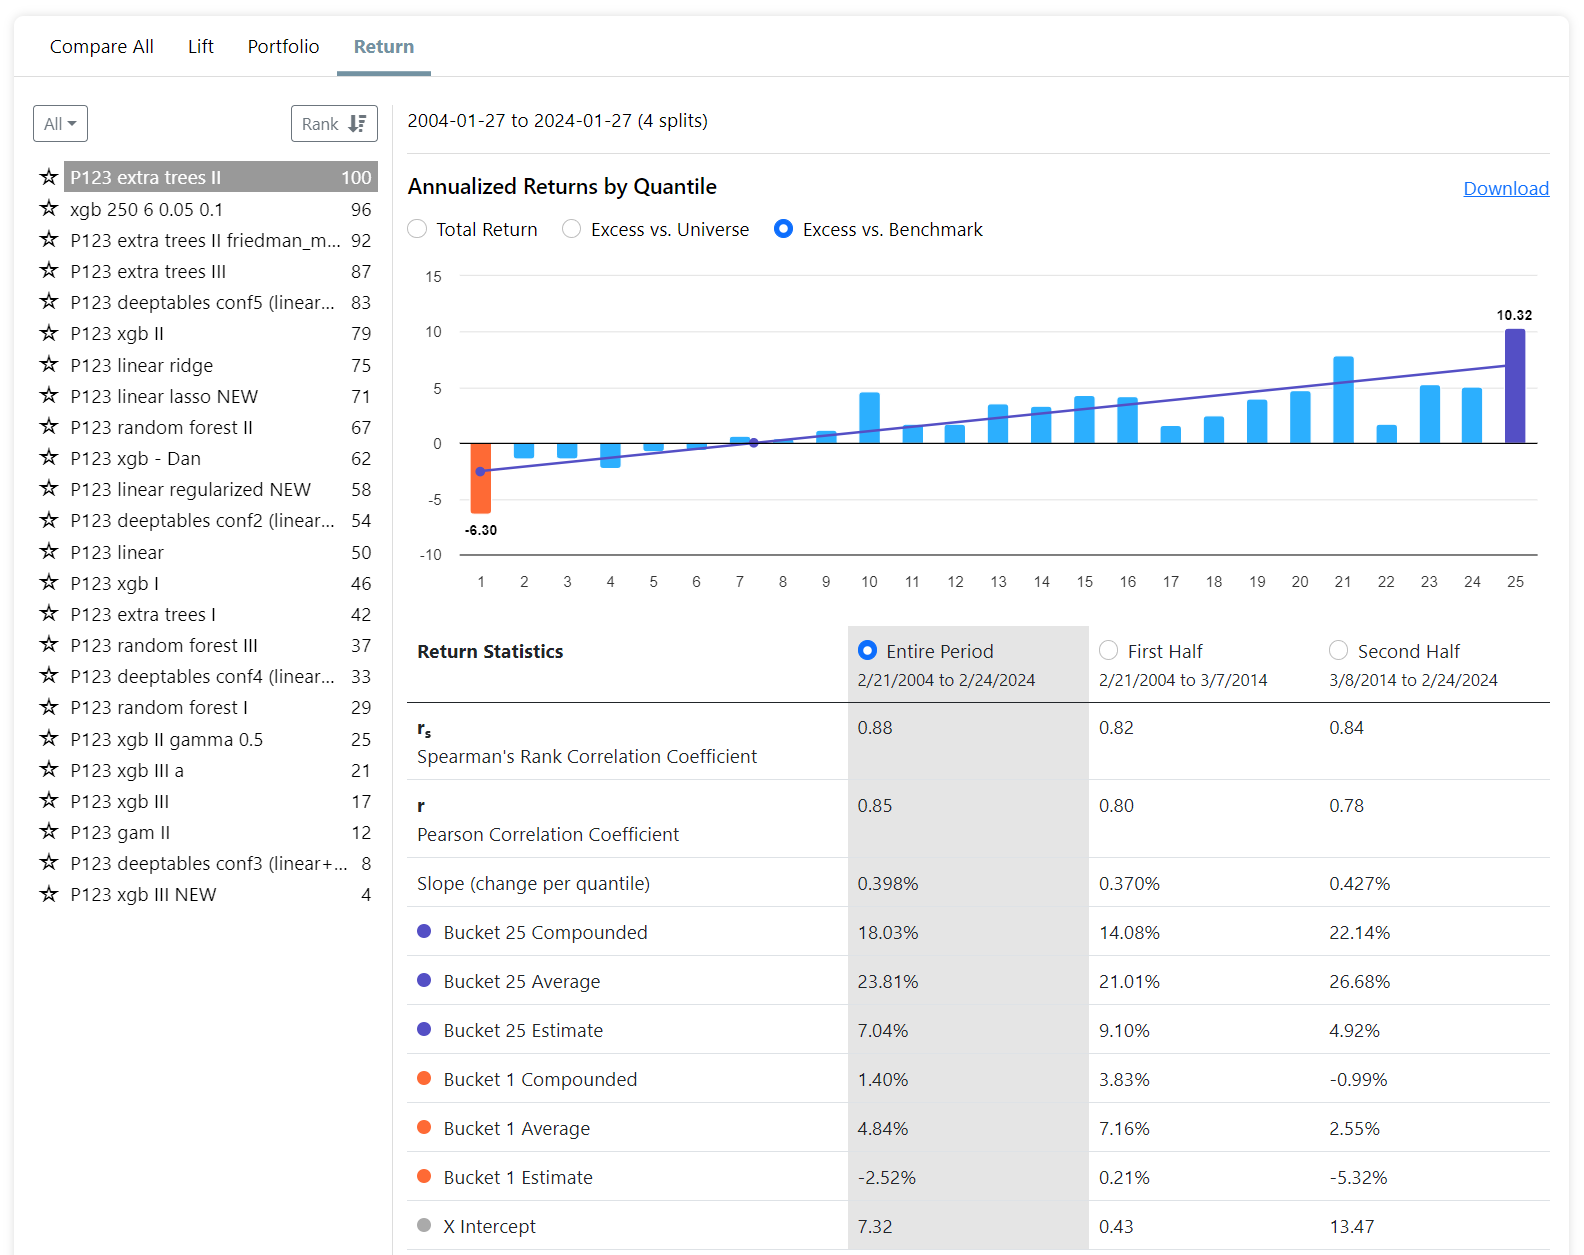
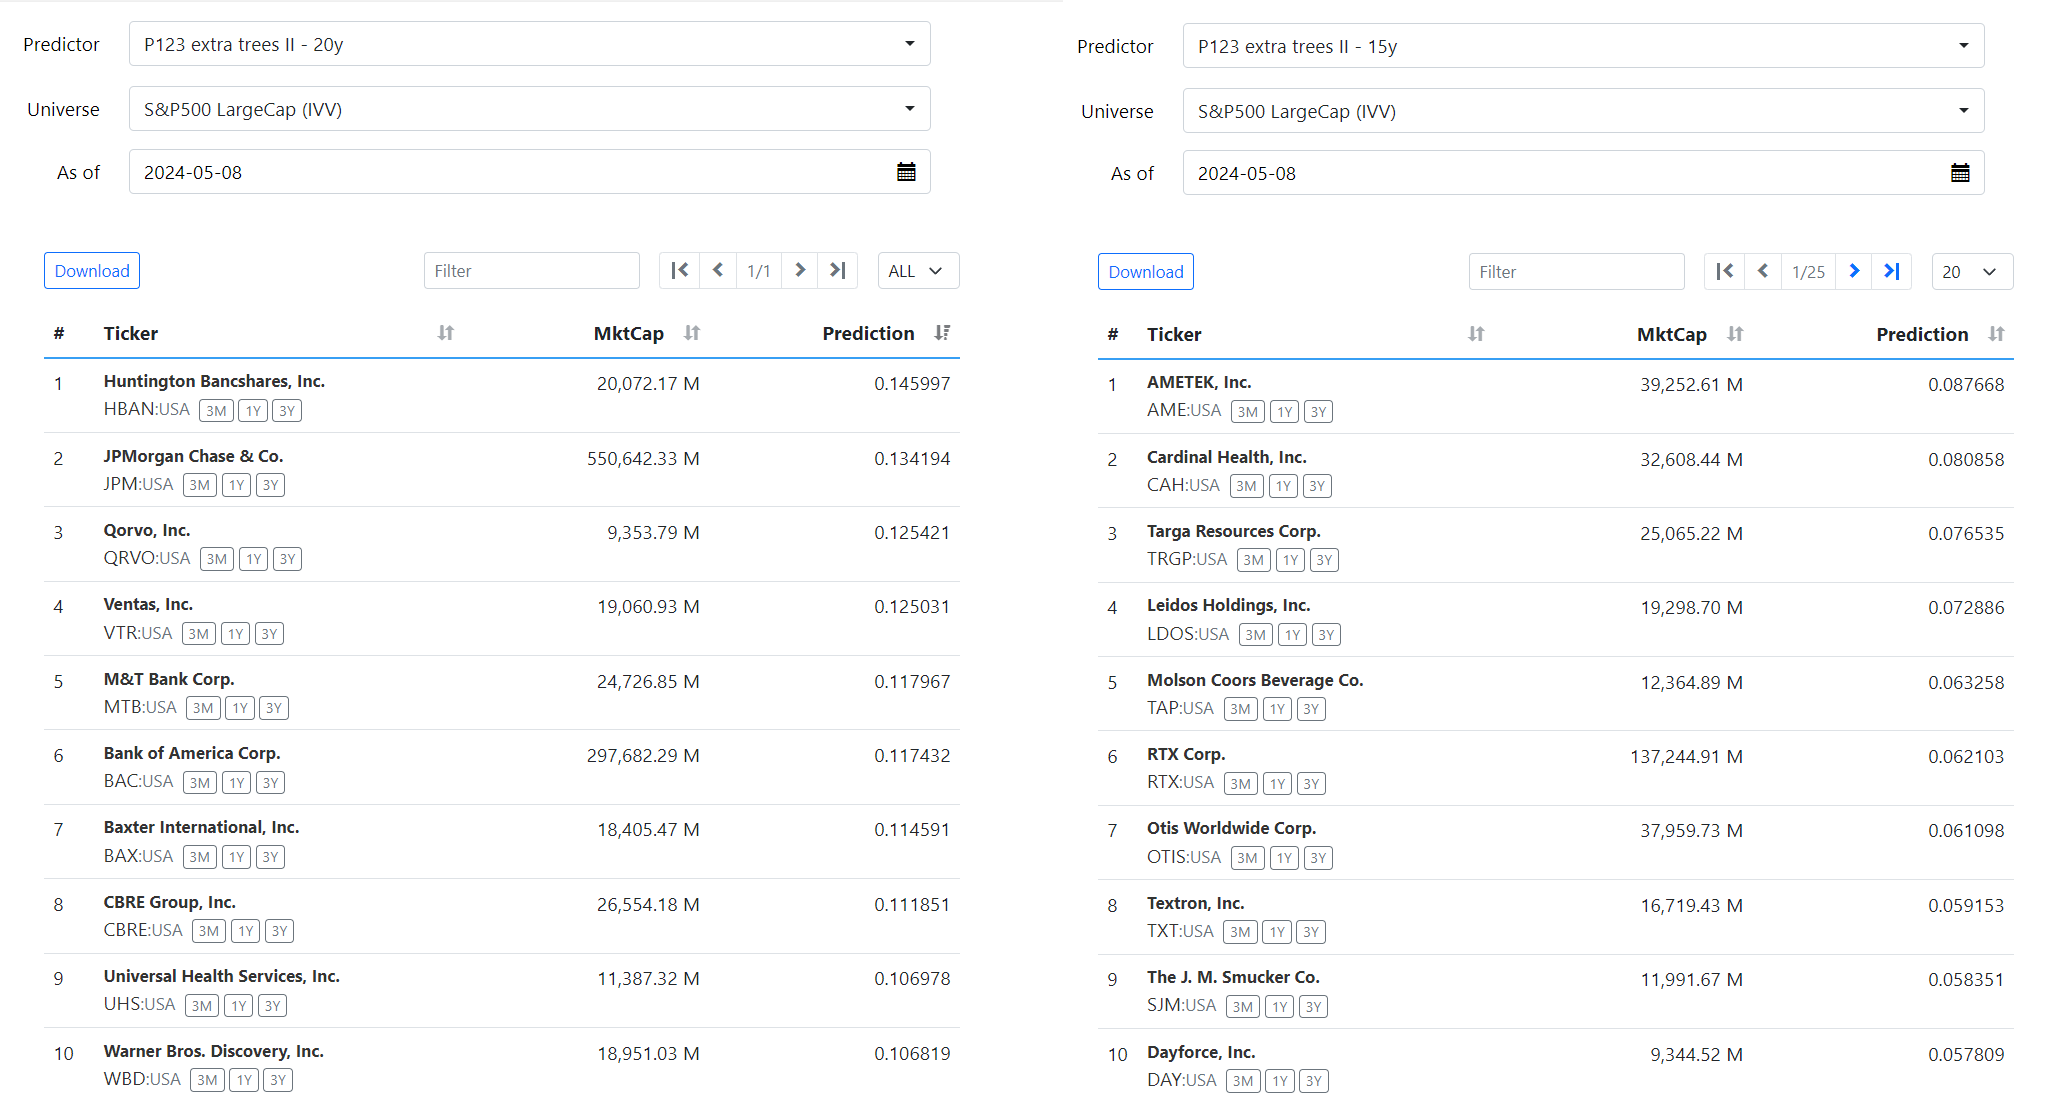
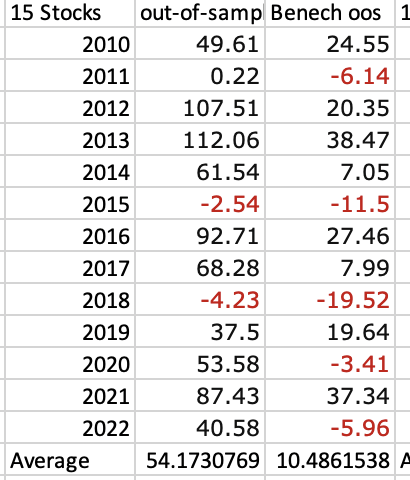
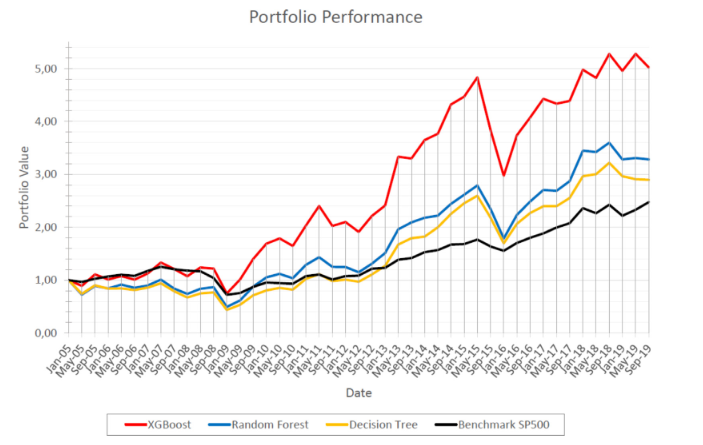
  • Outperforming the Market: Machine learning algorithms can outperform the market (like S&P 500) by using financial factors to select a subset of stocks. These algorithms adapt to changing market conditions by adjusting the importance of these factors.
  • Good Practices Followed: The study followed recommended practices for applying machine learning to stock returns: reliable data, recent data for predictions, avoiding biases, time-series split training, and hyperparameter tuning.
  • Limitations and Improvements:
    • Transaction costs were not considered. Frequent rebalancing could erase profits due to buying/selling fees.
    • Reliance on data providers: data bias or missing data can impact portfolio formation.
    • Ideally, hyperparameter optimization should happen with each rebalancing.
  • XGBoost Performs Best: Among the algorithms tested (XGBoost, Random Forest, Decision Trees), XGBoost showed the best performance in terms of classification and financial results.
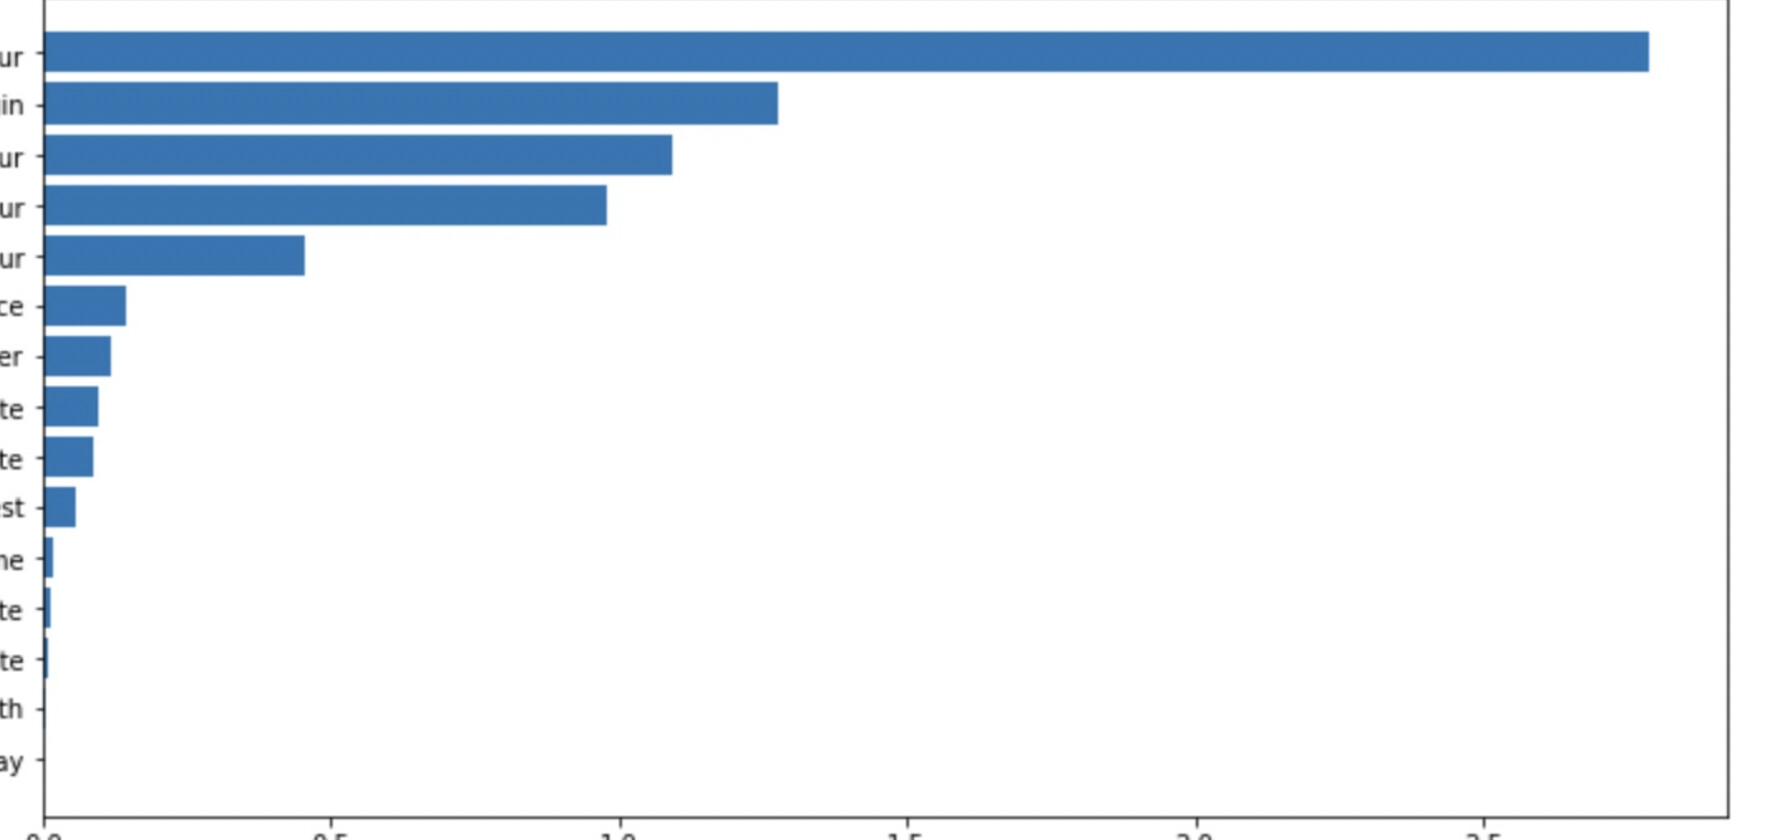
  • Adapting to Market Changes: Feature importance analysis revealed that the algorithms adjust to changing market conditions by giving different weights to different factors over time.
  • Future Work:
    • Analyze factor importance further using tools like SHAP values to understand not just importance but also the relationship between features and stock performance.
    • Integrate risk management for better portfolio stability.
    • Explore applying this approach in other markets and with optimized weight allocation within the portfolio.
    • Combine this model with a model that predicts market crashes for improved performance.
    • Leverage ensemble models that combine predictions from different models at different points in time.
5 Likes

Good discussions of this paper here: PREVIEW: Screenshots of upcoming AI Factors - #20 by marco, here: PREVIEW: Screenshots of upcoming AI Factors - #22 by bobmc and here: PREVIEW: Screenshots of upcoming AI Factors - #24 by yuvaltaylor

My first ever SP500 model that shows promise is with AI. I threw the kitchen sink at it: 300+ features.

Results shown using 25 buckets or ~20 stock per bucket.

Lift

Portfolio

Returns

1 Like

Marco,

Very nice! Can you help us understand how we will be able to compare systems going forward with the new AI/ML. Compare for ourselves for deciding which system to fund, mainly but also for comparing designer models etc..

Jim

It's a validation result using k-fold blocked with 52 week gaps. The 20 year performance is done concatenating 4x 5y holdout periods. I think it's a robust method.

1 Like

Nice!!!! I agree that is a great way to do it!!!!!

How does that hold as a Simulated strategy?

I don't know how this is handled with these AI rankings, but some nodes I use, I know will cause very high turnover. So even though knowing that giving some nodes extra weight in the ranking system will give a better slope, I know that they will cause such a high turnover in my simulated strategy that I need to keep the weight down.

I was seeing about 30% turnover with 4 week rebalance. Not bad for an SP500 model with 20 stocks.

2 Likes

I'm really looking forward to P123 starting to publish some of the systems that are made by ML. When will that be? Why not use it to create some more alternatives to the "core" systems?

Also, when is the final date set for when ML will be available to all on the platform?

The servers have been ordered. Probably a month or so to set them, and in the meantime we continue QA'ing the software.

@marco can you post here your top 10 current holdings from your ML system, then we can see type of stocks this system selects.

2 Likes

It would be interesting to see a graph of the feature importances. To see if the program actually used all of those 300+ features. You would not have to reveal the name of the features.

So like this with the name of the feature cut-off if you wish:

Jim

Depends who you ask. Once you settle on a model (in my example "P123 extra trees II") you then have to train it. My k-fold was using ~14y for training and ~5y for holdout, and my dataset is 20y. So what do you use for your "live" model?

Below are the predictions of the same model trained using 15y and 20y. Not a single one matches in the top 10. Also the range of values in the prediction differs a lot, although I don't think I care about that since I would just rank the predictions.

Isn't financial data great?

1 Like

You can do it like you would have done in real life. So if you are going to retrain your system yearly then train it up until the end of last year and run it for this year. That is the system you would have been running. And you could give the name of the holdings for today or for the entire year (with the assumption that the data is PIT or not changed retroactively).

Jim

Not sure I follow. The model instances (or trained model) used in the validation don't really exist, they are tossed after validation. So all I have after my research is which model (algorithm+hyperparams) did what. I don't have any model instance that I can use for predicting.

To start my portfolio I need to create a model instance. What do I use? Do I use entire dataset of 20y? Or do I use less data (most recent of course)? A case could be made for using the most recent 15 years, maybe even 10.

The point is that the predictions of models using different periods are going to differ.. A LOT!

I think it will all just work out in the end. Each model will generate very different portfolios which are all good. It will take some time to get used to this. With classic ranking you "know" what's happening. In ML you have to let go.

Edit: I presented just one idea for how to do sims with AI/ML. A method with disadvantages including it would be resource-intensive. I deleted it as I don't want to give the impression that there might not be better ways, or good ways that have the advantage of being less resource-intensive or that I am committed to any particular method for doing it.

It is a good question deserving of more consideration than can be presented in just one post, I think. I'm sure P123 is working on this.

Could you also publish some pictures from the Simulation with your best system from the ML SP500 model? It would be interesting to see how the performance would be in a more realistic, real life method

Well, the only realistic, real life method is out of sample.

A simulation is only one possible solution. The ML framework reinforces this fact: most algorithms produce different trained models using the same dataset. So anything you do with them, like a simulation, is just one possible outcome.

In addition a simulation could very well suffer from curve-fitting. The ML workflow goes a long way to help you avoid it, but it can still easily happen. That's the whole reasoning behind De Prado's "Deflated Sharpe Ratio" which reduces the simulated Sharpe the more you backtests you do.

Does that mean that P123 "classic" simulations are no longer necessary?

In a way yes. Their only use-case is probably to check things like turnover, what kind of stocks it's buying, and tweaking buy/sell rules of position sizing. Not for performance or sharpe ratios. And of course you most definitely cannot run a simulation that uses any of the training data. Which means that to get a 20 year simulation some tricks are necessary.

There's a lot of moving parts, and we're still adjusting. A little more patience...

PS We're going to incorporate randomness the ML results. For ex. you will be able to specify N number of instances of the same model, and the validation results will be the average.

2 Likes

I am not sure I understand why simulations are no longer needed.

My understanding of the process is the following:
Say we have 20 years worth of data and we create an ML model that is trained using 10 years and has a holdout/testing period of 2 years.
2004-2014 -> Training -> 2014->2016 -> Testing (out of sample)
2006-2016 -> Training -> 2016->2018 -> Testing (out of sample)
...

The testing period are concatenated and the predictions from all the holdout period are stored in a custom ML factor say: $$ML1

That custom $$ML1 can then be used in simulations/ranking systems and combined with other other regular factors and other custom machine learning factors.

The $$ML1 factor will hold only out of sample predictions and thus data from 2014 to present (in the above example) can be used in simulation.

Simulation in this case are very important including checking performance and sharpe ratios.

Is there something I am missing here?

2 Likes

Just for discussion, this is called a walk-forward validation with a rolling window.

It is a standard method that I would use (have used) but it is probably somewhat resource-intensive.
Specifically, I have used a walk forward-validation with an "expanding window" and a "rolling window" in the past with this explanation of an expanding window walk-forward validation:

2000-2009:Training->2010-2011:Testing (out-of-sample), save this testing data
2000-2010:Training->2011-2012: Testing (out-of-sample), concatenate
2000-2011:Training->2012-2013: Testing (out-of-sample), concatenate
…..
2000-2022: Training->2023-2024:Testing(out-of-sample), concatenate
2000-2023: Training->2024-now:Testing (out-of-dample), concatenate.

So, just for defintions and later discussions, I have outlined a walk-forward validation with an expanding window (always starting at 2000), while Azouz has outlined a walk-forward validation using a rolling (10-year) window.

As I said I have done this with an expanding window (results below) where I got the returns for the test period. I have averaged the returns here but you could concatenate the trades and create a sim which, I believe, is Azouz's point.

Screenshot 2024-05-12 at 4.54.00 AM

I think Azouz presents a valid, well-know, often used method for discussion. Here is a discussion from Advances in Financial Machine Learning

12.2 THE WALK-FORWARD METHOD The most common backtest method in the literature is the walk-forward (WF) approach. WF is a historical simulation of how the strategy would have performed in past. Each strategy decision is based on observations that predate that decision. …... (1) WF has a clear historical interpretation. Its performance can be reconciled with paper trading. (2) History is a filtration; hence, using trailing data guarantees that the testing set is out-of-sample (no leakage), as long as purging has been properly implemented

de Prado, Marcos López. Advances in Financial Machine Learning (pp. 281-282). Wiley. Kindle Edition.

Summary of advantages: 1) can be used to make a "historical simulation." 2) Testing is out-of-sample. 3) "Most common" and perhaps well-recognized and often-used by machine learners.

Disadvantage. May be computer-resource expensive to add this to whatever P123 is doing already.

But in future discussions, I hope we can remember the terms walk-forward validation with a rolling window and walk-forward validation with an expanding window with some understanding of what is being discussed.

My only recommendation is that P123 might benefit from using techniques that would be recognized by someone who has finished a degree in machine learning or just finished a Kaggle competion. This would simplify the debates and probably help with marketing.

Jim

1 Like