Do you have market timing as a part of your model? If yes, can ou give us a feel for what you are looking for when the timing hits. The reason I ask, the next downturn will not be for the same reasons as last.
Thanks,
Do you have market timing as a part of your model? If yes, can ou give us a feel for what you are looking for when the timing hits. The reason I ask, the next downturn will not be for the same reasons as last.
Thanks,
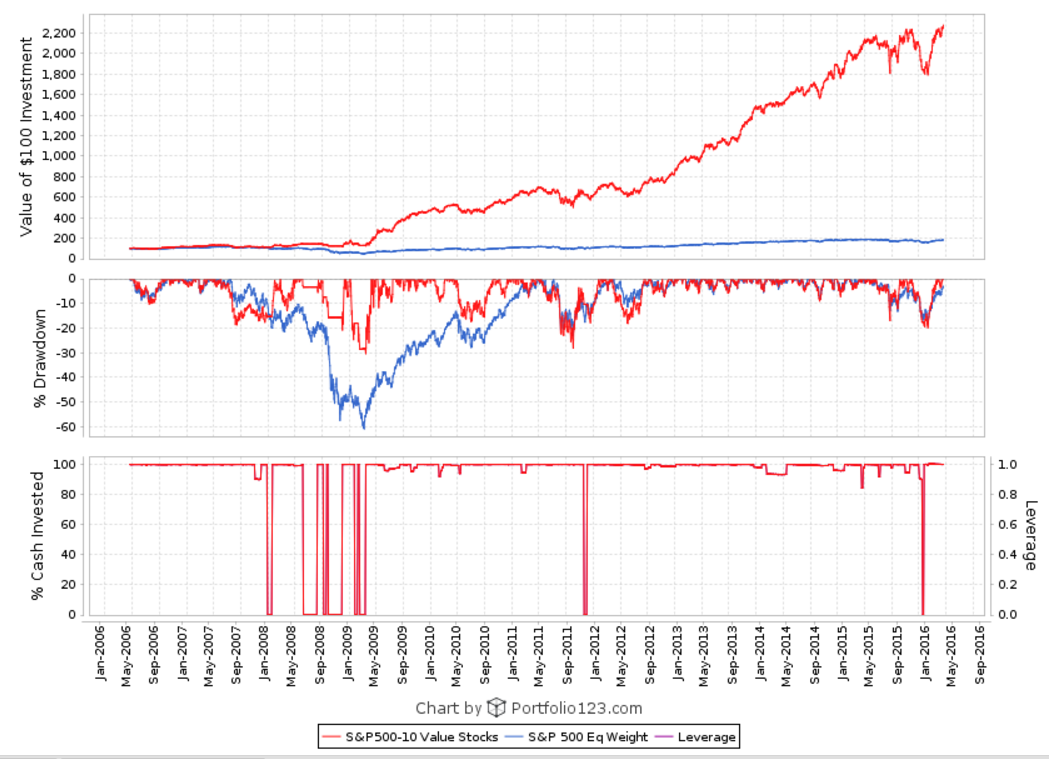
Although the description says Herdging is not used, it’s obvious that technical timing Buy-Sell rules are being used. There is no way the simulated 2001, 2002, and 2008 gains could be achieved without them.
Many who implement timing via the Buy-Sell rules rather than the Hedge platform use rules simiular to what casn be found in the Hedge area, moving average comparisns involving An SP500 consnsus estimate series are commopnplace, and perhpas moving aversage rules that canmake individual stocks inelibgi le for purchse during doewn periods. I assume it’s one or both of those – the model’s simulated bear market performance is consistent withw hat we see among others who use those rules, whehter in the hedge area or withing the buy-sell rules.
Kumar, am I rignt?
Mgerstein,
It is a modified version of IBD market call during bear market.
I am from an engineering background.
I have tried to achieve best of 2 worlds. (
Thanks
Kumar
I concur with Marc. However, I don’t see anything wrong in using buy and sell rules to control number of positions, as long as these are generic and not just the result of a moving-average curve-fitting exercise.
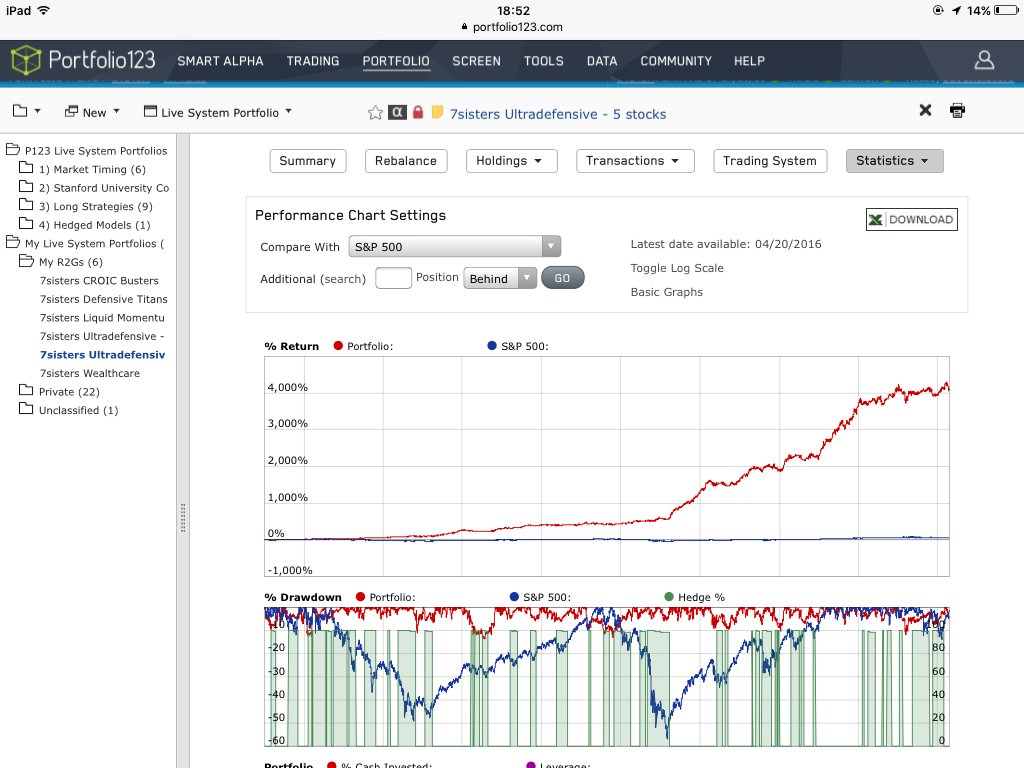
In my models I use hedge but unrelated to what the benchmark does. As a result, I get more frequent buy and sell signals. Some are timed well, others aren’t. But overall they help to avoid major downtrends (see attached example).
Cheers,
Florian
Unrelated to the benchmark … but instead related to? The current stocks in the portfolio?
Hi Fips,
It’s related to my custom universe. Approximately 2000 stocks. Thus a timer that is applicable to large, mid and small caps.
20 stocks value model
https://www.portfolio123.com/app/r2g/summary?id=1410005
10 stocks value model
https://www.portfolio123.com/app/r2g/summary?id=1409987
http://www.aaii.com/authors/wayne-thorp
gave presentation to AAII members.
He gave 1 value model presentation without market timing- 16% avg annual return for 20 stocks.
and 1 growth model IBD’s CANSLIM with IBD call market timing- 20% avg annual return for 10 stocks.
My 20 stocks value model has
30% avg annual return with 20 stocks by applying Value and IBD Market timing.
I would like to see out of sample for these model in next 2 years.
more than presentation and theory.
Considering the liquidity and number of stocks. If it is successful;
Believe, many designer will come up with good models;
P123 can compete with IBD50 and ZackRanks.
Optimists perspective: we are 90% invested in last 10 years. 10% of the time very uncertain market for go fishing.
Pessimists perspective: why we are not invested in 10% of the time in last 10 years.
whether we will miss-out opportunity even the time odds are not favour for investment?
Thanks
Kumar
For last 10 years.
8 times, the portfolio sold 100% on same day and went to cash.
During 2008 to 2009 6 times.
2011 1 time.
2016 1 time.
For smart alpha model subscriber; this information on market timing is good enough.
Note: World best investment company BRK.B lost 50% in 2008 to 2009 bear market.
still it is one of the best with 20% avg annual return out of sample over 50 years period.
It does mean
You should use the information only as a starting point for doing additional independent research in order to allow you to form your own opinion regarding investments.
It will apply to both stock recommendations and market timing used in this smart alpha model.
Thanks
Kumar
Kumar - what additional research can be done, when you chose not to share any meaningful information other than screen dumps of your sim? We know the results are good, what i am trying to figure out is if it is sustainable.
IMHO, People will have a hard time consuming a product if they do not know it’s underpinning.
Regards
Please note I am not a registered adviser. I am not offering personal advice regarding the suitability of a particular investment.
If you are unsure as to the suitability of a particular investment
for your own cirumstances please contact a registered financial adviser for advice.
I am requesting subscriber not to subscribe to my smart alpha model if they are not comfortable with the information provided in my model.
IMHO,
Quant model quality is measured by out of sample performance; not the factors used or market timing or hedge used.
wait for 2 to 5 years out of sample on this model; if the subscriber don’t have any knowledge on value investing or quant system.
Thanks
Kumar
Kumar,
This is not correct. The merits of a model are based only on the factors used. Out of sample performance can validate the appropriateness of the factors. But it’s the factors that determine whether good out of sample performance is based on something real or luck.
I understand your asking for feedback. That’s good. It’s a great way to learn. But Smart Alpha is not the best context for it. If you truly want feedback from which you can learn, you will need to disclose your trading system and that’s not typically done in Smart Alpha. Be aware that many of the experienced P123 users posted models publicly and discussed them long before R2G-Smart Alpha was formed. That, and not Smart Alpha, is the way to learn. Al,l you need do is set the visibility on your models to Public – as so many before you have done,
The only thing you have disclosed is your sim results, the sort of information we removed from the formal Smart Alpha platform because it is least useful. The only feedback I can provide based on it is that your 2001-2002 and 2008 results are not credible and raise cast serious doubt on the legitimacy of the work. I’d be happy to give more and better feedback, but I’d have to see the trading system.
You commented elsewhere that BRK lost 50% in 2008. Yes . . . and Warren Buffett has always explained his strategic approach, in great detail. That’s why people were willing to stick with him even during bad times.
Thanks Marc for articulating my concern. Kumar, if the folks do not understand the philosophy behind a given model, they will usually jettison it when the model goes south, as all models will from time to time.
Just see some models by Olikea or Chipper or Judgetrade
you will see a writeups that covers enough important points, including how the ranking system performs. I would be comfortable investing in a model like that. Nobody is asking you to reveal your “secret sauce” but at least you can tell us the ingredients.
BTW, Buffett articulates his philosophy in every annual report.
This model assumption is; if value and quality first in place, momentum will follow.
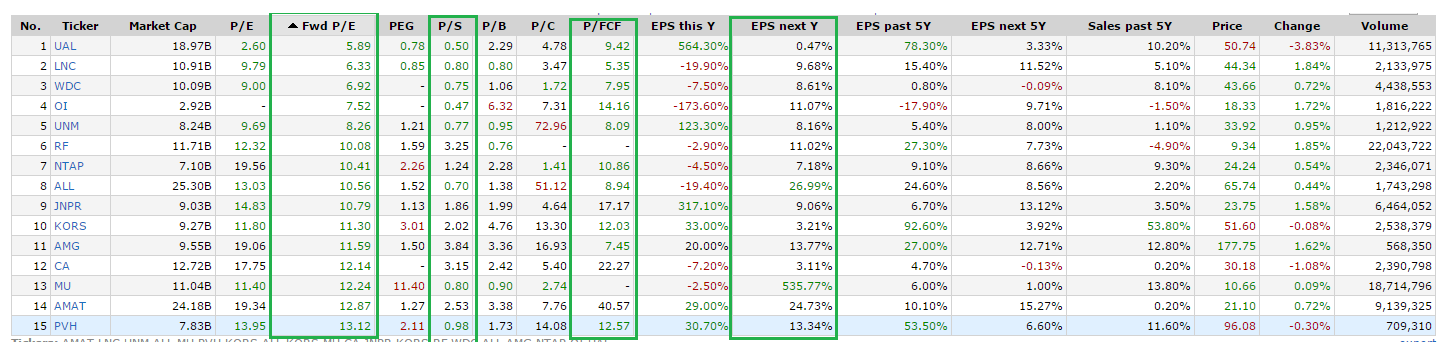
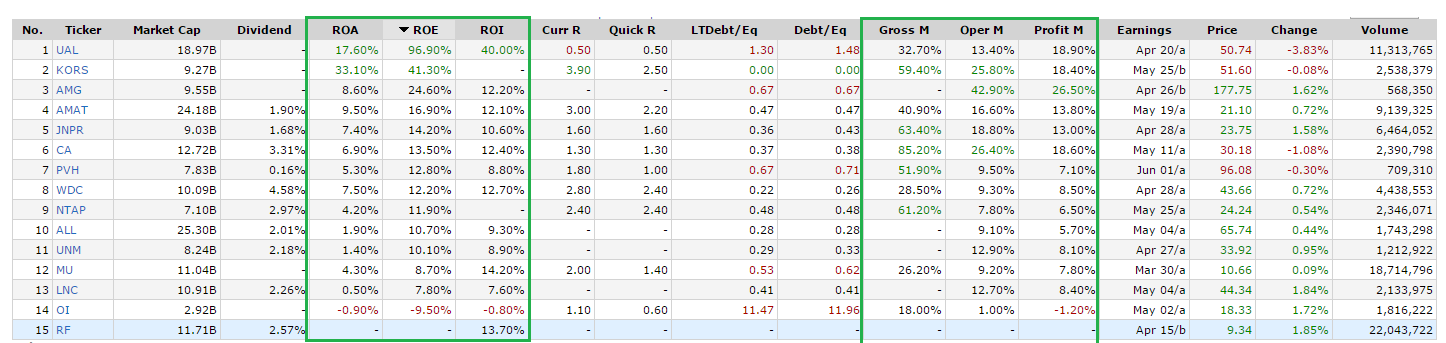
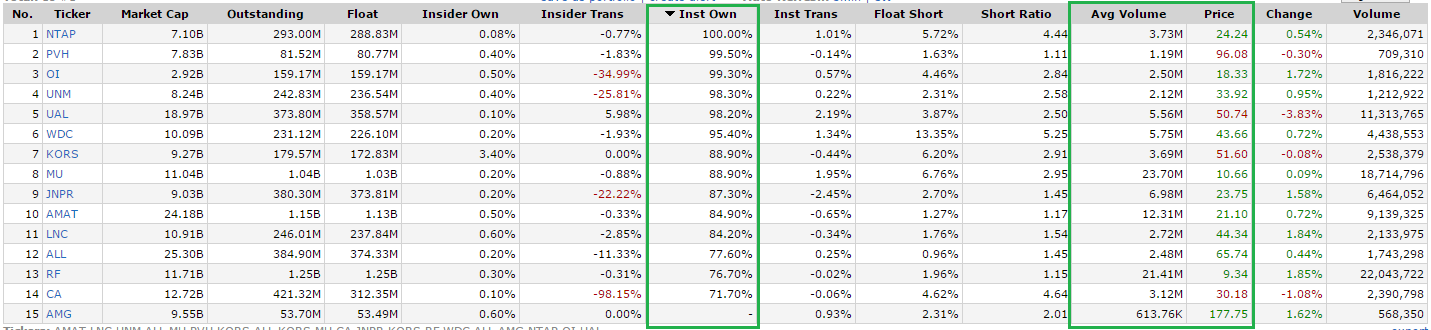
Please, use the last 10 trade transaction in the model, when it bought and when it sold to find out the value, quality, inst sponsorship and liquidity factors of the stock recommendation in finviz.com’s screen.
The 10 stocks and 20 stocks model uses the same ranking system with 11 factors;
8 factors for value and quality; 3 factors for inst sponsorship and liquidity.
10 stocks returns avg 37% per annum in simulation.
(most of the time this 10 stocks are subset of the 20 stocks model).
20 stocks returns avg 31% per annum in simulation.
Thanks
Kumar
Kumar, thanks again for your input.
So, if I understand correctly, for your ranking system you are using 8 factors corresponding to the finviz valuation and financial (as a proxy for quality) and 3 factors of finviz ownership and some liquidity?
On top of that, your model is generally rounded off by some variant of the IDB market timing ?
crastogi,
80% of my factors are exposed here, using closed trades last 30 days log.
the model has avg 90 days holdings and
500K avg volume liquidity and 5 Million ADT liquidity for last 3 months,
Thanks
Kumar
Kumar,
At the start of this thread, you say you welcome feedback. That is a proper request.
It would also be proper if you are posting in order to generate interest in your model – to attract subscribers.
Both goals are fine. But it’s hard, or maybe impossible, to do both at the same time.
If you want feedback, then stop giving clues as to what you are doing. You need to open your entire trading system by setting the model to public visibility so we can see the details and give you good-quality feedback.
If you want to generate interest in your model, which is what I assume you really want since you have not completely opened it up, then it is my opinion that you have not succeeded.
A model that describes itself as being Value and Quality should rank higher than 79 and 72 under the Value and Quality style scores. That leads me to suspect that there may be things in your model that you may think of as Value and Quality but which in fact, are not. I know, for example, that many on p123, particularly those who take purely quantitative approaches, think they are doing value when they use ratios like PS, EV/EBITDA etc. based on quarterly sales or EBITDA numbers. They do it because it has “worked” in simulations designed to maximize backward returns. But neither is an acceptable example of Value or Quality because the latter needs to be based on figures that have high probabilities of being persistent – it’s hard enough top get that when using 12-month figures – using figures from just one quarter, which don’t even encompass a full annual cycle different quarters have different characteristics) is low-persistence in the extreme and is the extreme opposite of value or quality. That sort of thing is momentum. Yet your models’ momentum score is very low, the lowest of the three. Now, I have no idea what you’re doing in terms of genuine fundamental modeling.
Yet your performance is pretty good – too good. You said at one point in this thread that:
And, you checked “NO” for use of hedging.
My reaction: No way! There is no way a long model (which is the only kind permitted in Smart Alpha) could gain 38.39% in 2008 nor could such a model have gained 58.38% in 2001 and 48.87% in 2002. That’s why I asked the question I did about your use of hedge-like factors in the context of Buy rules. And now, you say you did use some sort of IBD type system. While IBD does have fundamental aspects of its work, it is also very well known for technical, and use of backward-looking technicals (since even technical folks got killed in 2008) is the only way you could have achieved the simulated 2008 performance. In other words, I even wonder if what you did was really all that consistent with what IBD does. It looks to me like plain old data mining including use of SPEPS series factors.
So putting all this together, I do not see a Value Quality model enhanced by use of IBD technical principles. All the clues I see point to heavy data mining.
I may be wrong. But it is important that you and other Smart Alpha strategists be aware of what the numbers say – which, in many cases, does not match verbal descriptions. If you want to persuade me that I am wrong, you would need to completely open up your trading system.
Well said, Marc!
It is easy to fool oneself with the myriad of options we have at our disposal here in P123.
And curve fitting is silently creeping in unwittingly.
Werner
Kumar,
how come that after just 2 1/2 month you decided to send this model to the graveyard? Doubts over curve-fitting?
If so, that would be a good thing and would indicate a thought process that looks favorably on learning and fixing – and suggests one who can eventually become a successful Smart Alpha designer.
Kumar, I hope you re-post the model with a public visibility setting and pursue further questions. If you’d rather do this sort of thing it off line, let me know.
https://www.portfolio123.com/port_summary.jsp?portid=1425378
I believe in market timing as IBD does.
I said it is similar to IBD market timing not the same.
Thanks
Kumar