the stocks have been sold and re-balanced every week based on the rules.
all of the 10 stocks holding sold on same day twice in last 5 years (2011 and jan 2016).
based on the back test and simulation at the average
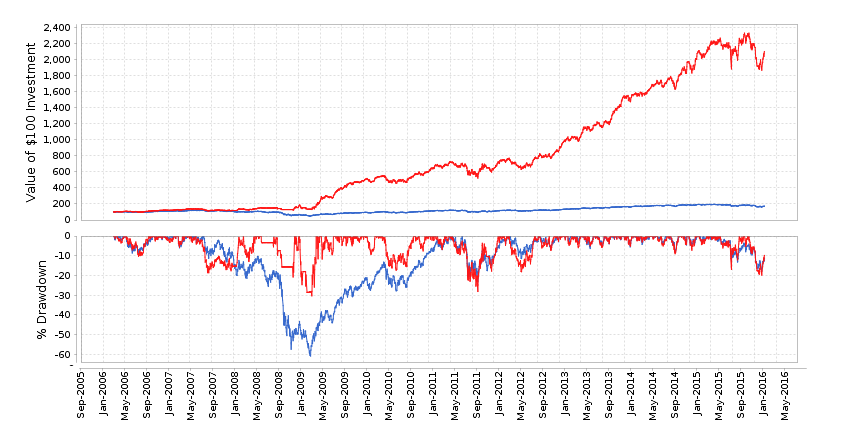
in bull market, performance is 2X of benchmark's performance.
==================================================
this model's secret sauce is in bear market, the model return positive.
my assumption is, many value investor(wait and watch) in sidelines during top of the strong bull market; and will
enter the market with big money during market panic and bear market.
the model uses just 1 rank to get benefit from both bull and bear market.
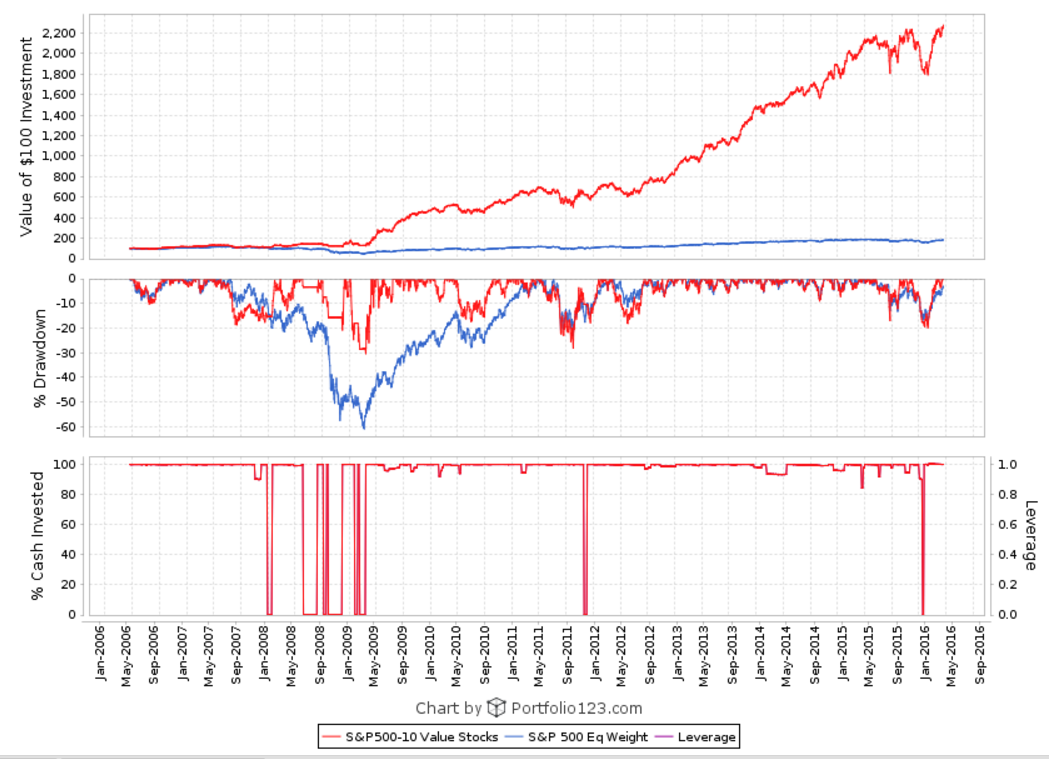
In bull market invested 100% of the time (relatively less draw down)
In bear market invested 90 to 95% of the time (more draw down).
@Kumar. Some of your models do not seem to have the SP 500 universe as advertised. Could you be making an honest mistake on this in some of your models? I know you have been around long enough not to confuse benchmark with universe but on some of your models the liquidity does not seem right. Just a thought
Regards,
Jim
"Catch-22 says they have a right to do anything we can't stop them from doing."
--The old woman in Catch-22
Looking at the equity curve since 1999 shows market timing in effect. The model goes to 0% cash invested several times in 2008/2009. If the model was 100% invested, the +200% returns would be stunning given the chosen universe.
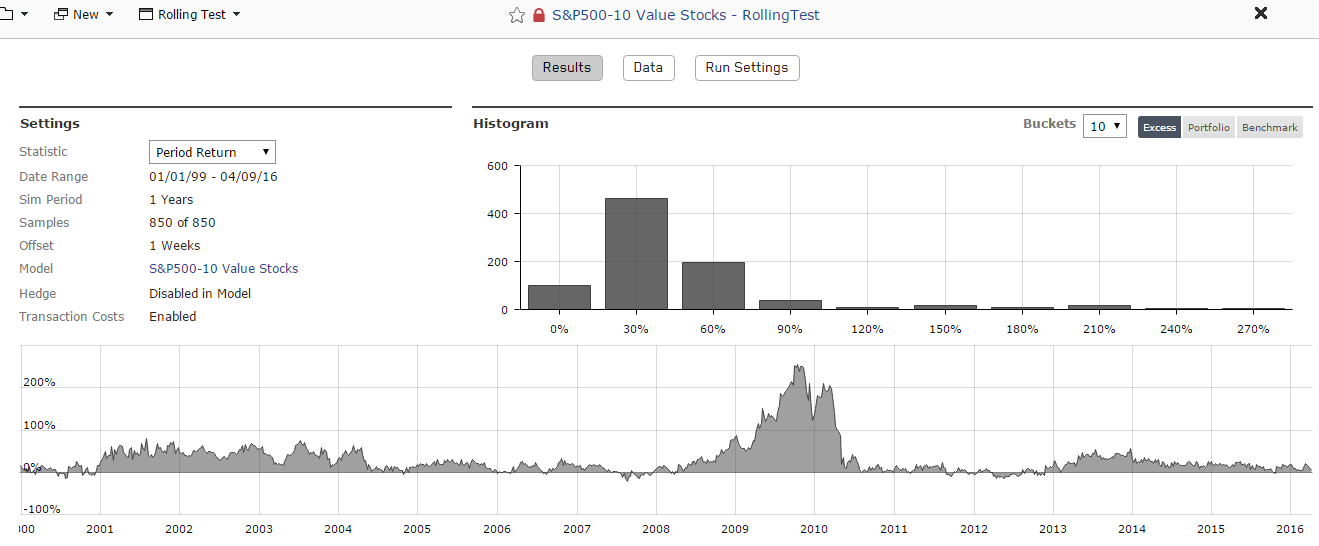
My takes from roll back test.
Ignore the extreme or not reasonable return after 3rd bucket.
-30% to 0%for 100 times
0 to 30% for 450 times
30% to 60% 200 times
Other extreme more than 60% bucket 100 times can be ignored.
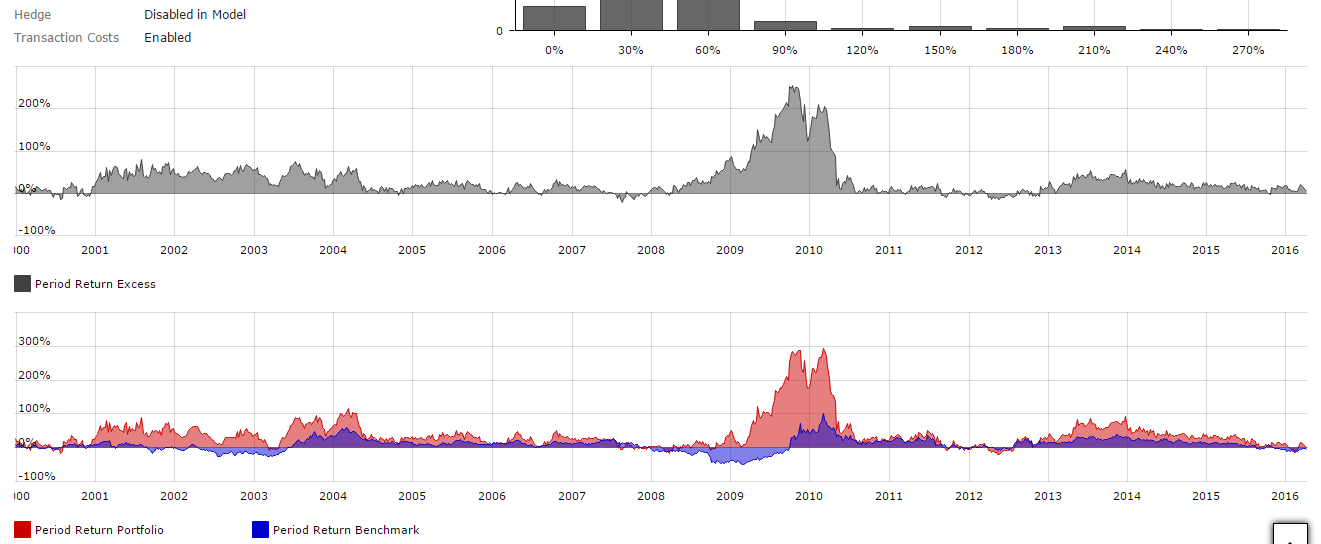
Expected from this model
Solid return -30pct-0pct in 1 to 2 years. 20% of the time
Reasonable return 20pct to 30 pct in 5 to 10 years. 70% of the time
Extreme return more than 30% on strong market trend. 10 % of the time.
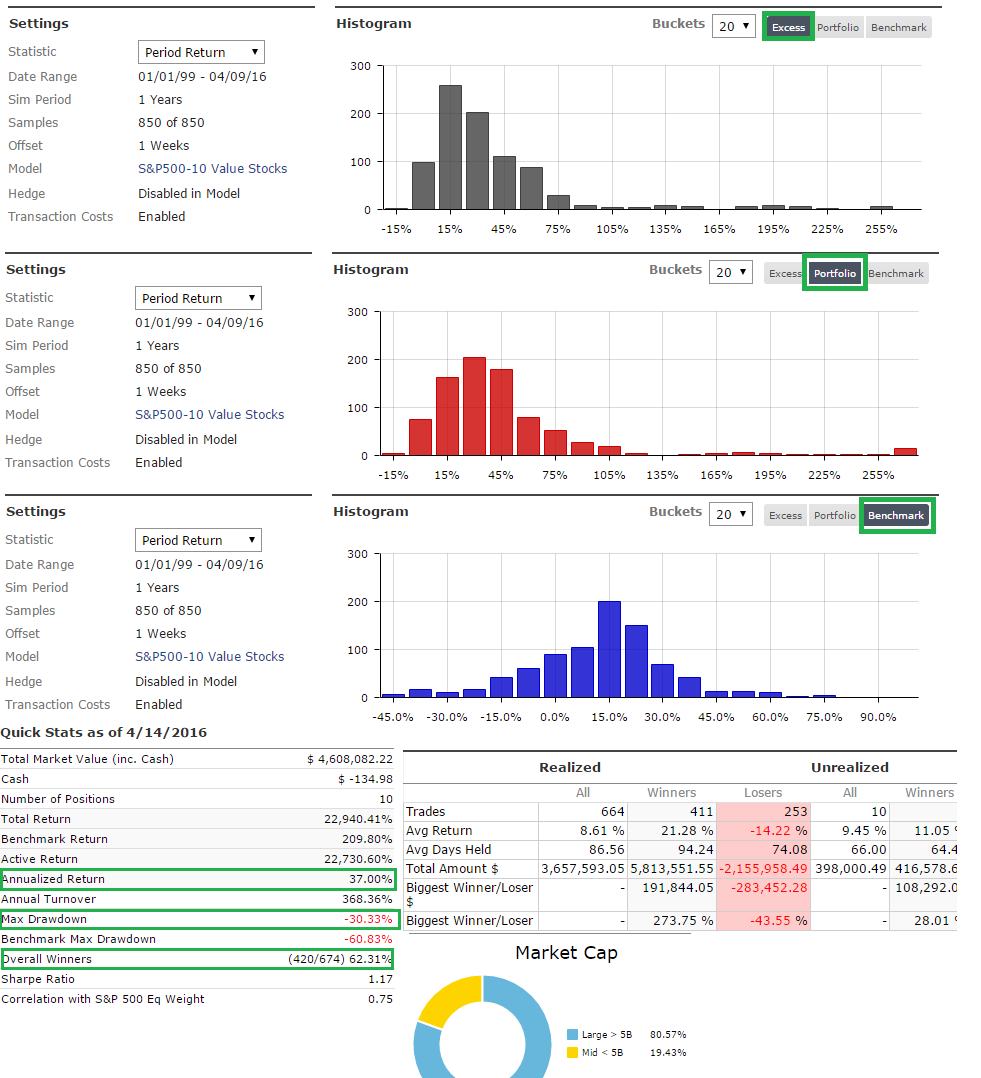
This model based on my beliefs on value, quality and liquidity.
It worked better than BRK.B in simulation. I expect it will continue to work.
Let us see the out of performance 2 years from now.
Expect the solid and reasonable return in long term,
It is a bonus if we get extreme return for few years.
Do you have market timing as a part of your model? If yes, can ou give us a feel for what you are looking for when the timing hits. The reason I ask, the next downturn will not be for the same reasons as last.
Although the description says Herdging is not used, it’s obvious that technical timing Buy-Sell rules are being used. There is no way the simulated 2001, 2002, and 2008 gains could be achieved without them.
Many who implement timing via the Buy-Sell rules rather than the Hedge platform use rules simiular to what casn be found in the Hedge area, moving average comparisns involving An SP500 consnsus estimate series are commopnplace, and perhpas moving aversage rules that canmake individual stocks inelibgi le for purchse during doewn periods. I assume it’s one or both of those – the model’s simulated bear market performance is consistent withw hat we see among others who use those rules, whehter in the hedge area or withing the buy-sell rules.
I concur with Marc. However, I don’t see anything wrong in using buy and sell rules to control number of positions, as long as these are generic and not just the result of a moving-average curve-fitting exercise.
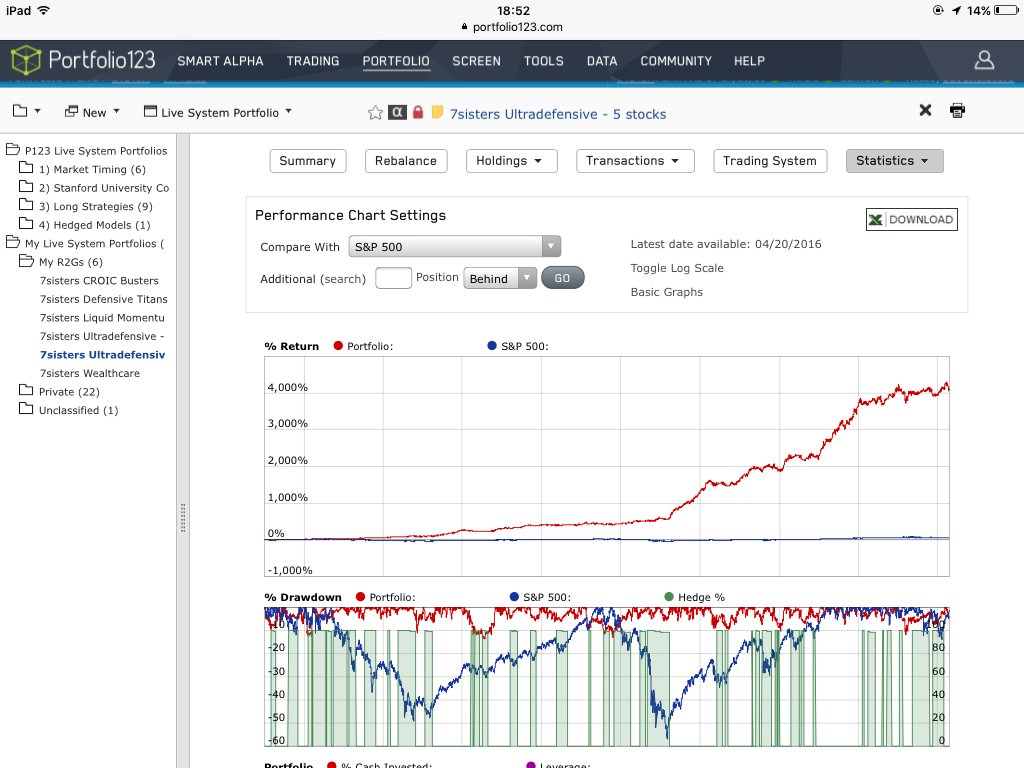
In my models I use hedge but unrelated to what the benchmark does. As a result, I get more frequent buy and sell signals. Some are timed well, others aren’t. But overall they help to avoid major downtrends (see attached example).
He gave 1 value model presentation without market timing- 16% avg annual return for 20 stocks.
and 1 growth model IBD's CANSLIM with IBD call market timing- 20% avg annual return for 10 stocks.
My 20 stocks value model has
30% avg annual return with 20 stocks by applying Value and IBD Market timing.
I would like to see out of sample for these model in next 2 years.
more than presentation and theory.
Considering the liquidity and number of stocks. If it is successful;
Believe, many designer will come up with good models;
P123 can compete with IBD50 and ZackRanks.
Optimists perspective: we are 90% invested in last 10 years. 10% of the time very uncertain market for go fishing.
Pessimists perspective: why we are not invested in 10% of the time in last 10 years.
whether we will miss-out opportunity even the time odds are not favour for investment?
============
Optimists Make more money Than Pessimists!
8 times, the portfolio sold 100% on same day and went to cash.
During 2008 to 2009 6 times.
2011 1 time.
2016 1 time.
For smart alpha model subscriber; this information on market timing is good enough.
Note: World best investment company BRK.B lost 50% in 2008 to 2009 bear market.
still it is one of the best with 20% avg annual return out of sample over 50 years period.
It does mean
You should use the information only as a starting point for doing additional independent research in order to allow you to form your own opinion regarding investments.
It will apply to both stock recommendations and market timing used in this smart alpha model.
Kumar - what additional research can be done, when you chose not to share any meaningful information other than screen dumps of your sim? We know the results are good, what i am trying to figure out is if it is sustainable.
IMHO, People will have a hard time consuming a product if they do not know it’s underpinning.