Sebastian -
This is an absolutely wonderful post. I agree with everything you write, and it really provides a great perspective. It is exactly this kind of response that I was hoping for when I started this thread. Thank you!
- Yuval
Sebastian -
This is an absolutely wonderful post. I agree with everything you write, and it really provides a great perspective. It is exactly this kind of response that I was hoping for when I started this thread. Thank you!
Sebastian, thanks for sharing
As an exercise I’ve implemented Yuval’s system as described (filling in the details where necessary) and it results in enviable excess returns over 10 years in simulations even with minimal tuning of weights and Universe rules (50 stocks in portfolio, 3000+ stocks universe, buy/sell only based on ranks and minimal liquidity). Mind that this is happening 4 years after it has been shared (possibly 5-6 years since inception) and that my implementation is certain to not fully capture Yuval’s. I think this is a great statement as to its rigor and validity.
Huge thanks to Yuval for his work and for sharing it with the investing public.
Thanks Yuval, that’s terrific. I haven’t invested as much effort in ranking systems, perhaps it’s time I start.
Hi all,
since trend is the investor’s best friend, this buy rule filter also helps:
RSI(48)>55
Thanks for sharing some secret sauce! As I’m trying to get more familiar witht the 123 syntax, can someone show me how to calculate the deviation of sales?
Thanks for a great post!
It’s the first time I’ve seen someone weighting sectors like that. A very interesting idea. How exactly do you do this? Do you do it as a buy rule, or do you give the sector a weight in the ranking system? Have you tested one and one node against each sector, or do you test the entire factor theme against one sector (quality, value, growth, etc.)?
One way is to test your ranking system on various sectors or subsectors by changing universe rules. If it works really well (high values on the right, low values on the left), give the sector or subsector a high rank; if it doesn’t work well (middling values throughout), give it a low rank.
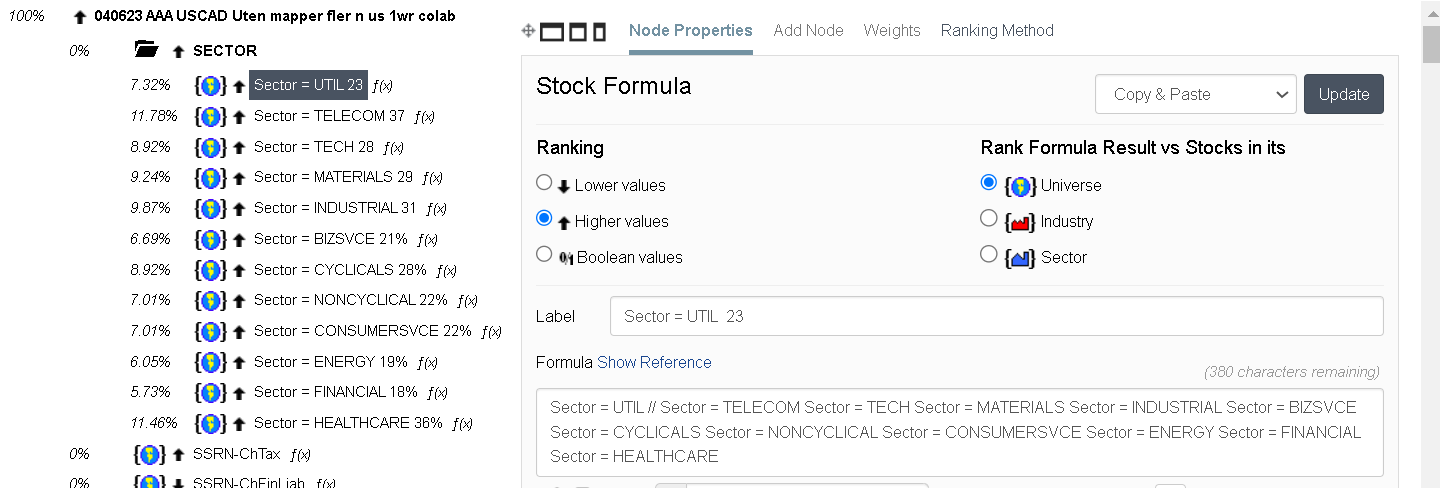
So something as simple as this?:
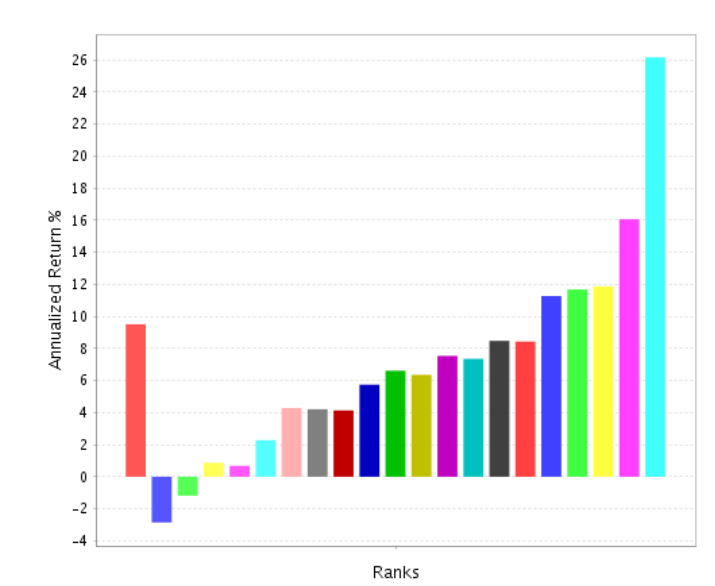
Before:
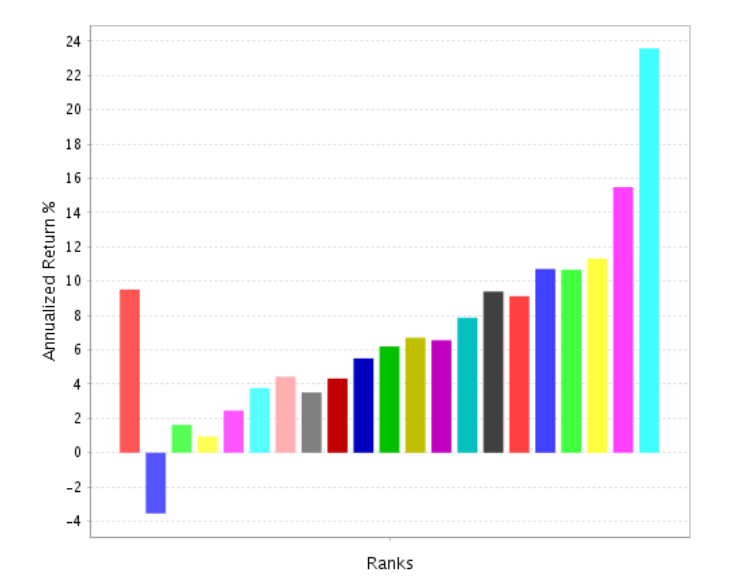
After, with a 10% weight in the overall ranking system and each sector weighted after its historical performance:
The overall performance goes down…
If it’s not your IP,may I ask, how is your weight in sectors and subsectors?
Or, if not to weigh each sector according to their historical performance with my rankingsystem, any other ideas I can try? Or just add or subtract 2-3% from each sector until it improves the performance in the overall simulation?
Just a general extension of this. It NEVER works for me to weight by the historical returns no matter what I am doing. And this would be just another example that proves this rule to me.
AND this is in-sample. I think it gets much worse out-of-sample. Done out-of-sample it would be a clear example of fitting to noise and overfitting as there is guaranteed to be some noise in the returns. Pure and simple. Overfitting to some extent is guaranteed with raw returns and there are know solutions.
There is information in the returns that can be use. It is just not necessarily a good idea to overfit that information.
An example of a solution is Ridge Regression that uses the information but shrinks it (Lasso regression might discard some of the data). My experience and it is growing every time I look at this is shrinkage does work and information like this can be used while the raw data does worse than nothing.
There are a lot of good shrinkage methods with ridge regression being just one of them. Empirical Bayes is another.
Empirical Bayes sounds complex. But here is a P123 resource that addresses some (but not all) of the reason it is used (e.g., regression-toward-the-mean) with the first link being to a paper that uses Empirical Bayes https://blog.portfolio123.com/thoughts-on-is-there-a-replication-crisis-in-finance/
And here is a link to the original paper if you just want to go there: Is There a Replication Crisis in Finance?
Here is a quick a dirty way to shrink things that seems to work with not a lot of justification and certainly nothing like a mathematical proof. But shrinking things to the lower confidence bound (i.e., the the lower side of your usual 95%confidence intervals) gets you pretty close. And JASP and other programs can calculate that number easily enough (menu driven and free). And if you squint, think about variance etc you can see how it sort of looks like a Bayesian approach as the confidence interval will widen (with more shrinkage) when there is less certainty (more variance or less data).
So, IMHO, Yuval has 2 good points. First, I suspect the sector return information can be used!!! And I give him credit for the “The Factor Zoo….” post which actually has a lot of good points. I think almost all of those points are related, but if anyone wants to say things like regression-toward-the-mean is something different, I would not mind how one decides to outline the general topic of raw returns out-of-sample. Or what particular solutions they may use if they too find some problems they want to address.
BTW, I do not mean to imply that once you shrink things you will get a dramatic improvement. In my experience you will not. But you are actually guaranteed to be less overfit out-of-sample and you will get some improvement in my experience.
Jim
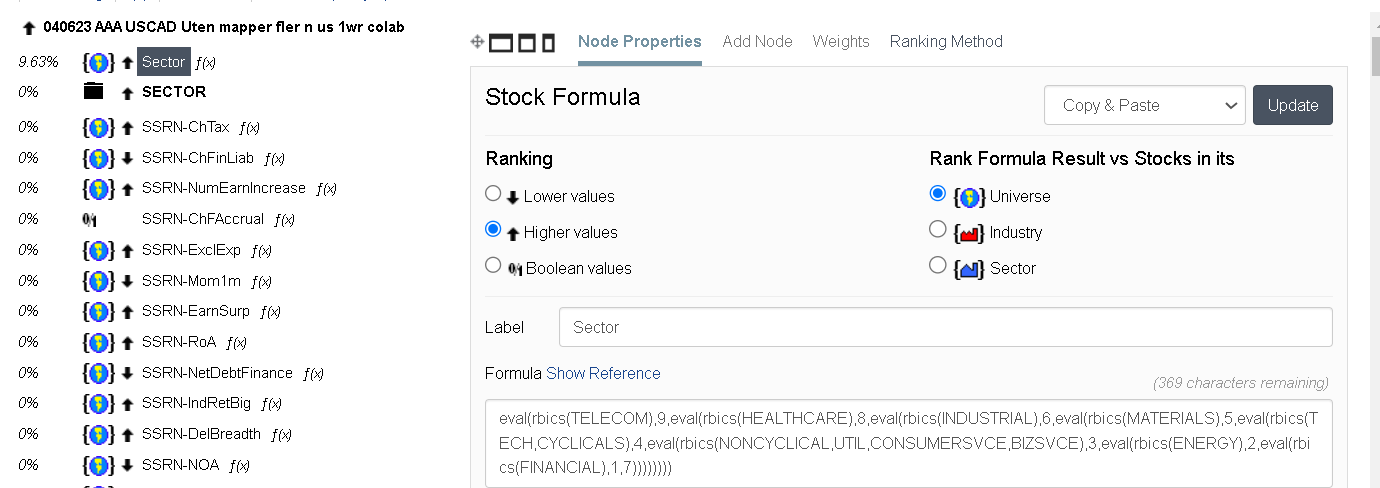
I think your ranking system is giving all stocks the same value no matter what sector they’re in. Try it and see.
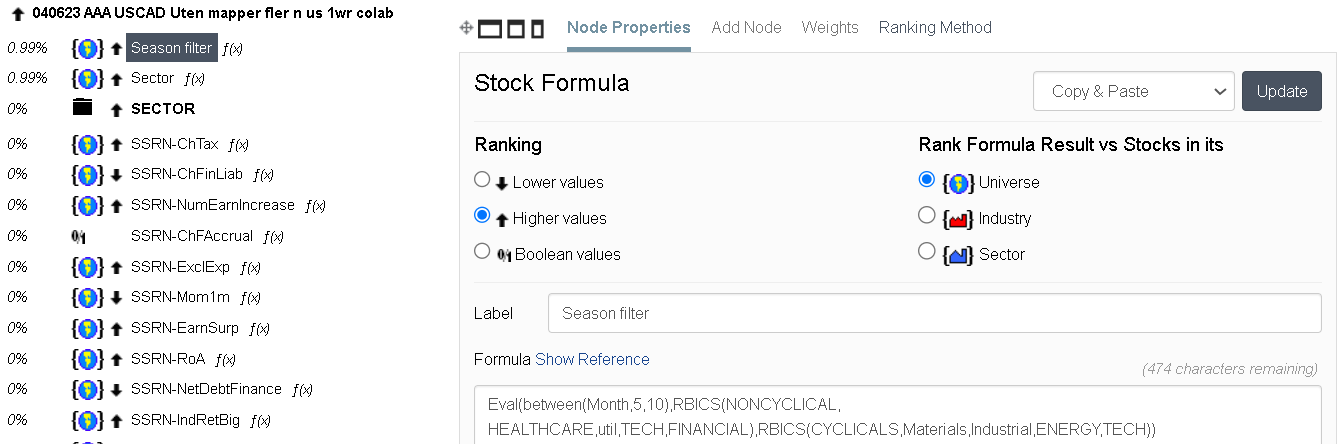
This is what I use:
eval(rbics(xxxx),9,eval(rbics(xxxx),8,eval(rbics(xxxx,xxxx),6,eval(rbics(xxxx,xxxx,xxxx,xxxx),5,eval(rbics(xxxx,xxxx,xxxx,xxxx,xxxx),4,eval(rbics(xxxx,xx,xxxx,xxxx,xx,xxxx),3,eval(rbics(xxxx),2,eval(rbics(xxxx),1,7))))))))
Why is this so complicated? We should have a SWITCH() function, similar to Excel. Then we can code it simpler. Like this:
SWITCH(rbics, nnnn, 9, nnn, 8, nnnn, 6, nnn, 5, nnnn, 4)
That’s a lot less work and less error prone.
I hardly ever optimize ranking weights. Maybe that’s just me. But I wanted to throw that out here just in case new users get the impression that it’s necessary.
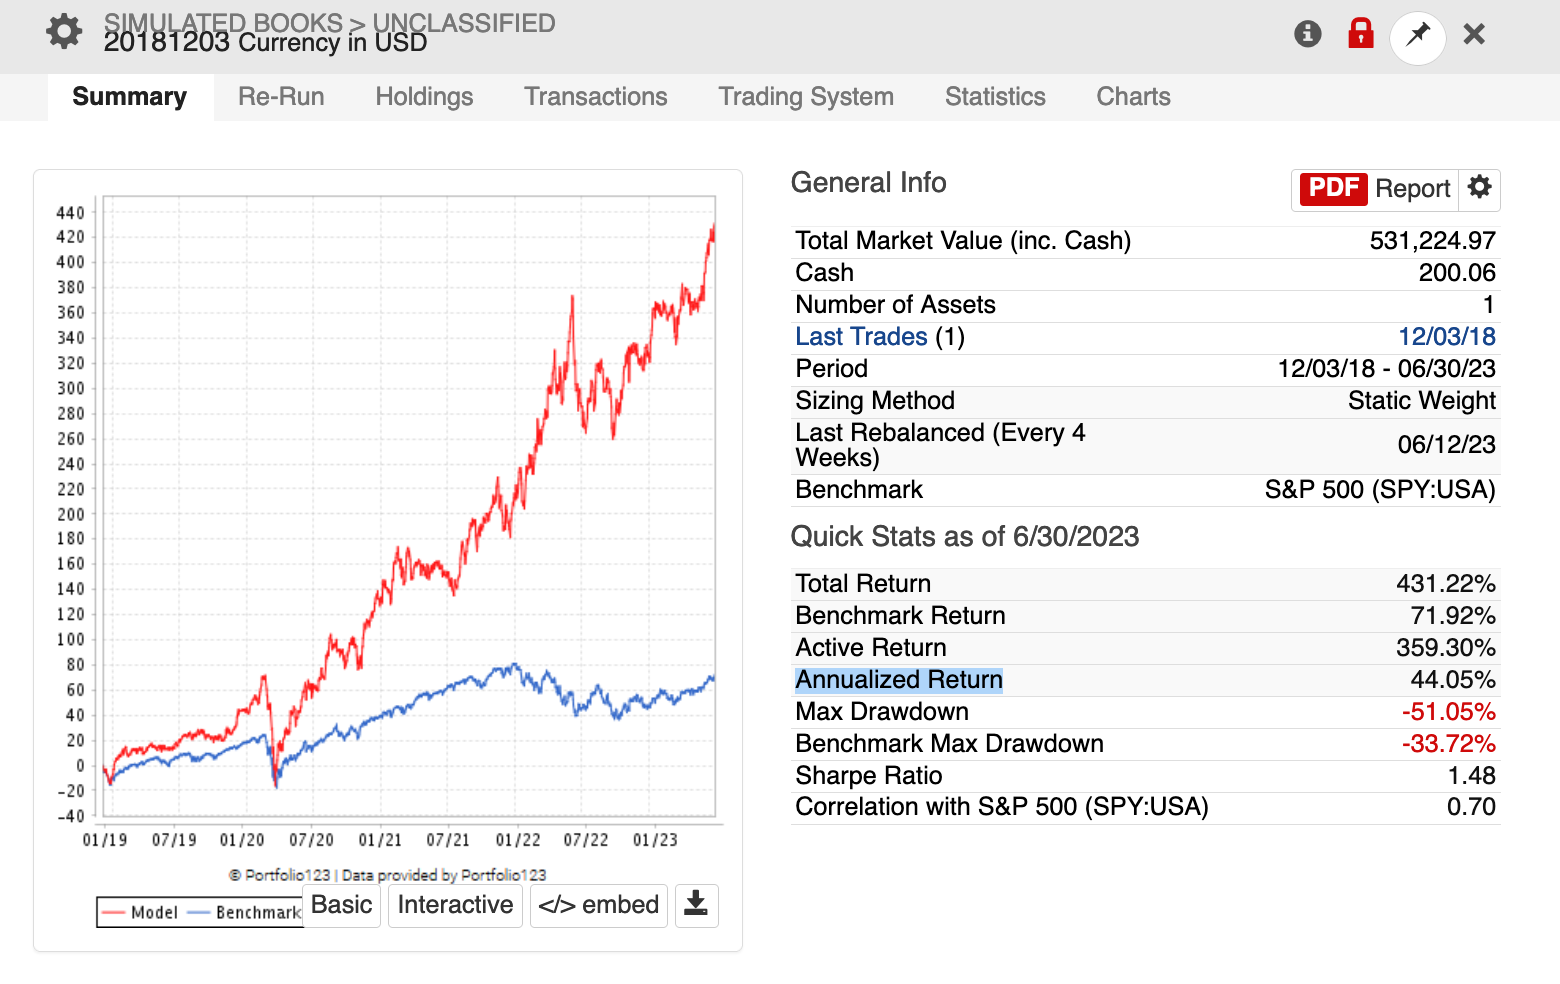
Below is my longest running live strategy. Factors are organized into composite groups and everything on a particular level is given the same weight. It went live 12/03/2018 and has an Annualized Return of about 40%.
I think my time was better spent building new rankers.
Yes, this is one way to do it.
A less error-prone method is Eval(RBICS(5678),9,0) + Eval(RBICS(2674),8,0) + Eval(RBICS(7828),7,0) + . . .
Ok, I will do that ![]() One question, the number behind the sector code, “(5678),9,0)” what is that? the weight? So here, give it a weight of 9%.
One question, the number behind the sector code, “(5678),9,0)” what is that? the weight? So here, give it a weight of 9%.
No, it’s not the weight. This formula doesn’t weight sectors or industries. It just assigns a value to each one for the ranking system, higher values being better.