Very happy with the new SmartAlpha and focus on OOS performance. One suggestion: sector allocation is replaced with “themes” which is too general for me. prefer sectors. thanks!!
Marco, If the drop down box is eliminated where does a newcomer go to find all the different R2G model designers. He doesnt know their names or usernames. Better yet where does an 11 year member like me go in order to remember them all. When you say it became unusable. I do not know what you mean I used it all the time. Now all we have is what is on the highest multisort ranking. AS far as misleading goes , what could be more misleading than just giving excess returns, This means that an 8% 16 year backtested return model gets the same ranking as an 50% backtest return as long as they have the same excess return. Again this is less information and data to make an educated decision. One final thought .In 2008 when all the P123 portfolios took big hits, new ones were created and put in their place. The old ports were put on a separate page. All of the new P123 ports where in sample then Why did you not leave the old ones and why are the new ones not treated the same, as you are now criticizing IS backtested sims returns as misleading . Under the same standard shouldn’t all the P123 port now only go back only to 2008-2009 and not 1999? When will that change come?
On the Smart Alpha Zoom Features, like the ability to put a From and To date, has disappeared. Not sure if this was intentional, but can you put it back? I use it a lot.
Tom C
bump
Did you try click and drag to zoom ? To zoom back out click MAX
Marco,
The click and drag to zoom is okay, but there are times when I want to be specific on a date range. For example, I may subscribe to a model earlier than I invest funds. So I want to type in the actual date I committed captial to the model to compare the model return vs my return. It allows me to see the variance between execution performance relative to the model. I don’t expect to be spot on, but I should be within a tolerance zone. With the click and drag method, it takes more user clicks to zero in on the date.
Yes, that is one of the ways I use this as well. I have a lot of trouble zeroing in by pointing and clicking. And if for some reason it isn’t possible to put it back, can a 1W (1 week) and 1D (1 day) button be added to the rest of the zoom buttons?
Thanks.
Tom C
FWIW, I agree with Andreas completely (highlighted section). It’s a bit inconvenient to have to go back into Excel and run the analysis there, rather than just quickly scroll back inside P123.
Marco,
I think the name change from R2G to Smart Alpha is unfortunate. Smart Alpha abbreviation is SA. This is the same abbreviation used for Seeking Alpha, the financial website featuring newsworthy articles.
I think a better name for the subscription models would be Ready Alpha, abbreviation RA. The “R” being reminiscent of the old R2G.
Georg, when is the last time anyone used “SA” in the P123 forums to refer to SeekingAlpha? They have become so bloated with articles I can’t recall the last time I went there. So I got curious to see what they are up to. Last thing they tried was a “app store” concept. I think it failed.
They now have a Stock Picking Contest. Once every month, $10K in prizes, so a big commitment from them. Each contest lasts about 2-3 weeks. The winners are decided by PRO members. If you want to read the entries you have to be a PRO member. I think for an investor it is a flawed concept in so many ways. Not sure how anyone can decide who to follow based on a 2 week contest: luck is a big part; and what if you do find someone to follow and they stop participating. AND it costs $300/mo for PRO membership
I’m not bashing SA for trying; we’ve tried many things that didn’t work. They are just trying to monetize the traffic of users.
However blogs do work. And we’re going to bring them. Let us know what blogs you visit, why you like them, etc. We’re are actively brainstorming this.
I also like seekingalpha idea of a flat fee to access contest entries. We could do something like that for SmartAlpha. Like a $99 flat fee to access up to 5 models. A designer could designate a certain number of seats available for that plan. This idea will make a lot more sense once we unveil what we’re working on (a invest / research mode of P123).
Thanks
Marco
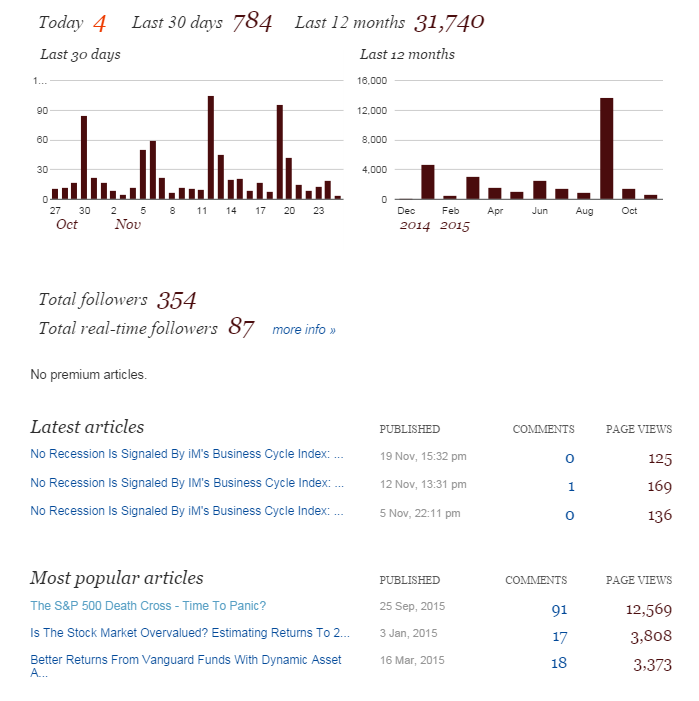
Seeking Alpha picks up blogs from my feed at imarketsignals.com.
I sometimes have P123 model descriptions on my blog and thus provide indirect advertisement for P123. Over the last 12 months my articles had 31,740 page views at SA. My recent death-cross article had 12,569 page views and 91 comments.
My blog preference is from Jeff Miller dashofinsight.com. He has a weekly commentary on what may move the market in the up-coming week with numerous links to other websites.
Best,
Georg
Marco,
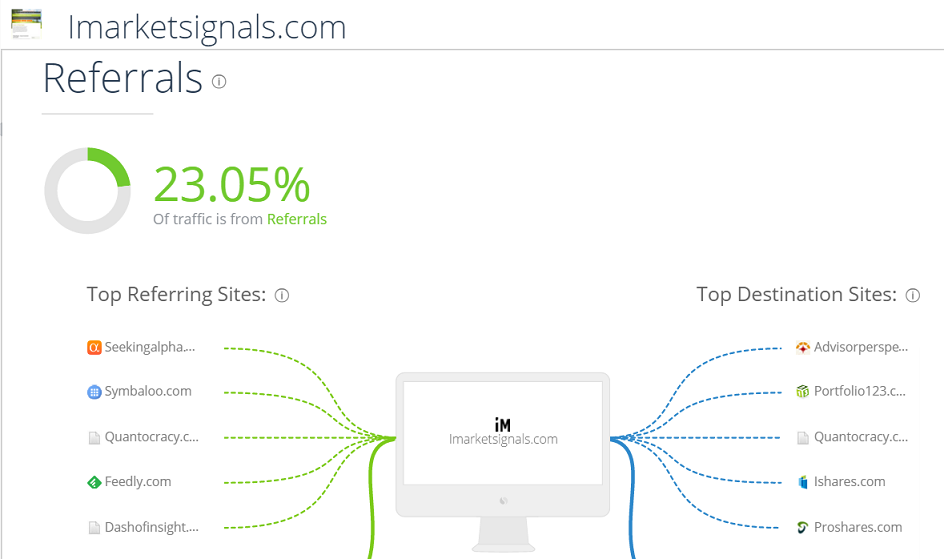
Now look where the referrals to imarketsignals.com come from. Top on the list is Seeking Alpha. That is the result of publishing articles on SA.
BTW Portfolio123 is the second highest destination site from my website.
Marco,
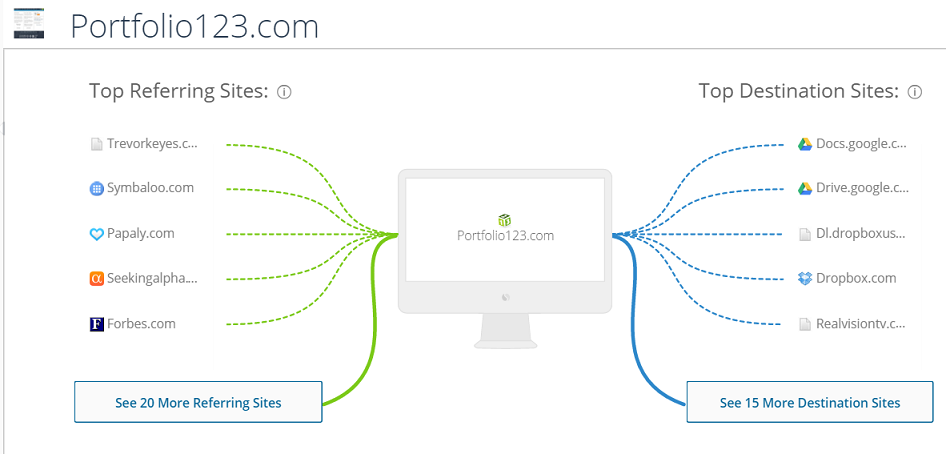
Now have a look of the referral sites to Portfolio123. Seeking Alpha is in 4th place, although you have not looked at them for ages. (Perhaps this has something to do with my articles which generate the traffic to P123.)
Marco,
I don’t want to be impolite and I understand you are very busy but are you planning to answer to my questions in this thread (concerning IS vs. OOS stats on R2G page and download) and if yes, then when and how? This is important not only to me but, as I see, to others and you too as you commented. Thank you.
It is important to me also. And, how we know when P123 data fixes/changes in the background effect R2G’s historical stats that we may be unaware of. I guess I am unfortunately coming to the conclusion that P123 is not something I can rely on. I was sure hoping it was. I don’t have the time to read through all of the threads trying to figure out what the bugs, fixes, concerns, etc are and if they may effect models that I am subscribed to. If/when you do re-instate the OOS stats of the R2G’s how do we know they are still accurate after all the fixes that have been made??? As others have said “this is real money” we are dealing with. Our family’s money. We need to have accurate data to base decisions from, that includes historical OOS backtesting stats. If you see issues with curve fitting in the designers codes, by all means try to find a resolution to that. I don’t know that I can justify subscription’s much longer the way things currently are while in the waiting to see “if and when” my concerns will be addressed. After a year of posting a concern of data fixes we are still no where on addressing how that effects R2G’s and now no longer have back testing annual stats they way we used to have. Not good at all.
I love the data fixes! Yes, I have real money on the line too. Personally, I would rather wonder if recent underperformance was caused by data fixes than wonder if it was false data that was causing underperformance. But that may just be me :).
Better data means more robust systems going forward.
Theories for recent underperformance
- We are entering the last stage of a bull market where momentum works better than value. This is what happened in 1998-1999; value was decimated. Then too as is the case this year a few mega cap stocks were up while the vast majority of the stocks in the market were down.
- Even within value factors themselves, factors that worked best during one phase of a market cycle don’t continue to be the best during the next phase. In addition, the top factors during one decade are not generally the best during another decade. The best that we can hope for the average P123 user is outperformance two out of every three years and over the full market cycle.
- Recent changes by Capital IQ (which was beyond the control of P123) to the way estimate data is reported caused problems. Perhaps this helped contribute to the underperformace of some models. I hope that this issue was completely fixed; but if not then I hope that it gets fixed soon.
- There may be too many R2Gs focusing on heavy trading of micro cap stocks. This may have caused liquidity issues.
The quality of the data on P123 is excellent and keeps improving. I am thankful to Marco and company for improving it. Occasionally I try to get my hands on data that is not offered here (such as global fundamentals, pre 1999 prices for various asset classes, or synthetic VIX indexes). I have yet to find a more reliable source of fundamental data.
@Marco, A change history may help address concerns about data fixes. A user who’se model stopped working can look at the change history to see if there was something that may have impacted his model. See for example here for a good template.
Thanks.
I start my Morning with P123. Marco and crew do almost everything for me. Furthermore, what they do does not seem all that easy.
Now if you they could just iron my shirts…
My serious point is:
I will be happy just knowing when CapialIQ’s data might be slightly delayed for whatever reason. This is already in the works, I believe. I haven’t fully developed my algothrm but maybe I would look at Yahoo estimates. Maybe download a list of stocks into InList() etc.
Maybe I can do a little work. No one said Marco would do everything for me and maybe there would even be an advantage to working with a little additional information.
I’m still learning how to do this and Marco’s help in understanding the data is much appreciated.
Hope everyone enjoys their day away from the American Stock Exchange!
Regards,
Jim
I have spent the last hour and a half looking through the forums and rules for Designer Models. There have been a lot of changes since it started. I am unclear where the list of rules are. Didn’t there used to be stuff like a sandbox where you couldn’t open up a model for a certain period of time based on simulated performance? Like 9 months or something if the performance was high in-sample? Did that change now that there are adjustments to showing simulated performance after a model is open for so many months? I can’t keep up. I can’t find a clear set of rules anywhere now and trying to sift through the forums like panning for gold is not easy as this stuff keeps changing.
Can anyone point me to a comprehensive set of instructions (not the What Are Designer Models or the Terms and Conditions)? Thanks in advance. I am sure it is here somewhere but this is like looking for Waldo.
More than the lack of list of rules I dislike the fact that standards keep changing but changes are not retrospectively applied to older models. As an example, opening a Designer Model today requires liquidity ADT > 150,000. If you browse the list of available models today, there are several far below this threshold:
Model – Liquidity
CEF Value Momentum – 53,045.75
Keating’s 50 4th Gen Microcap Investor – 70,614.39
Formula BG – 80,170.71
SmallCap GARP – 86,962.94
Twenty Stock Small Cap GARP – 89,742.47
Keating’s 20 5th Gen Microcap Trader – 94,701.92
Sherman’s way 2 go with a low Max Drawdown – 107,479.00
Don’t get me wrong: I rather favour higher than lower liquidity, but the same rules should apply to all models.
Can anyone give me a quick answer, including P123 staff, even if off the top if their head? What are the holding time restrictions? If there still is… does it still make sense if no insample data shown for 9 months or a year (or whatever the new rules are)?
If backtesting is not readily referenced, I guess I fail to see why there is a sandbox. Lack of live trading data usually keeps people from subscribing. And those that do understand the risks if a model has only been out of sample for 2 weeks. Just my view.