My timer is continuing to trend negatively. As of today:
SP500 50d is less than 200d
SP500 EPS trend 5wk is close now to being under 21wk. I expect this will happen shortly. But after new earnings forecasts come in over the next 10 weeks, it could start going positive again. I think the next month will be telling.
Employment trend is near a low and most likely will get worse. It is still positive but could easily turn negative at any time.
SP500 earnings are still better than 10Y Treasuries- by a wide margin. This is the one long pole in the tent of keeping the equity market afloat. If this one indicator is still stong while the others are weak it raises the question of where the money will go if it flees equities? Not into goveernment bonds. At least not yet.
Bond spreads of an index of all corporate bonds in a given rating category and a spot Treasury curve bonds has deteriorated steadily. This is worrisome because it gives sentiment of the bond market, which is important. Is most of this being driven by the oil industry having problems? Or is it broader?
Just to be up front without waiting to see what happens in the coming days and weeks, my 2-factor based timer is signaling to get back into the market today after exiting on 3/26/2018. A more refined and slightly better performing 4-factor timer I monitor is still out of the market. I have not actually acted on either timer yet because I only developed them during 2018 and am still hesitant to trust them, although my level of trust is improving. I am really curious to see how the market performs in the next few weeks.
During the period 3/26/2018 through 1/11/2019 the ETF RSP, which is my benchmark of choice, suffered a 19.78% drawdown before recovering to down 2.19%. My 30 stock real portfolio actually did just a bit better overall in the market than out, rising 0.02%, but suffered a 23.1% drawdown in the process. In retrospect, losing 0.02% plus round trip commissions by going to cash in exchange for avoiding a 23.1% drawdown sounds pretty good. Even better if I had been able to place that cash (in an IRA) into a vehicle during the 9.5 months that would have generated a better return than 0.02% after expenses. This is all in hindsight, of course, and only serves as a “what if” and is far from ideal, but it provides some hope to me that some form of market timing can be effective.
The two factors used by this timer are weekly calculations in their present form and could be used as a port rule since they don’t rely on FRED data that we can’t access in rules yet. One compares the average corporate AAA and BBB bond rates for the All Fundamentals universe and signals bearish when the difference in rates is low relative to their historically averaged difference. I think of it as signaling a concern by investors that the best AAA rated corporations, on average, don’t have significantly less risk than BBB rated companies. The comparison also works nicely between AAA and B rated bonds. The second factor is a comparison of the average earnings to price ratio of the S&P500 to the average time weighted analysts estimates of current and next year earnings. When the current comparison is less than the historically averaged difference, this signals bearish. I think of this calculation as a test of possible pressure on dividends. When both factors are bearish, the timer signals an exit from the market.
I like the relative simplicity of this timer and the fact that it does not directly rely on price momentum of the market but instead on factors that should impact, while being impacted by, prices. Some further “tuning” of the factors is likely possible but could result in spurious overfitting. I have several concerns regarding the timer and find it difficult to expose my funds to possible whiplash in/out expenses.
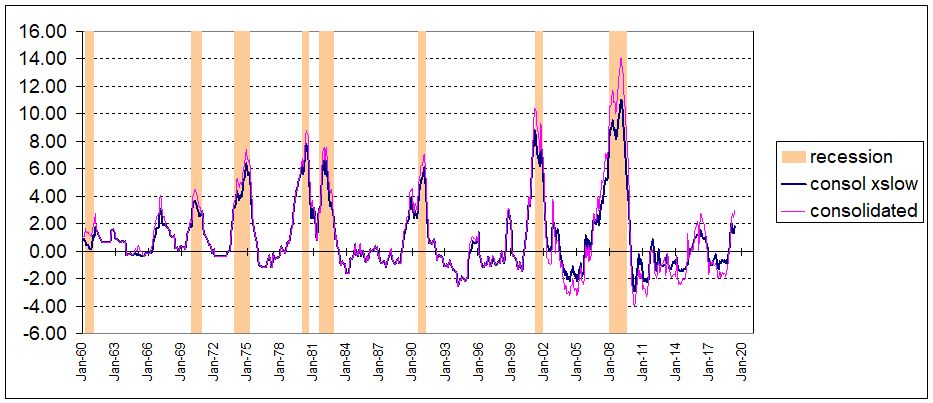
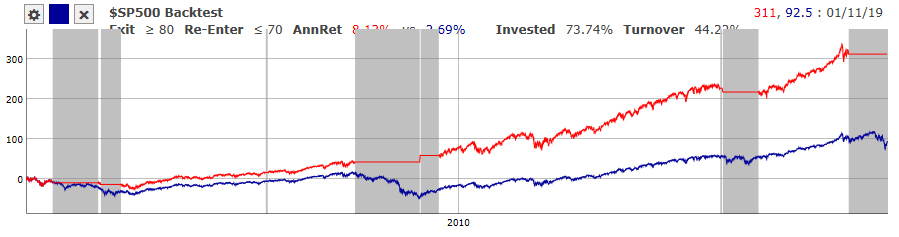
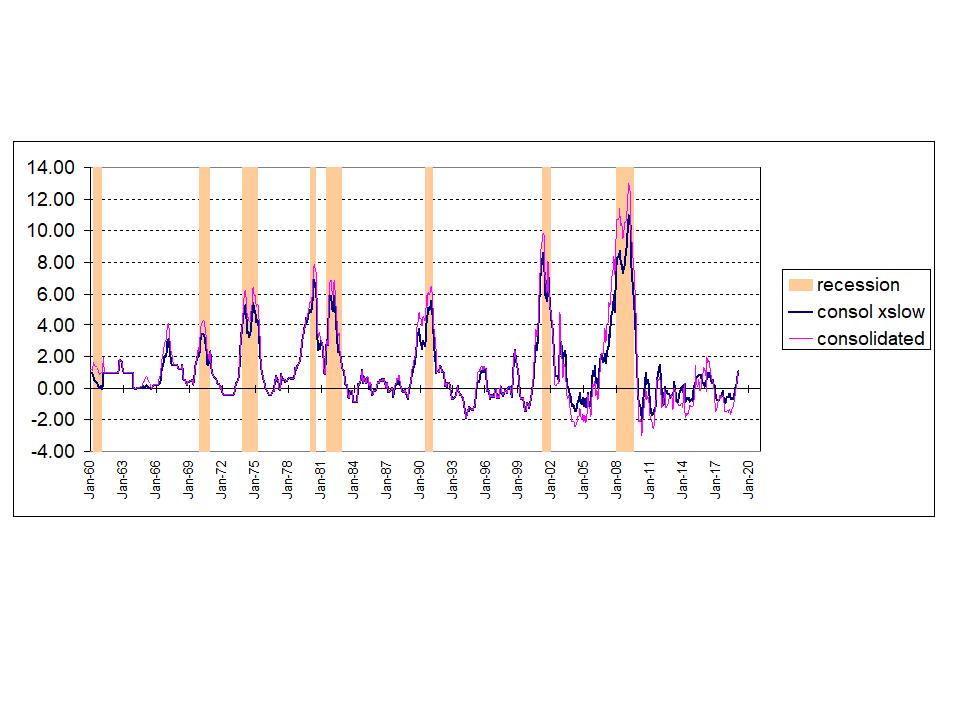
So there you have some of what I am attempting with timing. I tell you now so that I am not cherry-picking the results by waiting to see what happens next! The chart below shows how this 2-factor timer has fared using SPY since both factor calculations were available in 2000. There is some brief in/out whiplash trading that is avoided in a 4-factor model I am watching. This chart also shows the frustrating overlay problem I have mentioned in an error thread, where the calculated values for the chart results are partially obscured due to the chart layout.
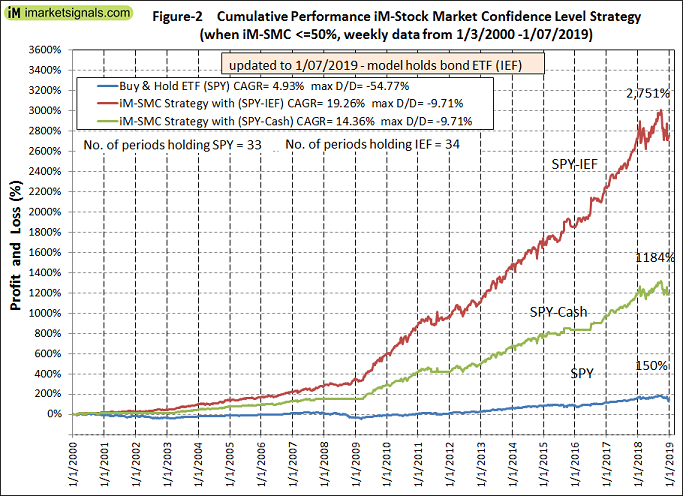
This is what my weekly Stock Market Confidence level looks like for 2018. It is based on 11 of my market timers. As you can see it has severely deteriorated in December. Model gets out of stocks when iM-SMC <=50%.
iM-Stock Market Confidence Level, iM-SMC (%)
01/02/18 … 90
01/08/18 … 100
01/16/18 … 100
01/22/18 … 100
01/29/18 … 100
02/05/18 … 100
02/12/18 … 90
02/20/18 … 95
02/26/18 … 95
03/05/18 … 95
03/12/18 … 85
03/19/18 … 85
03/26/18 … 85
04/02/18 … 85
04/09/18 … 85
04/16/18 … 80
04/23/18 … 85
04/30/18 … 85
05/07/18 … 85
05/14/18 … 85
05/21/18 … 85
05/29/18 … 85
06/04/18 … 85
06/11/18 … 85
06/18/18 … 85
06/25/18 … 90
07/02/18 … 80
07/09/18 … 95
07/16/18 … 95
07/23/18 … 95
07/30/18 … 95
08/06/18 … 95
08/13/18 … 95
08/20/18 … 95
08/27/18 … 95
09/04/18 … 95
09/10/18 … 100
09/17/18 … 100
09/24/18 … 100
10/01/18 … 100
10/08/18 … 100
10/15/18 … 95
10/22/18 … 100
10/29/18 … 95
11/05/18 … 95
11/12/18 … 85
11/19/18 … 85
11/26/18 … 85
12/03/18 … 75
12/10/18 … 75
12/17/18 … 45
12/24/18 … 50
12/31/18 … 50
1/7/2019 … 45
FWIW, my market timer, which is closely based on this blog post - https://www.philosophicaleconomics.com/2016/02/uetrend/ - indicates that a recession is imminent (unless the S&P 500 gains another 35 points today). Basically, the unemployment rate has been above its 12-month average two months in a row and the S&P 500 is below its 10-month average. I’m going to exit equities in my 401K accounts while keeping my other accounts invested in microcaps. There have been false signals before, but not that many (11/1979, 4/1980, 9/1990).
For an opposing view, which I wrote myself, see https://backland.typepad.com/investigations/ or https://seekingalpha.com/article/4234766-market-timing-tactical-asset-allocation-trading-dialogue (two URLs but the same article, the second with comments and ads).
Just published this on SA:
The Unemployment Rate May Soon Signal A Recession: Update - February 1, 2018
https://seekingalpha.com/article/4237500-unemployment-rate-may-soon-signal-recession-update-february-1-2018
[quote]
FWIW, my market timer, which is closely based on this blog post - https://www.philosophicaleconomics.com/2016/02/uetrend/ - indicates that a recession is imminent (unless the S&P 500 gains another 35 points today). Basically, the unemployment rate has been above its 12-month average two months in a row
[/quote]How much of that spike in unemployment was temporary and due to the government shutdown?
Unemployment rises as the economy strengthens due to people who had given up looking for work starting to look for jobs again. At least that is what the talking heads say …
The best part of this shutdown will be when people realize how much of the federal gov’t has zero impact. From my own experience, saying this in a federal government office gets frightened looks. It wouldn’t be scary unless there were at least some truth in it.
This is a good thing. Damn the torpedos.
Earnings growth isn’t looking too good either.
The debt markets seem to be saying right now that the sky is not falling.
The CORPBBBOAS spread, AAA-BBB spread and TED spread all seem to be shrinking (very slowly) and the way I interpret that is the debt markets think company’s free cash flow can handle debt (which is high). I think that is a good indication. Another POV on earnings stability, at least.
Am I reading this right?
David, your post leads me to point out how a recent post in this thread by me was absolutely wrong, and I’m surprised that nobody called me on it!
In a post on my 2-factor timing model, regarding one of the factors, I said it: “… compares the average corporate AAA and BBB bond rates for the All Fundamentals universe and signals bearish when the difference in rates is low relative to their historically averaged difference. I think of it as signaling a concern by investors that the best AAA rated corporations, on average, don’t have significantly less risk than BBB rated companies. The comparison also works nicely between AAA and B rated bonds.”
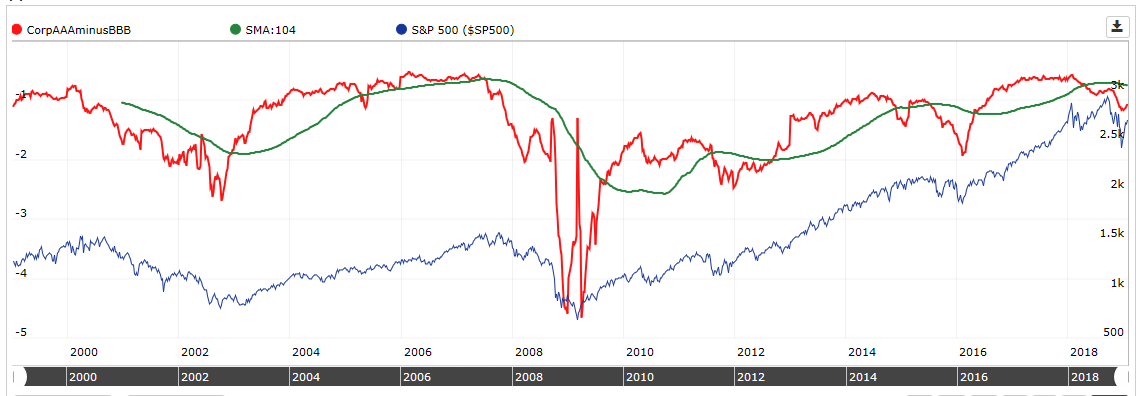
There is a slight bearish potential when the difference is small, but the much more obvious ongoing effect occurs when the difference is larger than on average. The AAA bond rate is less than the BBB rate, so AAA minus BBB is a negative value. A bearish signal from this factor, as I am using it, happens when that difference becomes more negative, not less, as shown in the plot below. The difference between AAA and BBB rates increases, not decreases, so my reasoning for the effect, as I am using it, was bogus.
Regarding the recent narrowing of the rates that you point out, the narrowing is in place but my model still shows this one factor as a bearish signal, for now.
have been Long and still ling until sp500 75 ma is broken and (!) 75 MA of Earnings are broken too…
Hi all. I’ve been working on a recession indicator also and figured I’d share this.
- It’s new and still under development -
- It uses mostly FRED data, and a lot of recent government data is not updated yet due to the shutdown - so December data is pretty spotty and end result will probably be higher, but I don’t expect much more given the remaining series.
- some of the most recent updates are better than I expected, so what looked like some worrying trends in housing and corporate spreads seem to have reversed.
- some data didn’t exist the farther back in time, so the growth of amplitude of the signal over time is due to that.
So I guess overall, the signal I’m looking at is inching up, but some of the scarier trends from a few months back seem to have stabilized some, and the absolute magnitude is of the signal is small presently.
The model does not incorporate global pmi, so the developing bad trends in Europe and Asia are not showing up in the indicator. That is probably the main external factor that I’m concerned about now - lots of major economies like China, South Korea, Germany, Italy have mfg pmi below 50. Japan is close at 50.3. Almost all countries are downtrending. I don’t how the deteriorating global pmi feed into US, but I suspect it’s not helpful.
Statistically speaking a recession must be around the corner i.e. within a two year time frame.
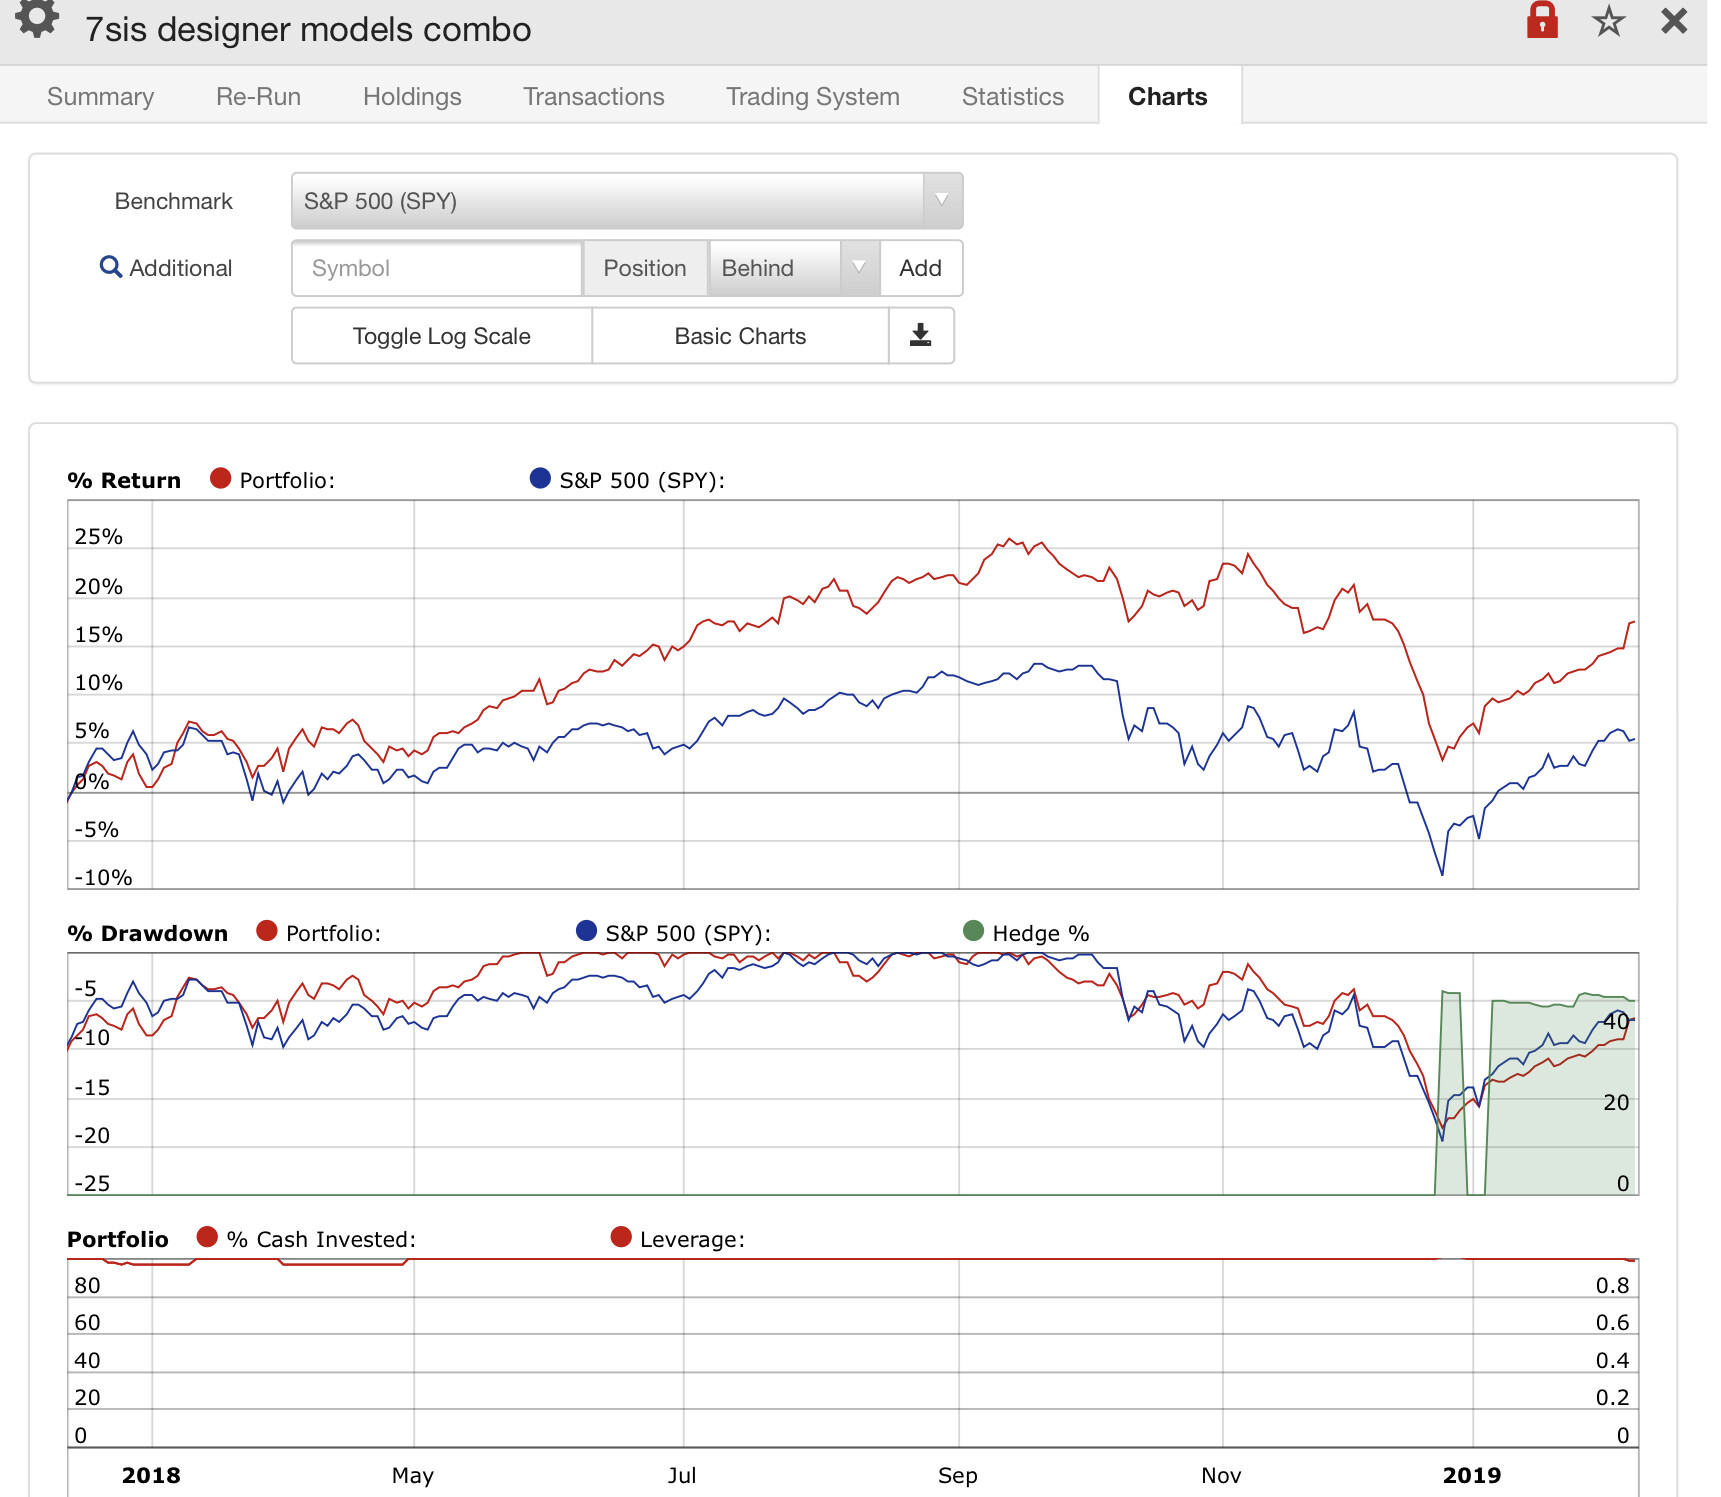
I follow trading my two designer models: one has market timing active right now, the other one not yet. Overall I can‘t complain about performance, although big tobacco has spoiled the party a bit in December.
I was re-looking at all of my port’s return and they all started to deteriorate at about the same time, last summer, 2018.
I think it was due to the trade war with China: “China’s Commerce Ministry accused the United States of launching a trade war and said China would respond in kind with similar tariffs for US imports, starting on July 6, 2018.”
The markets have been going up steadily, partially, it seems, because of the ‘good news’ about easing trade tensions.
Projected SP500 earnings have slumped so it is real but I wonder if this whole thing was effectively news-driven by worse case scenarios of trade? The analysts who created the projections were in the same negative and fearful state of mind as everyone else.
It now looks, to me, like this was a false downturn caused by a perceived macro event, ie, jawboning on a trade war. The other indicators for the economy remain strong.
Too bad we had to go through this. It is not clear at all that it was worth it.
If I was a technician, I’d think we just broke trend in housing starts. It’s just one datapoint in a single month (December) where alot of things were going on, and seems perhaps conditions improved since then. On positive side permits held relatively flat. It’s of note the market did not seem to react very negatively to this though.
My 2 factor market timer, based on corporate bond rate spreads and a comparison of S&P500 earnings to yield, is signaling an exit tomorrow (6/10/19). Other timers I am tracking are still in the market. I probably won’t act on this signal but will watch.
Bob, in the interest of sharing, these are my five indicators. I need a total of any four of the five to be negative to sell. As of yesterday’s P123 update, all are still positive:
showvar(@SPprice,sma(50,0,$sp500)>sma(200,0,$sp500))
showvar(@SPeps,sma(5,0,#spepscny)>sma(21,0,#spepscny))
showvar(@Fedmodel,Close(0,#SPRPBlend)>1)
showvar(@Unemp,(Close(3,#UNEMP)-Close(0,#UNEMP))>0)
showvar(@credit,(close(0,##TEDSPREAD)<.8) & (close(0,##CORPBBBOAS)<2) & (close(0,##CorpBBB)-close(0,##CorpAAA)<1.5))
credits to P123, George Vrba, Steve Auger and others