This is good advice indeed, and I thank you. I don’t know whether it’s realistic to expect such a lot of subscribers, but I might as well try. I do need to adapt my present systems for designer models since with a higher liquidity limit I’ll be emphasizing different factors.
My system is indeed very different from those of other users. I don’t have a single one of the stocks in the “popular with our users” list, nor do I have any of the stocks on the “top stocks in Portfolio123 models” list. My top seven holdings right now are INTT, ALSK, STRM, JIVE, CNTY, MEIP, and BASI. I don’t think those stocks are very highly ranked in most people’s models. Their QVG ranks are mostly pretty low: 60, 66, 30, 38, 98, 44 and 30 respectively.
How comfortable are subscribers with buying stocks that sell for under $3? There are plenty of good stocks with ADT over $500K but prices under $3 (e.g. VVUS). Should I put a lower price limit of $3 or $1 on my universe?
The overall return for QLD/SSO with basic market timing might be 20-30% but it will be quite volatile. Large cap designer models don’t have as much OOS but provide much less volatility - should be able to get return in the 20’s w/basic market timing.
Let’s say I launch a designer model that rebalances every three months. Does a new subscriber then wait until the rebalance in order to get recommendations? Or does the model recommend the held stocks? If the subscriber subscribes two months after the last rebalance, is there a way for her to get the top ten ranked stocks as of that date rather than the top ten stocks two months ago?
Can I change the ranking system regularly as I get more and better ideas and do more backtesting? Or is it set in stone once I launch the model?
Looking through all the designer models with a decent number of subscribers, I can’t find a single one that rebalances less frequently than weekly. Maybe a 3-month rebalance wouldn’t get subscribers because of the above problem and I should just offer weekly rebalanced models?
I am interested in your weekly rebalance models in Smallcap & Midcap.
One of the boon in p123 is weekly fundamental data. If any model take the advantage of timely data and perform in out of sample, it will attract more subscribers.
[quote]
How comfortable are subscribers with buying stocks that sell for under $3? There are plenty of good stocks with ADT over $500K but prices under $3 (e.g. VVUS). Should I put a lower price limit of $3 or $1 on my universe?
[/quote] I ALWAYS use a universe of >$1 and I don’t use a buy rule greater than that. In my mid and large cap ports I very seldom have a buy recommendation less than $3 so for those it probably doesn’t mater much depending on the design of your ranking system.
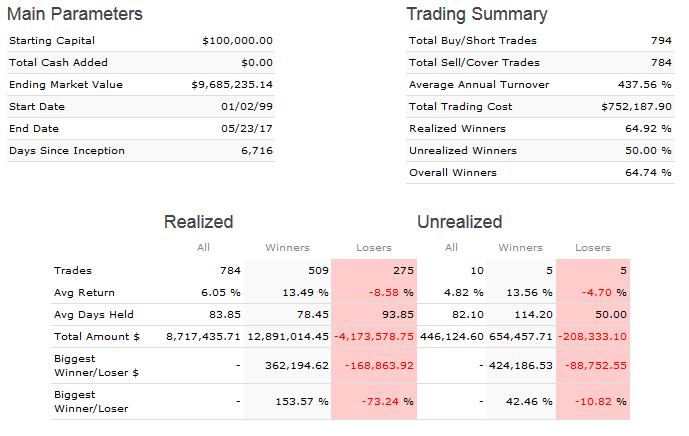
Of my 3 micro/small cap ports, my ranking systems include a Close(0) factor set to lower is better. I just downloaded the Transactions; All page of the 3 ports to excel, ordered them on Price, and compared the stocks that were bought with a price < 3 to those bought with >= 3.
18% of the stocks had a price < 3 and of those the % winners was 67.3%. While the stocks with a price >= 3 had a % winners of 64.6%. that’s not a big difference, but it implies there is not a good reason to limit the stocks to a price >=3.
3 months rebalance model might have good number of savvy subscribers.
They will subscribe once in 3 months using last rebalance date + 3 months.
Just they need to subscribe for the rebalancing months. 4 times a year.
Well, I just launched three designer models. They’ll be available for subscription in three months, on August 20.
But I’m quite dismayed by two things.
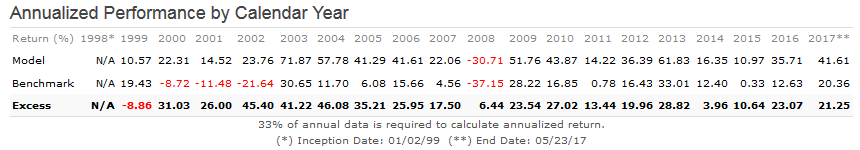
I defined my three models by market cap, using the conventional limits: up to $1 billion for small and microcaps, $1 to $5 billion for mid caps, and over $5 billion for large caps. But when I look at the holdings of my large-cap model they’re all classified as mid-caps and when I look at the holdings of my mid-cap model they’re all classified as small caps because of the way P123 uses a percentage ranking and because of how expensive stocks are nowadays. So it looks like the very NAMES of my models are lies.
The stocks are ranked by momentum, value, and quality using P123’s conventional ratings. My picks are NEVER going to be near the top of those ratings because I use completely different measures. For my small cap models, the ratings are all in the 40s. This puts me at a significant disadvantage. Why should P123 impose their measures of value and quality on designers who might have entirely different measures? I use a LOT of measures of quality and value that P123 doesn’t use, and in my opinion, my stocks have VERY high quality and value.
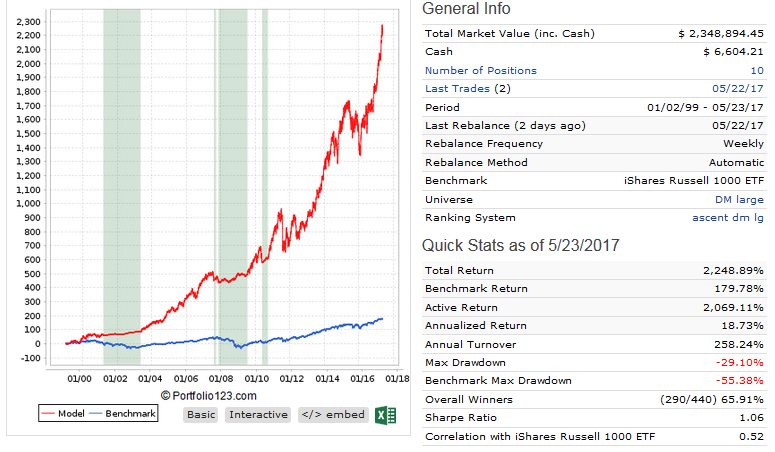
I don’t know how much you can see of my models at this point, but they’re here:
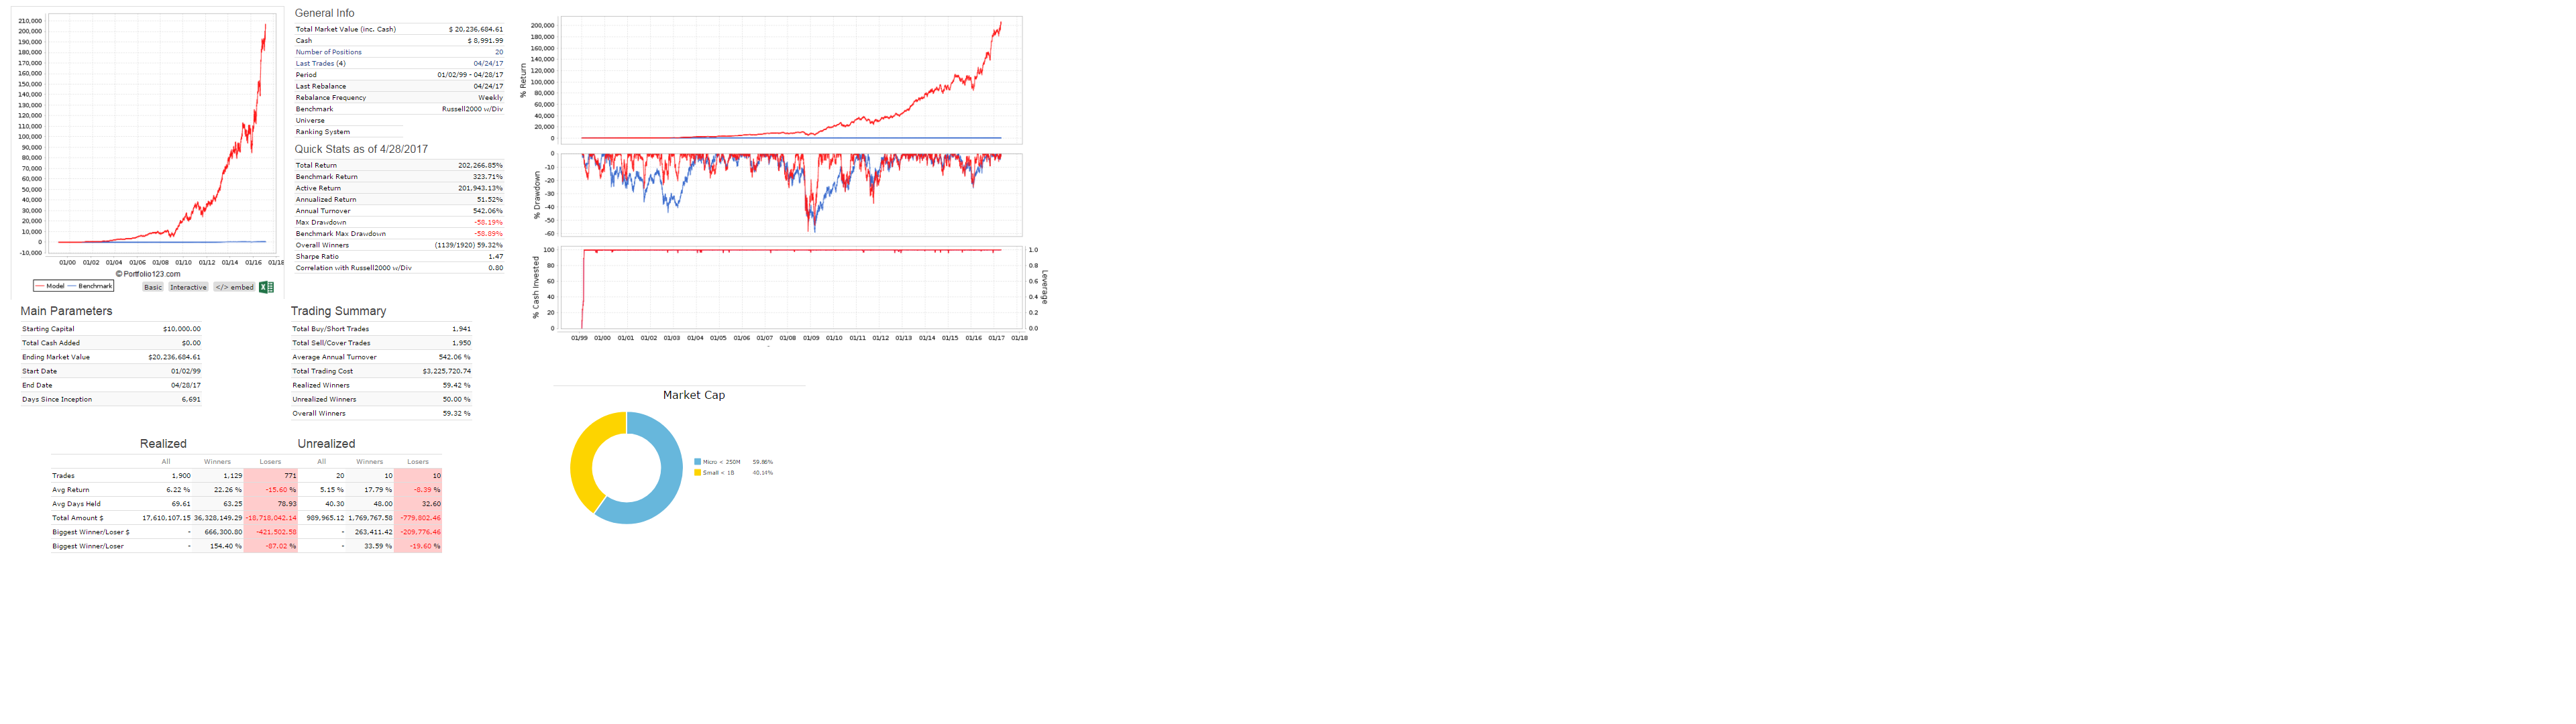
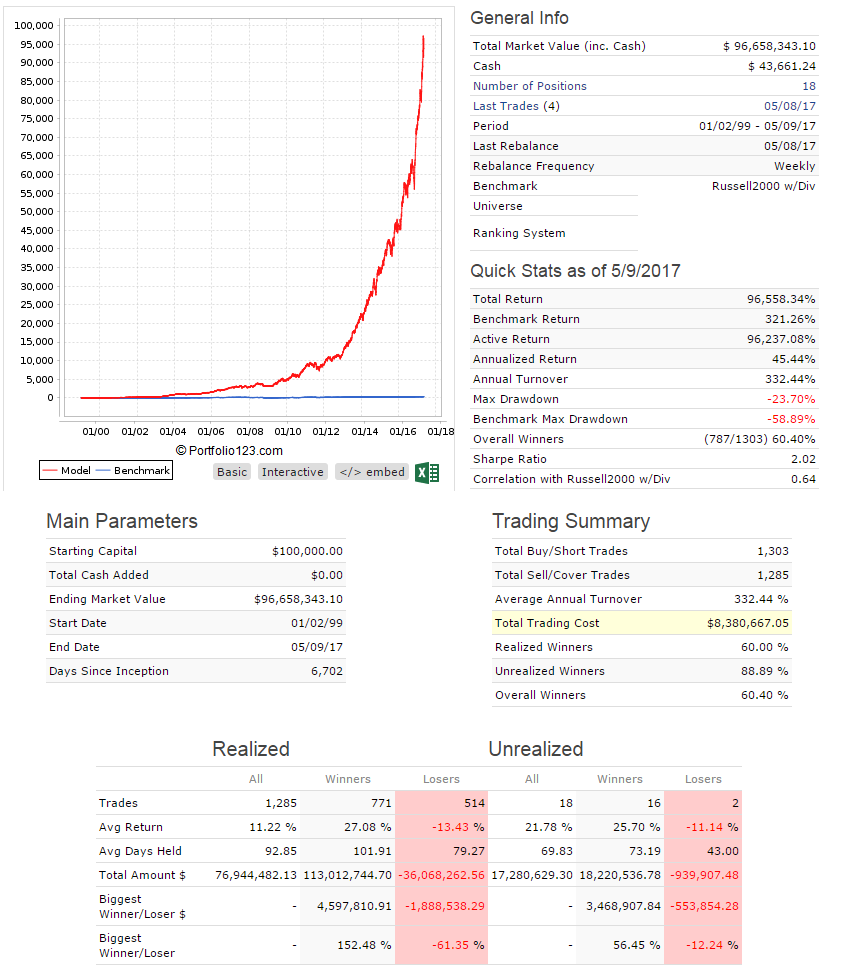
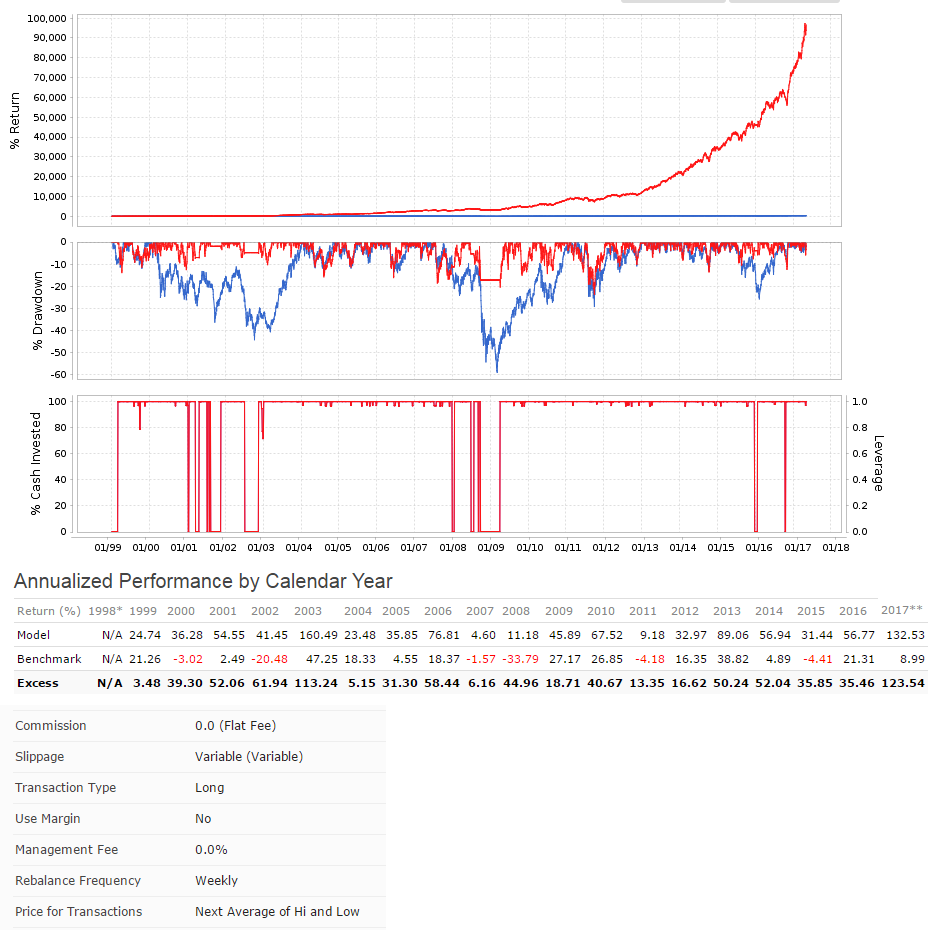
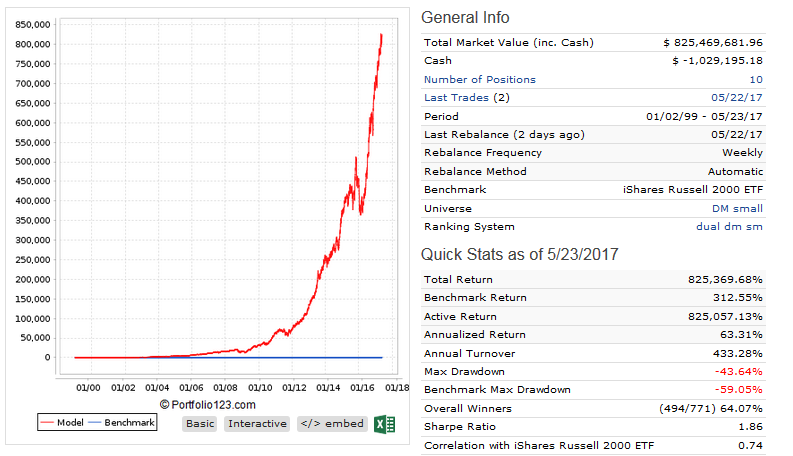
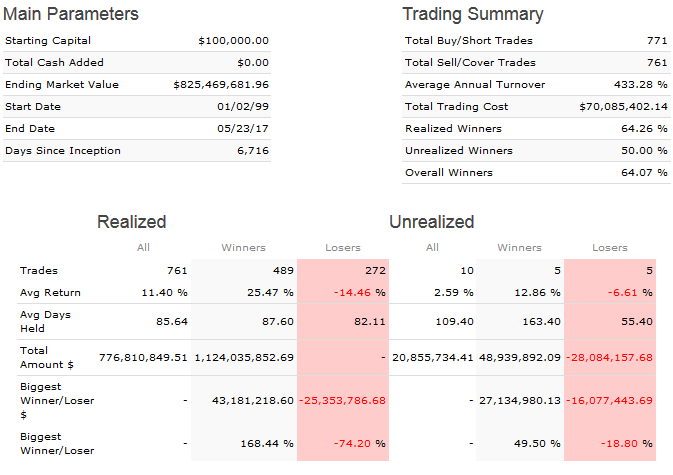
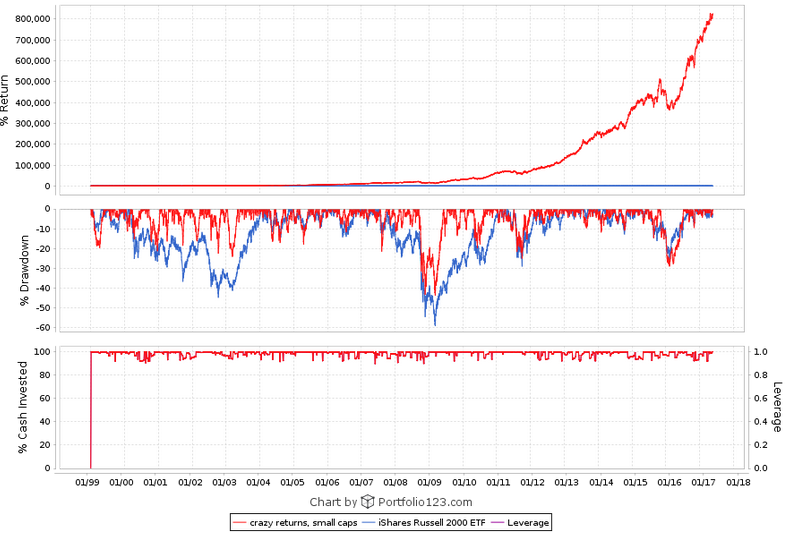
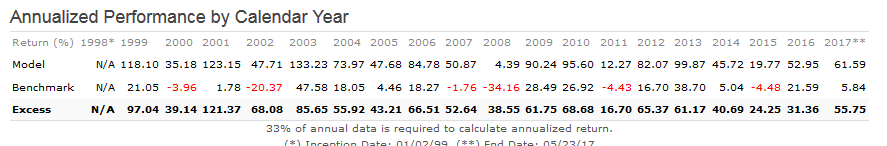
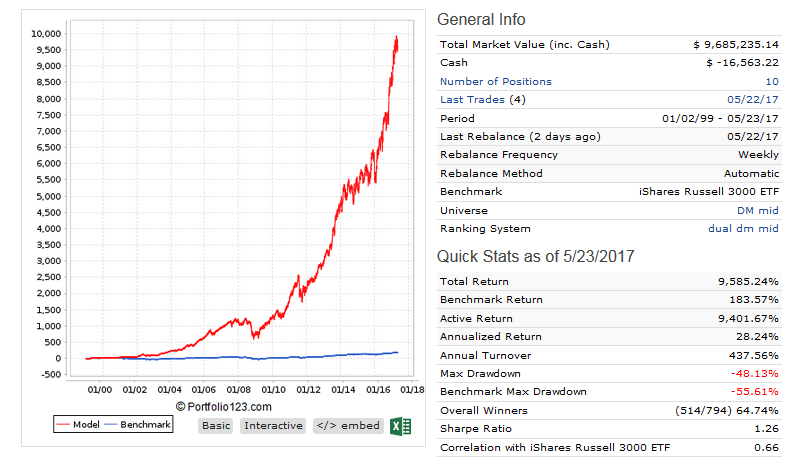
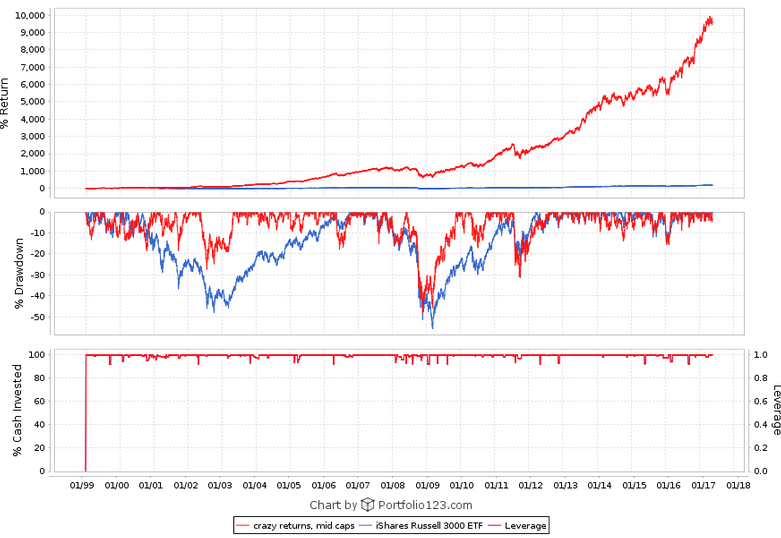
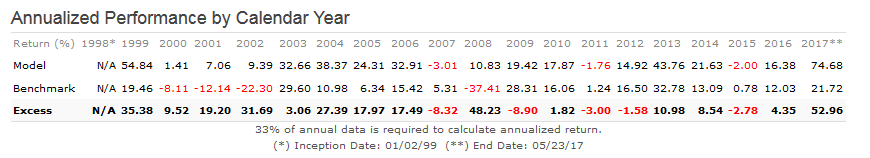
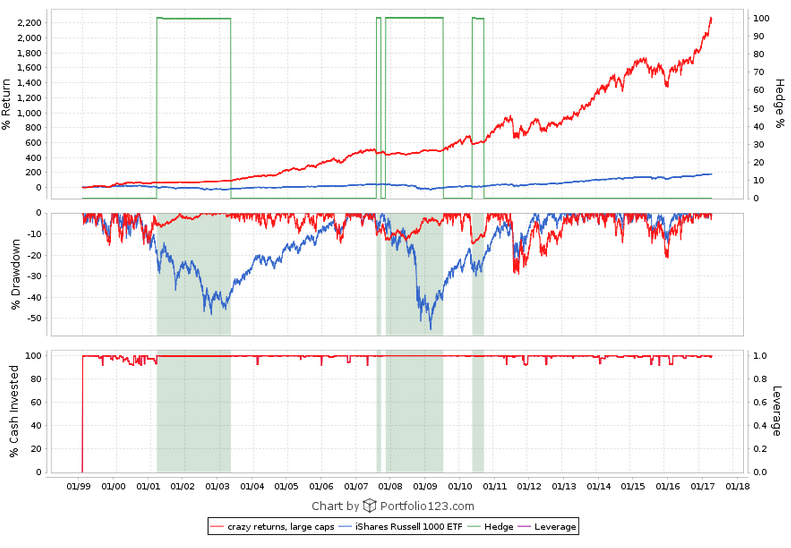
Here are the charts. The small cap model has a $500,000 minimum 3-month median daily dollar volume and a maximum market cap of $1 billion. The mid cap model has market cap limits between $1 and $5 billion. The large cap model is for over $5 billion. All three are designer models so they’re variable slippage and the buy and sell price is the designer model formula (part high, part low, part open, part close, I think?). You can get descriptions of them at the links I provided earlier.
forget about the P123 style ratings. They are equally inappropriate for my designer models. My Perpetuum Alpha for instance has great momentum stocks, yet the momentum rating has never been higher than 47.
When it comes to designer models, the ONLY metric that counts for me is out of sample performance. You will have to be patient and wait until potential subscribers get convinced about repeatability of simulated annual returns.
if you run a simple backtest from 1999 to present, it is just one of many possible realizations. Sometimes such a backtest can be heavily influenced by one or two stocks which make extraordinary returns (in particular for 5 or 10 stock models).
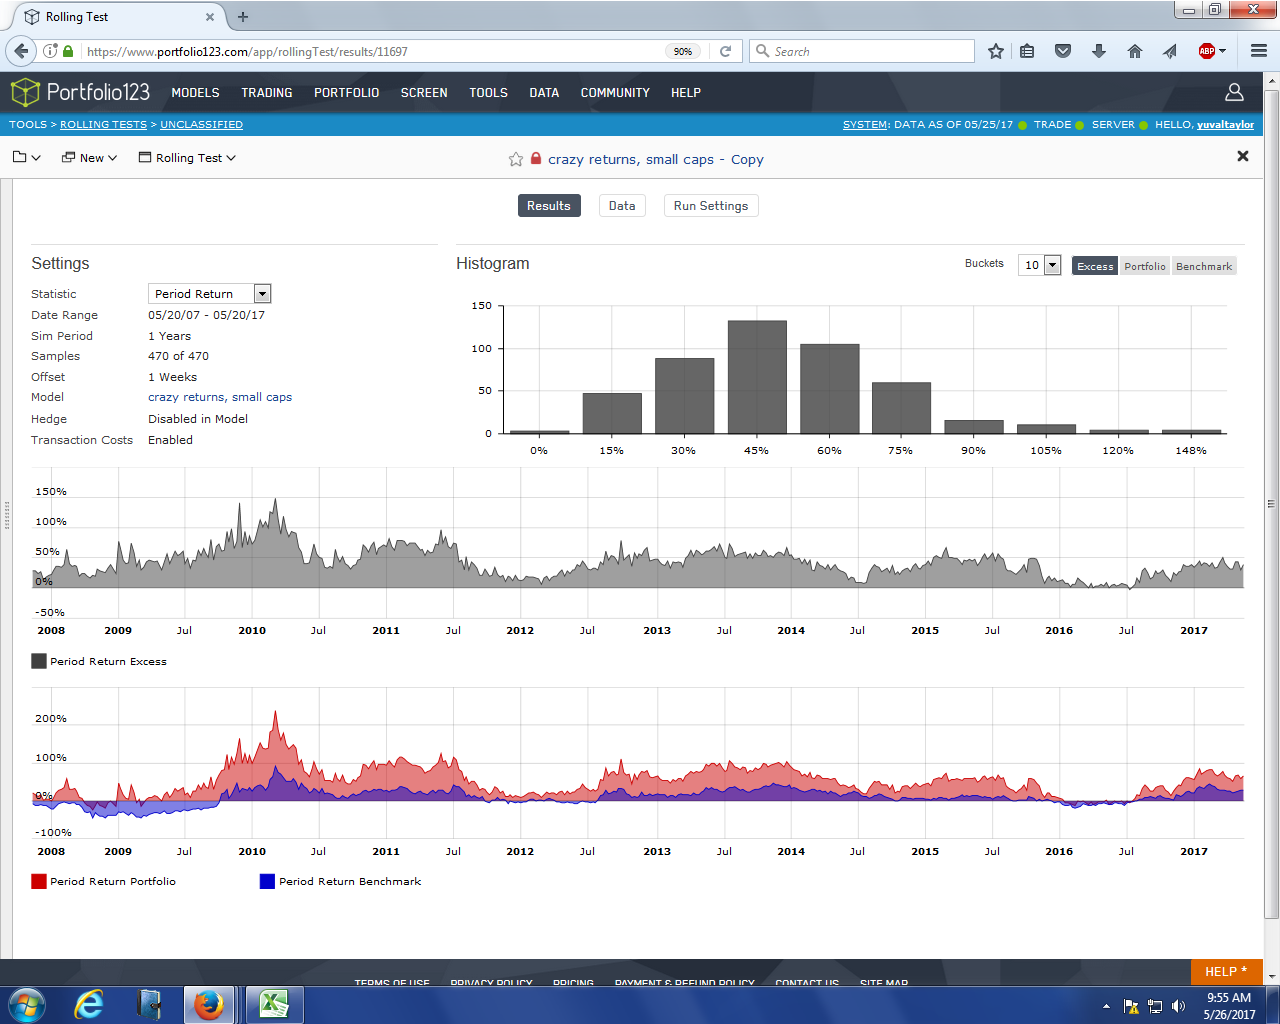
In contrast, the rolling test allows you to do multiple backtests at once. In your case above it is 470 simulations, and each of them is lasting one year. The start date from one simulation to another is offset by one week. So that gives you multiple scenarios, independent from a lucky stock pick.
Your rolling test looks great. What it tells us (looking at the buckets of the histogram) is that almost all of the 470 simulations produced excess returns; only the bucket to the left (where the 0 is written) has returns below the benchmark. On average following this strategy for a year produces 30-45% excess return (this is the bucket with the 45 written at the bottom).
If you click on the drop down item under the settings in the upper left, you will be able to illustrate similar statistics for portfolio return, Sharpe etc.