Some measures of the ongoing correction

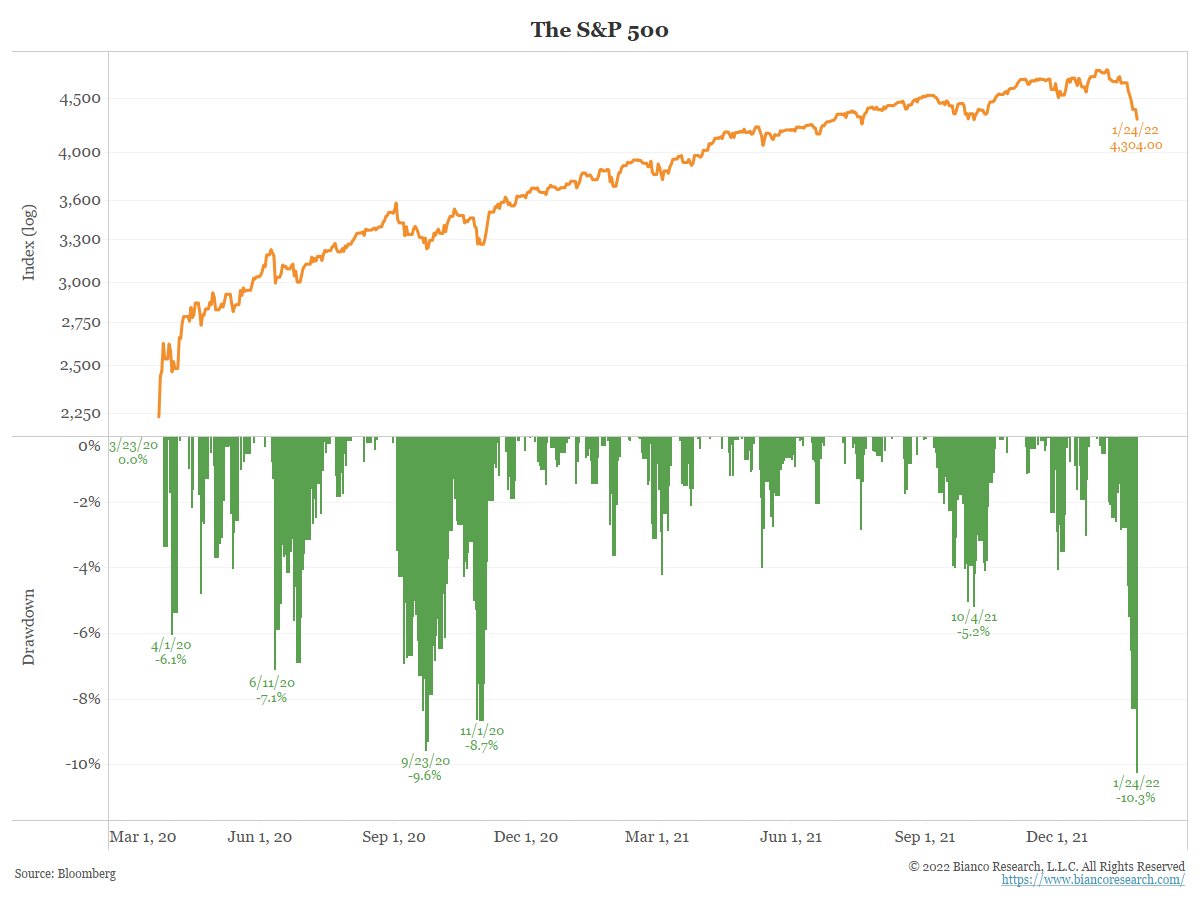
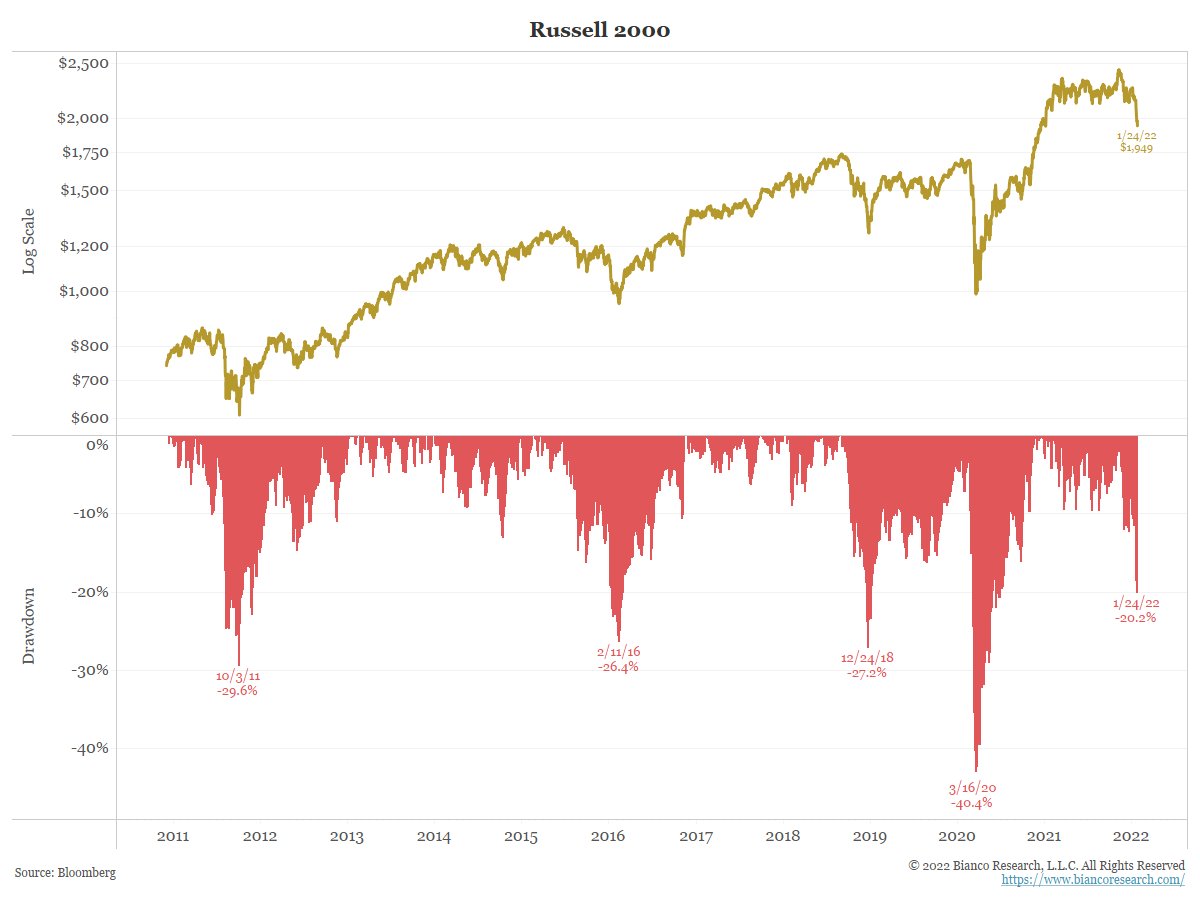
Yes, I agree that it’s impossible to predict, but I’m also astonished by how strong the entire year of 2021 was, and had expected some huge annual corrections but didn’t see them. So I’ve been thinking that this is an expected correction that should have happened sooner, but like I mentioned, no one knows.

I do not believe it is possible to time the market, but we do have some economic indicators that can provide some hints. It is used slightly differently in each model, and the best link to one of the models is probably this: http://www.philosophicaleconomics.com/2016/02/uetrend/

You are correct that the text are insufficient to completely comprehend the model, however they do provide some insight into which metrics are employed:

"…Real Retail and Food Services Sales (RRSFS, a measure of economic consumption) and the Industrial Production Index (INDPRO, a measure of economic production) " … " GTT-UE Rate: At the close on the last trading day of the month, calculate the 12-month average unemployment rate (UNRATE) as of the end of the previous month. “…”… “If recession is signaled, compare the S&P 500 (SPY) to its 10-month moving average. If it will close above the average, go long the S&P 500 (SPY) at the close, otherwise move to cash.”

“… To know when to switch between them, SPY-COMP monitors 6 different economic indicators. When no indicators are signaling recession, the strategy remains long SPY, regardless of what price is telling us. If any one of those indicators is signaling a potential recession then it defers to trend-following to confirm”…

Macrochart on P123 is also a good place to test the predictability of different indicators.

But, as I previously stated, I don’t know, but I’m not Jeremy Grantham, so I don’t see a bubble that will send the market down 50%…

The unemployment rate indicator in that link would have missed the 3/2020 downturn

There’s no relationship between a strong year and corrections. They can happen after weak years too.

It’s super easy to data mine indicators that look great in a back tests but fall apart out of sample so be careful relying on them too heavily as Jim stated

Jeremy Graham has an accuracy rate of 47% which is worse than a coin flip. You’d do better betting against him.

Scott,

I just want to say that my posts can be used as a reliable indicator of the market direction also–and my record is better than Jeremy Graham’s. To the extent that I said the market will be correcting soon you are safe to go long.

To be objective I think I did say the market was overextended. But I never said a huge correction was going to be happening soon. Timing is always an issue.

As an example, people where predicting problems with housing long before the 2008 recession. My understanding is that some of the people who profited from the 2008 downturn barely succeeded because it took longer for it to happen than they expected and some of their derivative contracts were about to expire. For sure, Schiller was predicting problems with the housing market for years before those problems were manifest in the market.

There could be a similar discussion about timing being an issue in the dot-com crash, I think.

Who said: “The market can remain irrational longer than you can remain solvent?” I have no interest in seeing if this is true whoever may have said it.

My (somewhat) rational question is not about timing the top of the market now, but rather about when (if) there is a correction. It is great to talk about going 100% long with higher beta strategies and the most beaten down value stocks at the bottom of the market but where does the money to do that come from? It is kind of like that conservation of matter (mass, energy or capital) thing I learned in physics. It cannot come from all of the capital you lost in the downturn. Maybe you take on leverage but even then you have to have some some capital to leverage up. That is if my understanding of physics (and there being no free-lunch) can be extended in the field of finance.

Along those lines I get the impression that you have some diversity in your portfolio. To the extent that this is true maybe diversity is not always a timing issue for you? No need to reply to that as I will probably continue to use diversity in my portfolio not matter what your reply is. I don’t want you to share every detail of your portfolio. You probably shouldn’t let me make this a debate about your portfolio in this forum.

Speaking for myself, I do think one can diversify in ways that make timing not much of an issue. And if one does decide to use some timing it does not have to be all-in bets. You don’t have to be a hero.

Anyway, I appreciate the discussion and my apologies if I overstated my belief in market timing. I guess it is true that I will be looking to move some assets at some point in a market decline. That does constitute market timing. But it is also true that I am not predicting when any downward correction (or further downward correction) might occur.

Best,

Jim

Jim/Scott,

Bitcoin just fell below the week-end low and its correlation with U.S. stocks reaches all-time high thus dragging down all US major stock indices right now.

Regards
James


James,

Very interesting. I am 100% sure that there is a strong correlation. Is that because of the need to deleverage–some of that deleveraging occurring in equities? Something else?

We have seen before in 2008 where a sector that should have nothing to do with another gets correlated because of deleveraging. Not that I am sure that this is happening now.

Thank you.

Best,

Jim

Jim,

Both the S&P 500 and Nasdaq futures are recovering a little bit. I am not sure if the current selling in the futures market in the premarket is due to deleveraging.

If it is massive deleveraging, futures should be down at least 1-2% in premarket given the 12% drop which is happening right now in Bitcoin since Fri close.

As you can see in the image below, Bitcoin has fallen more than 50% from ATH and is now testing the -54% from ATH which happened in July. (around 30,000-33,000 level). If the 30,000-33,000 level breaches, it is likely heading for the -74% drawdown from ATH (20,000-25,000 level). This will triggers massive deleveraging and liquidation due to stop loss orders and margin calls for both crypto and stocks.

Reminder that the current macro-induced downturns have more structural similarities to March 2020 than Dec 2018 (which was a crypto downturn during a very risk-on environment).

Regards
James


James, thank you for that in-depth analysis–Jim

I’m not here to defend Graham, but there are components of the QQQ that are over-priced relative to their median PE and Price/Sales ratios. Six companies make up half of the QQQ market capitalization; AAPL NVDA, TSLA, AMZN, GOOGL and MSFT. The first three are still very expensive. I expect QQQ to find some footing soon. Market capitulation happens after the “Generals” are shot.


It was the financial commentator Gary Shilling.

If the Russell 2000 drops another half percent, it’ll be a bear market for small caps rather than a correction.

“The markets can remain irrational longer than you can remain solvent.” - John Maynard Keynes. No?

What I am considering is that there are a lot more retail market participants that joined the “party” in the coming years. “Stocks only go up” kind of people. SP 500 / Nasdaq 100 / FANGS / Bitcoin returns over the past years are not normal, but many new investors traders think they are.
I think there will be much more panic selling on risk assets, which will be further fueled by the geopolitical issues (Russia invading Ukraine?), the FED tightening, overvaluation, etc.
But then again, who knows…

No, that’s most likely a misattribution. See The Market Can Remain Irrational Longer Than You Can Remain Solvent – Quote Investigator®

Ah, thank you! Especially surprising since I’m a big fan of Shilling’s newsletter.

Jim/Scott,

It’s not even noon yet on Wall Street but the S&P 500 has tumbled 3%.

S&P 500 has fallen 10% from JAN. 3 Peak to enter correction.

The Russell 2000 is now in a media-defined bear market.

In addition, there are major options expirations on Thursday so if the markets don’t like what Jerome Powell has prepared for us, there should be further downward pressure on Thursday as well.

Regards
James


James,

I agree that is possible. Also, I have not researched this well but I have heard that some of the largest daily gains are during large drawdowns. Subjectively this seems to be true.

So no matter what happens long-term (or medium-term), I expect to see large swings in the market. And maybe I will be right (about whatever I convince myself I predicted)…until I’m not.

Best,

Jim

Jim,

It seems that you are completely right and predict that there will be large swings in the market.

Bitcoin is up 7% from its low and markets are bouncing.

Regards
James

EDIT:
Bloomberg
Markets
11m ago
NEW: U.S. stocks staged a late rally to finish the day in positive territory after falling as much as 4%

  • Retail, energy and industrial companies lead gains in equities
  • The dollar climbs, while 10-year Treasuries are little changed

A stock selloff that at one point rivaled any of the last two years was all but wiped out as dip buyers emerged by Monday’s close, the latest breathtaking reversal in markets rattled by geopolitical tensions and the Federal Reserve’s campaign against inflation.

Retail, industrial and energy companies led a rebound in the S&P 500 into the close after the gauge tumbled as much as 4% earlier in the day. The dollar gained, while 10-year Treasuries were little changed.

At today’s low, the Dow was down 3.24%

Recovering from an intraday loss of more than 3.24% six times,

  • The 1987 crash
  • The worst of the GFC in 2008
  • The Pandemic low of March 2020
  • Today

First time the Dow has reversed a 1,000+ point drop to close higher on the day.

Wild volatility like this tends to happen in a bear market, not a bull market.

One example of this kind of trading before today was Oct 2008.

That was the beginning of the market falling apart, it would go on to decline another 28% until March 2009.


DJIA down more than 3.24% intraday.png

James,

Thank you. The above is very helpful.

Jim,

I’m a fan of a stepwise increase or decrease in portfolio risk in order to minimize ones timing risk, with today’s reversal an excellent example of such. Market timing is ok if it can outperform an appropriate benchmark (i.e. 60/40 portfolio if it shifts between stocks & bonds). We would all like a perfect hedge, one that keeps up with the SP 500 during the upside, and has minimal draw down on the downside. This doesn’t exist (at least for me) and seeking it (again for me) likely will result in data mining in simulations and a suboptimal out of sample result.

Scott

Hi Scott,

You don’t have to stick with timing returns. And how are you monitoring and controlling “risk?” What is the metric for risk that you follow regularly to update your portfolio’s risk profile?

Also, I get the idea that, for you, a portfolio should be measured against a 60/40 stock/bond portfolio. With equities coming from SPY or perhaps VTI.

Here is a backtest–sticking with equities in the SP 500 and bonds–that uses the volatility of the SPDR ETFs and TLT over the last 3 months to equally weight the risk of each asset.

The benefits (with regard to risk) come not just from increasing the weigh of TLT during volatile times but also the healthcare (XLV), consumer staples (XLP), and utility (XLU) sectors.

You are never completely out of any sector with this strategy. The main benefit is the reduced drawdown compared to a 60/40 portfolio.

If one is going to worry about risk they can consider monitoring the risk and adjusting the risk profile: Time the volatility.

BTW, among the factors of returns, correlation and volatility there is almost universal agreement that volatility does have persistence (and the most persistence). With questions about the other two. Simply put, professional traders accept that volatility persists.

As proof, volatility (and the present price) is the only factor in the widely used Black-Scholes formula is it not? There are no assumptions about price trends continuing (or mean-reverting) for this options formula. They are trading against people who have opinions about pricing trends. And yet, options traders remain in business.

Professional traders–on both sides of the options trade–use the Black-Scholes formula. They use volatility.

It remains to be seen whether SPY continues to (slightly) outperform going forward or whether SPY reverts to its mean. But also, I do not think this would underperform SPY if you could leverage TLT slightly so that TLT has the same return as equities. It would still have less risk with this slight leverage of TLT.

Just an idea for one possible way to keep your mind focused while others around you lose theirs.

Jim


Jim,
You can also look at my latest ETF model that makes use of 6 good strategies previously developed over several years.
What is of interest here is that it is not a binary model between risk-on and risk-off, but also generates risk-neutral signals.

It does not use any leveraged ETFs and the simulation shows an annualized return of 34%. This is the highest return I have seen from any ETF model so far.

https://imarketsignals.com/2022/the-im-multi-model-market-timer-not-your-daddys-old-moving-average-crossover-system/

Thank you Georg.