Some measures of the ongoing correction

Looking at some measures of the ongoing correction

S&P 500 correction now 5.5%, biggest since November 2020.

NASDAQ Composite correction is now 10.7%, the largest since September 2020.

The Russell 2000 correction is now 15.6%, easily the largest correction since the March 23, 2020, pandemic/lockdown lows.

Regards
James


James,

Thank you. I’m certainly noticing that in a port that is following the Russell 2000 benchmark closely.

These people (attachment) are motivated to get you to buy bonds (or a fund that holds a lot of bonds). My apologies if this link gets any member to do that too soon. But here is a somewhat in depth–albeit biased–look at any asset bubbles that may exist.

To be clear, my record of discretionary trading is unblemished. Even the mention of bubbles by me is a clear signal that you are safe to go all-in, 100%-long in the market. And I don’t get the general impression that the PDF is super-negative–if negative at all for the short-term.

Best,

Jim


is-the-air-coming-out-of-the-bubbles-and-is-that-healthy-or-ominous.pdf (752 KB)

Cryptocurrencies sank on Friday morning, taking Bitcoin down 7% to 39,000 the lowest level in more than five months as risk aversion again swept across global markets.

Consider it a warning about stocks later today.

Regards
James


Thank you James

Jim/Scott,

S&P 500 close almost 30 points below the 200d Moving Average.

It has been over 400 trading days that S&P 500 stays above the 200d Moving Average, the longest streak in 8 years.

I think S&P 500 is at an inflection point, right here. If the trend is still up; the decline has to stop next week. If not, the next break marks a full-blown bear market.

If this is a new bear market, this is about to get really ugly and a full-blown equity bear (an additional 10%-20%) is underway.

The Fed is about to unleash tightening to stop inflation, and that may means sacrificing the stock market. Personally, I think the Fed is going to get really aggressive (enormous political pressure).

So instead of siding with the bears, let the market tell us what’s coming next now that we are at this inflection point.

Regards
James

Edit : Crypto has fallen further after the market Fri close and bitcoin is trading below 36,000, we may have passed the inflection point if the equity market follows through on Mon.


James,

Thank you. Nice graphics and nice analysis.

Best,

Jim

Thank you James,

it’s not clear to me if crypto is leading stocks or stocks are leading crypto but their correlation is notable.

Scott

Being in the stock market since the late 1990s, the big reset in stocks has still to play out for this cycle. Netflix’s plunge of over 20% yesterday was a good taster.
Keep your dollars ready for some good buying opportunities over the next months!

Hi Florian,

Personally, I think that is good advice. Full stop.

i would be interested in where your “dollars” for buying equities at a discount are now. Are they in cash? Or will you switch money out of bonds, gold or bitcoin perhaps? Maybe even REITs or alternative investments?

I am not sure how much you wish to share. But in my opinion, it can get to a point that diversification becomes less meaningful as the market declines. For one thing, if the the market were to keep declining at the same rate society will be ending soon anyway. Not a joke but rather a proof that it cannot actually continue at that rate.

But also assets get correlated etc.

So that is all to say I agree and I am actually more interested in how you might diversify in an overextended market (before a market decline). I take what you have said already as a “given.” Something that has already been proven in the world of professional finance.

Thank you for any response you feel comfortable with sharing.

Best,

Jim

Don’t be quick to jump back in. During the dot com crash, the Nasdaq went from ~5000 to ~1200. And technology tends to lead the market. i.e. the other shoe hasn’t dropped yet.

Jim/Scott,

Investors turned to equity put options to hedge against a further slide in US stocks, with a record number of put contracts purchased on Friday (more than 32 million)

As I noted earlier, crypto is a good indicator of what is coming in traditional finance markets. Crypto is basically a 24/7 VIX.

If this weekend crypto rout continues, watch how the market will react in about 36 hours when the futures market is back online.

See the screenshot below, as of this writing, Crypto is down another 10% since Friday’s NYSE Close.

Bitcoin has fallen 50% from the all-time high of 69,000 made in Nov (just 2 months ago).

Regards
James


Change in Crypto since Friday.png

You can also read my Jan-1 Seeking Alpha post:
Current Overvaluation Suggests Zero Real Returns By 2028 - Update December 2021
https://seekingalpha.com/article/4477497-current-overvaluation-suggests-zero-real-returns-by-2028

The current level of the S&P-real is 85% above the long-term trend line. A reversal to the mean trend would entail a 46% decline, possibly over a short period.

Friends beware.

Yes every podcast I listen to now says the same thing. It’s obviously a correction how long and how deep? 2018 it was over 30% for Tech? In 2018 I started shorting heavily in May got back in long December. I made a killing. I’m obviously joking. I got killed in 2018. Now 2022 questions:

Do I short or go to cash?
Do I believe everyone who says commodities will rise?
Markets start rising do I get back in and pull my shorts?
Do I hold on?
Is my strategy working or just correcting? (Corrections can be a year long to a strategy)

It’s so hard to manage a correction.

Happy trading everyone.

Cheers,
MV

And finally can I actually prove I made money in 2022?

And finally can I actually prove I made money in 2022?

All,

In my limited experience people at P123 are not that bad at using their discretion to move into stocks near the bottom. They know there will be a bottom and are less fearful than the average investor. Nobody gets it perfect. Risks can be asymmetric and the average P123 user gets it at a gut level.

The harder question is what to do now–at a possible top in the market–to keep some “dry powder” at hand.

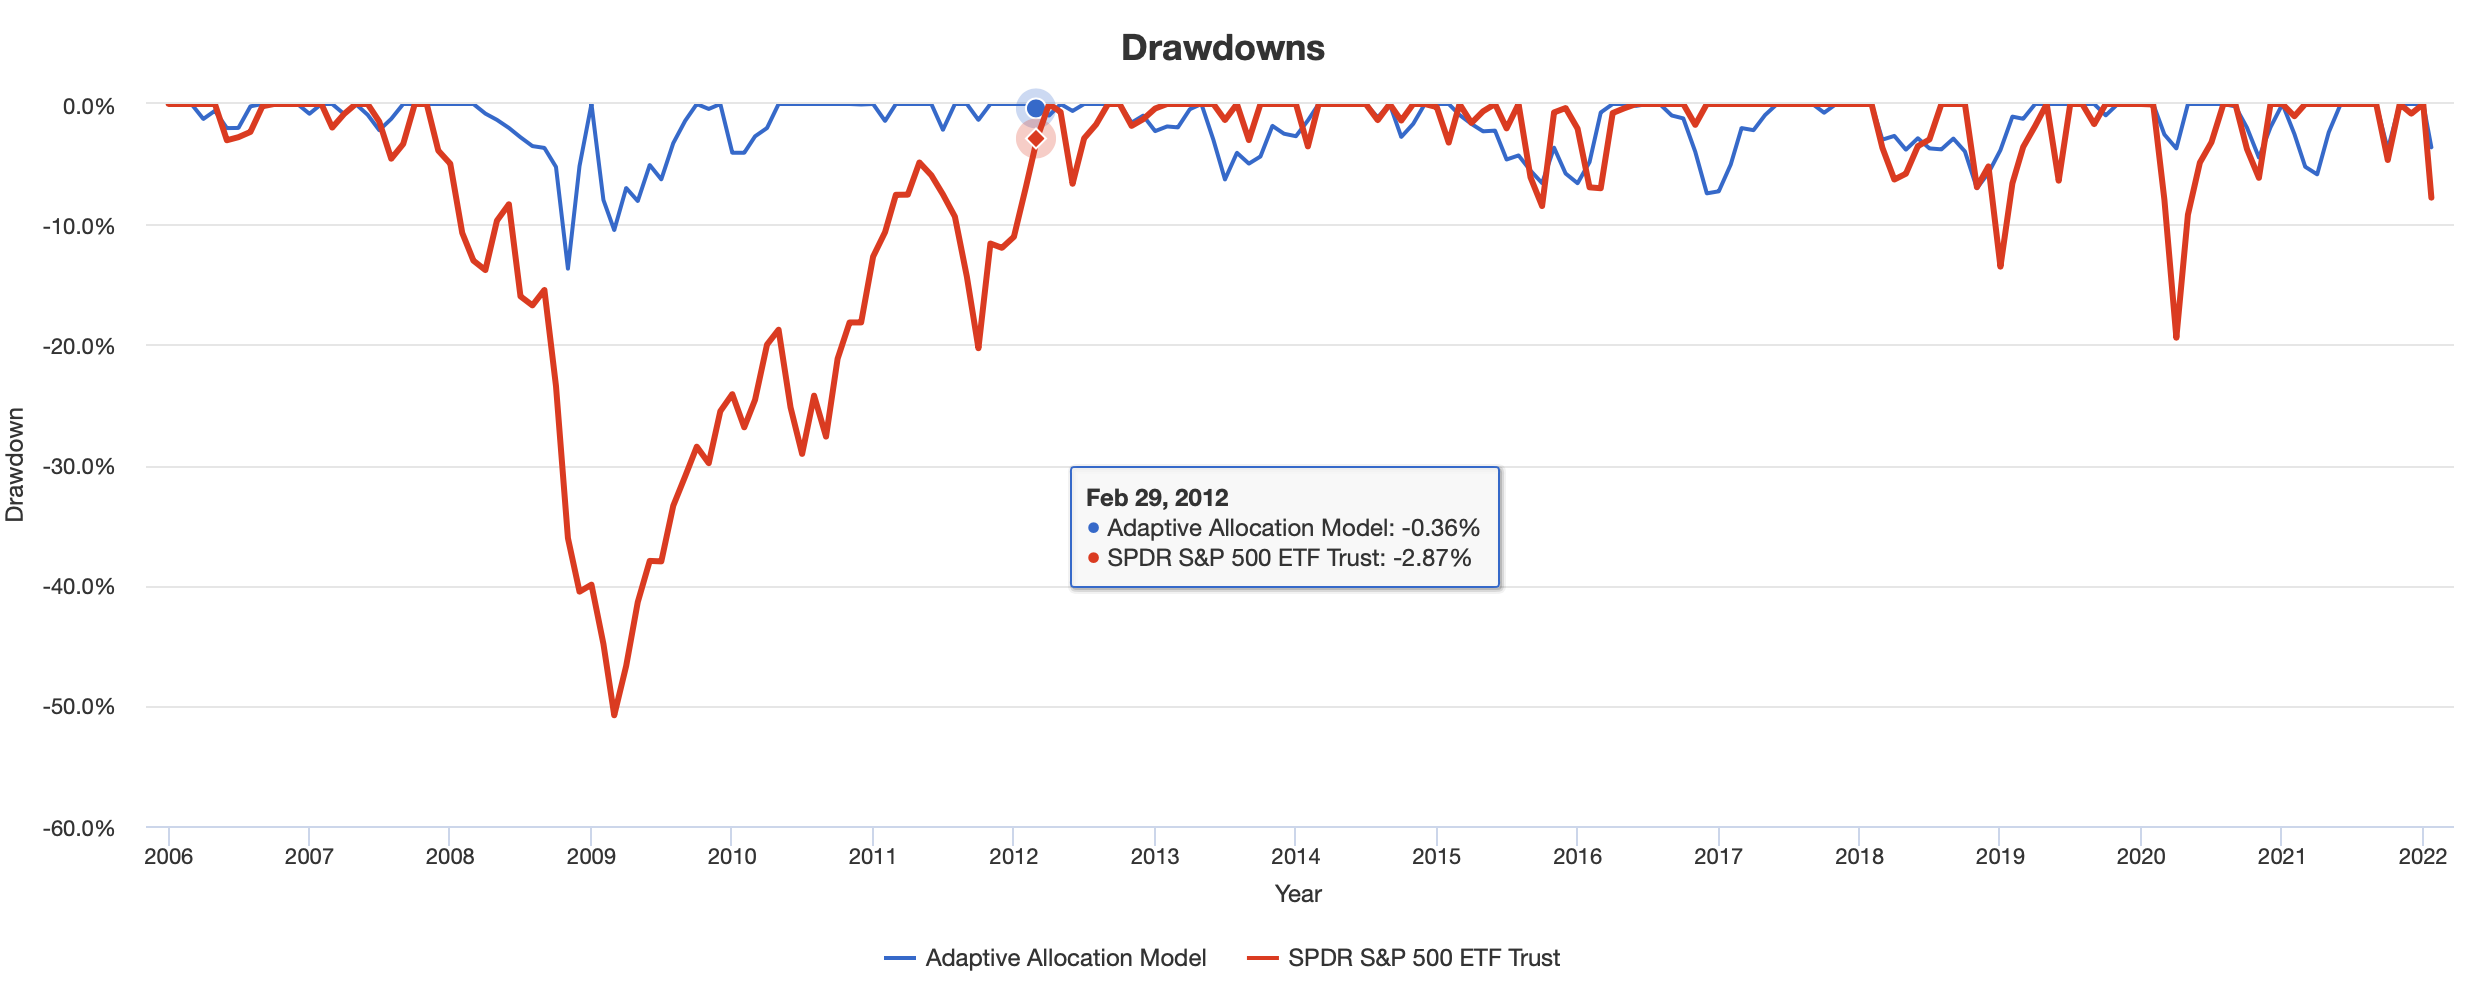
Risk parity (using volatility for the last 3 months) of SPY, TLT and GLD rebalanced monthly will probably save you from a severe drawdown (image). You could keep using your ports in place of SPY and sell TLT and GLD near the bottom–going to 100% ports when you think it is the right time. You could get more fancy at the risk of ignoring Occam’s Razor. But you could probably do a better than just SPY (or your ports), TLT and GLD.

One could also use some leverage, minimizing the underperformance of the diversified portfolio. It would increase the risk of the diversified portfolio but there could be more dry power–to switch into your ports at the bottom–if you used leverage as part of a long-term strategy.

Buying at the next bottom could be a once-in-a-lifetime opportunity. Or not (as I am not good at predicting).

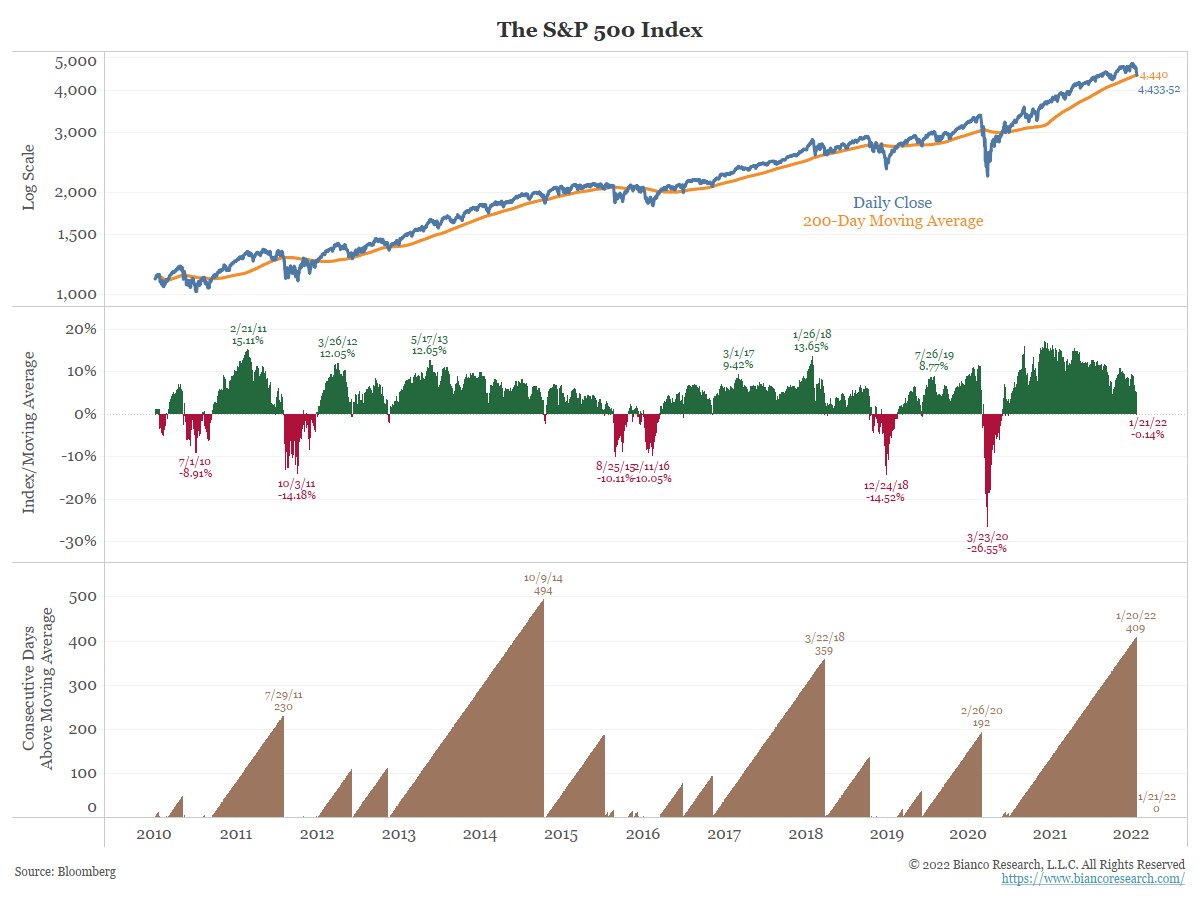
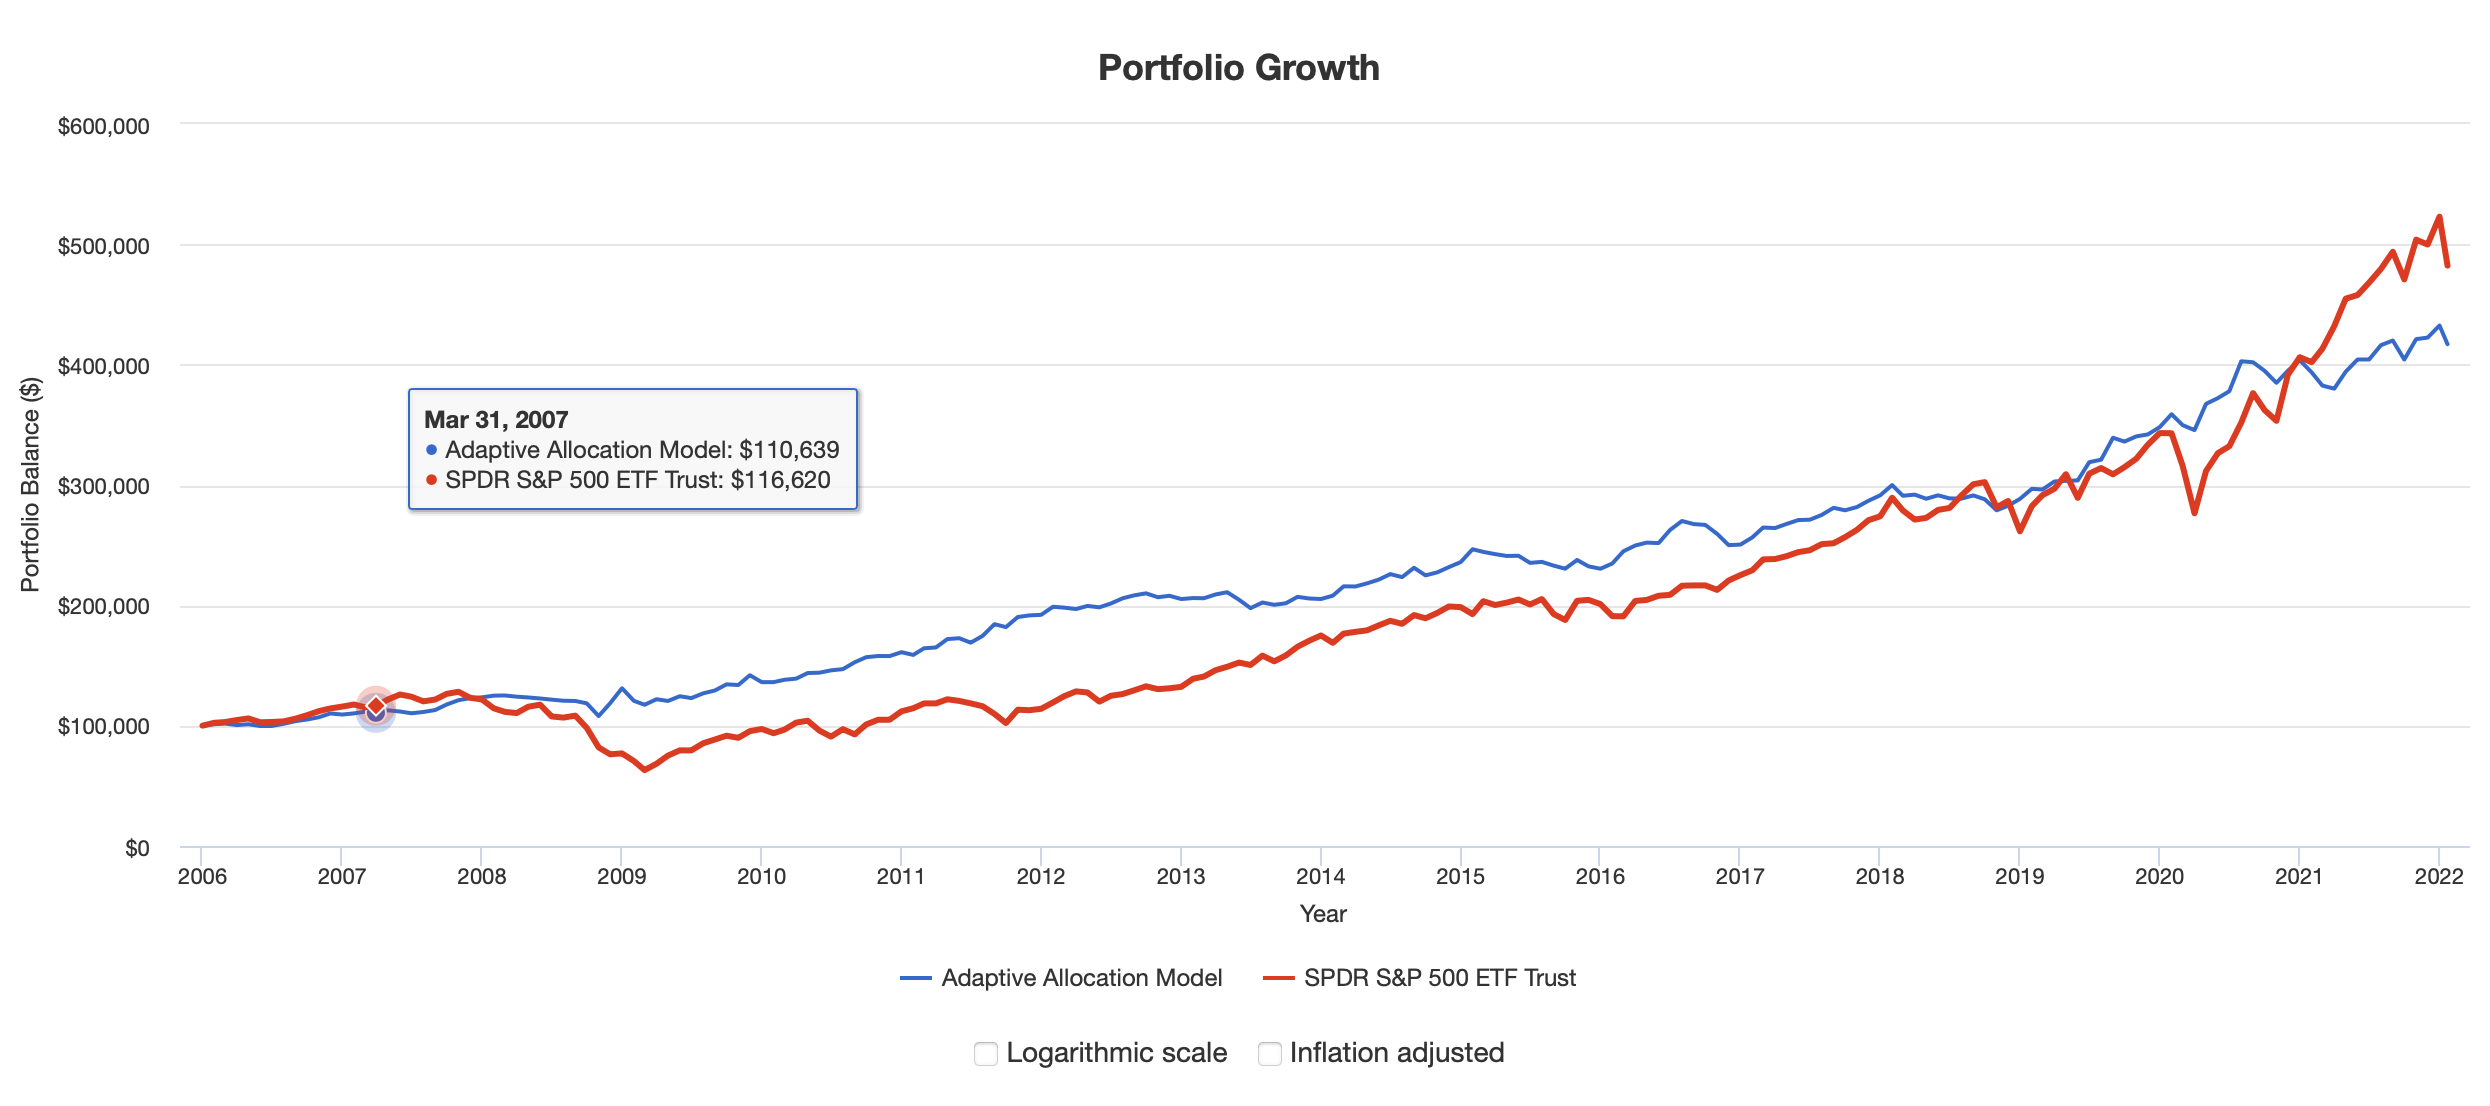
As you can see you would have underperformed recently by diversifying (without leverage) but it is unclear what will happen going forward if you started using something like this today. And the real question is will SPY mean-revert anytime soon? I think Georg is right that it will do this. The only question is when.

But when it does, you might have some money to switch into your ports as Florian suggests above. Or not. Staying 100% long in a port if you are sure it has alpha and that you will not be shaken out near the bottom–especially if you are young–is fine. But you should probably be sure it will have alpha going forward.

For me it is a matter of survival instinct. My wife would kill me while I slept if a capitulated after a 50% drawdown with our retirement funds. I want to live.

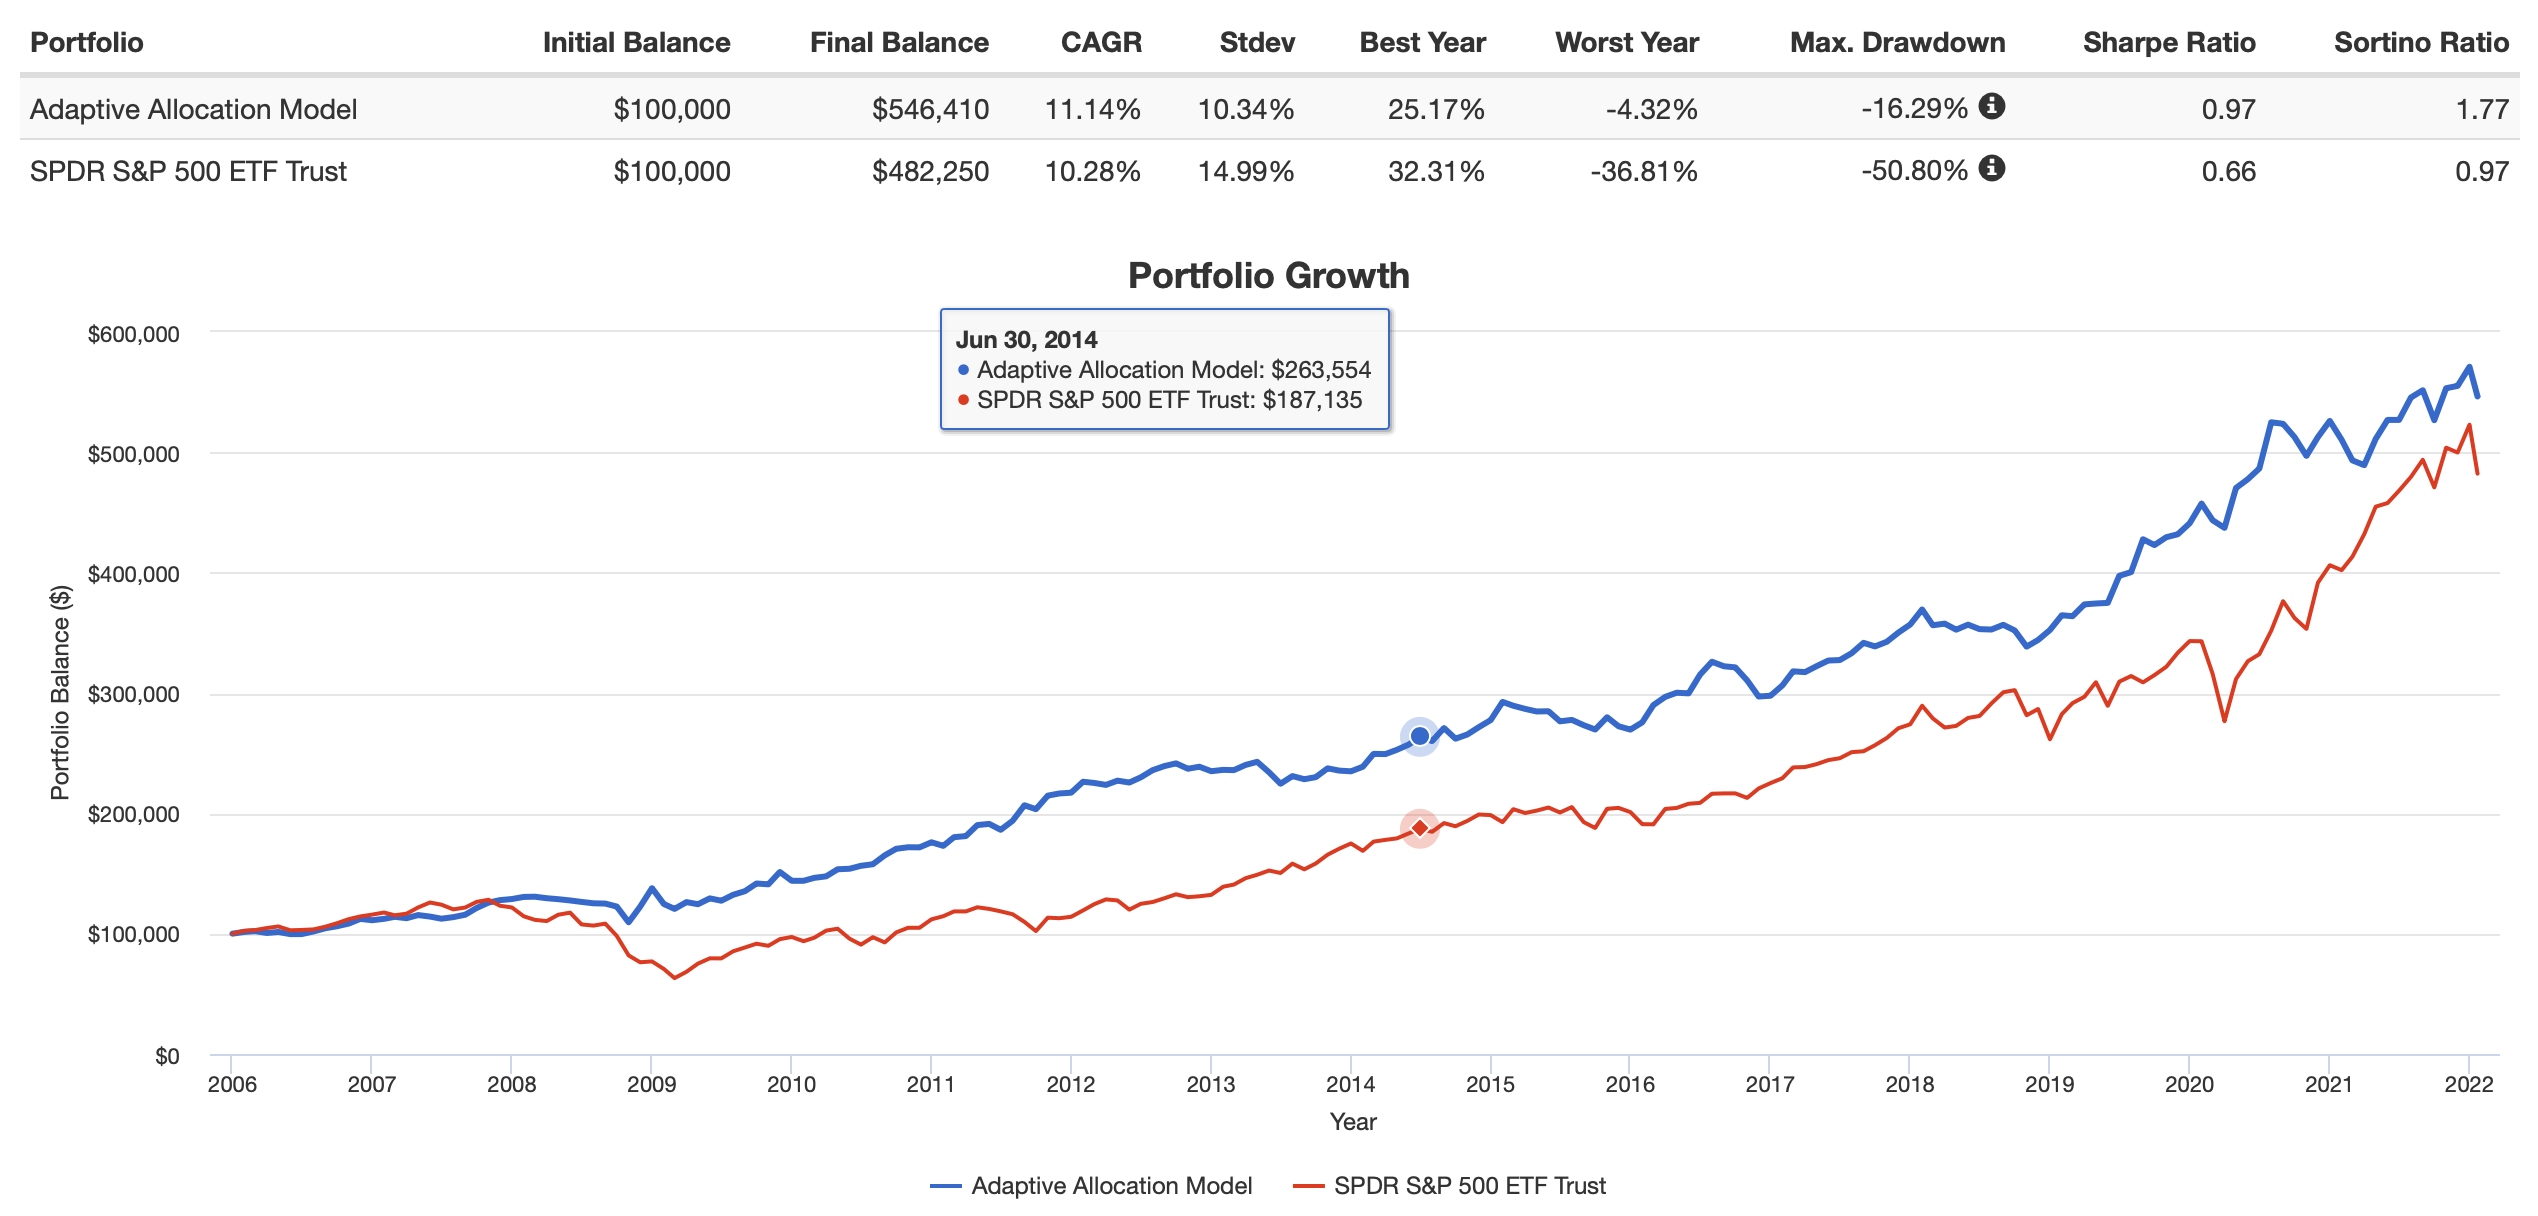
Edit: BTW, here is the same strategy with 20% leverage. You would not necessarily have to even try to time it. I think this may be Mark’s point (simplified in my discussion). I think he is right. But also, the risk can get pretty asymmetric as Florian, Steve and Georg correctly suggest above. James (ustonapc) has an advance way of managing the asymmetric risk that I do not fully understand at this point. I do think some of it could be implemented in a SEP-IRA and is worth learning, I am just not there yet.

They all make great points, IMHO. No coincidence that all are professionally trained in mathematical specialties and/or finance (without exception).

A Black-Litterman model would be a formalized method to merge discretionarily ideas with a mathematical algorithm. Probably a BS, hand-waving method, IMHO. But it could be useful to prevent someone from making their bets (on the market’s direction) too large based on discretion alone. None of this is a new idea originating from me and I can say with certainty that I do not have it exactly right. There can be no doubt, however, that this short post is an exhaustive discussion of the subject and is enough to make an informed decision about your finances :slight_smile:

Best,

Jim


I agree that inflation is unexpected, and that the Fed will tighten quicker than anticipated, and that PE is historically high, but are there other fundamental considerations that signal that there will be a huge correction?

I looked at the following models briefly: (that uses 6-9 economic indicators)

https://allocatesmartly.com/philosophical-economics-growth-trend-timing-redux/

https://allocatesmartly.com/paul-novells-flagship-strategy-spy-comp/

as well as on various historical models in:

https://www.portfolio123.com/app/opener/MKTIND?cat=-11&pub=1

None of them, besides the techinal signal of S&P 500 cross beyond it’s 10-month SMA, has signaled a big correction

Hi Marchus,

While I think timing is always a problem…

I think Georg’s analysis, the Shiller PE ratio and “Buffett’s favorite” indicator is enough for me to want to diversify: United States stock market valuation to GDP.

And there has actually been a correction already, BTW. I was not a big fan of the correction in IWM. I assume your models predicted that.

To be clear, I do not believe in some of the extreme market-timing some advocate. Like ever going short or moving to 100% cash based on moving averages as an example. Or any cash in a portfolio for that matter.

I admit to not looking at the overfitted models you present but you could be 100% right regardless of what any models say. You could be absolutely 100% right. So what is your recommendation (as specific as you like) at this time so we can come back to this post in the future?

Mine is to diversify and not worry so much about timing or predicting which model or expert is right in the end.

Best,

Jim

James,

Thank you for the excellent analysis.

Jim & others,

I’m not sure that this correction makes sense to me and without fully understanding it I’m not sure how one can predict the outcome with any degree of certainty. It started due to the interest rate increases or fed tightening. So market participants sell stocks to buy bonds to decrease interest rates from going up? Statistically stocks usually do well during the early phases of tightening and bonds don’t. Also, I’ve read many papers on stock market valuation not being a good/ statistically significant timing indicator but if this is wrong then please educate me ?

Whycliffes,

I briefly looked at your links but there isn’t enough information there to understand the composition of the models.

Scott

The bottom line is this. There is a lot that can be talked about without getting into some of the ridiculously overfitted timing strategies.

That people use those strategies as a strawman argument says more about the person making the argument than about the profession of finance.

Not that anyone above is doing that but it is an argument that has been made.

You do not have to be a hero calling the market perfectly, shorting SPY or going 100% into cash at the top and buying at the bottom to benefit from and control volatility. That can only rarely be done except in a backtest.

The weird thing is that members and staff alike have all talked about correlation of ports being part of what they look at when selecting ports (and the models themselves). Members and staff have talked about ETFs to control risk. Members and staff have talked about the problem they have had when they took on too much margin at times. BTW, I am all for leverage, I use it. For some reason how correlated my assets are (and their volatility) has something to do with now much leverage I want to take on. Radical and totally my idea, I know. Maybe someone will come out with a paper on that (maybe it will win a Nobel Prize).

Some talk about these things (like correlation or margin) whenever they want in whatever context they want. But feel free to say “It is just timing” when others try to broaden the discussion on these topics. Implying they somehow, magically know how much margin to take on. What’s up with that?

Just don’t ask them how much of a drawdown they think they might get going forward. Or even how much they consider reasonable. They may not know and you are not supposed to ask even if they are professionals recommending that strategy to you.

BTW, there are professionals that will have that discussion with you. Many of the newer members who do not have any out-of-sample experience with their models should talk to one regarding at least a portion of their portfolio.