Marc, you have been sharp with others, as well as Chris. Please be more constructive going forward.
Bill
Marc, you have been sharp with others, as well as Chris. Please be more constructive going forward.
Bill
We have four recession indicators at iMarketSignals.com, none of them are signaling recession. I also follow Bob Dieli’s work at nospinforecast.com who in his end of September report had this comment: “The point here is that both the statistical and anecdotal evidence currently in hand do not suggest an imminent change in the phase of the business cycle.”
However, there was a “Death Cross” of the S&P500 near the end of August. In this article The S&P 500 Death Cross - Time To Panic? | Seeking Alpha I analyzed performance of 32 DCs since 1950. My further research suggests the following:
Following these rules will ensure that one does not suffer significant losses after a DC.
I’ve been following Bob Dieli’s work for years and have referenced him many times over the years on this site so I have great respect for him and his methods personally and professionally. However, the Agg Spread is designed to identify business cycle peaks in a traditional inflationary period. The Agg Spread is reliant on a Fed Funds rate above 0% for the financial component of the model. But due to the Fed we’re not capable of generating an inverted yield curve.
The Agg Spread was designed for a post 1950 inflationary environment and based on its structure could be very inaccurate during periods of deflation such as we are in now. In my opinion there is a reason its starting date is post WW II because the Agg Spread would have only been marginally effective in the 1930s and would have entirely missed the 1937 recession. I fully realize inflation has probably bottomed in this cycle but how do we get an inverted yield curve with 0% rates?
I would strongly suggest readers take a look at Recessionalert.com RA’s USMLI may be the more reliable forecasting tool in this cycle. Dwayne just published USMLI shows a very ominous downward trajectory for his composite of LEI’s. Its not signaling a recession yet but its only a matter of time which would occur some time in 2016. Investors are not going to wait until the models actually signal recession. IMO Human nature being what it is investors will anticipate the trajectory and front run the signals, which makes quant based recession signals late relative to the equity and bond markets. And as Ray Dalio mentioned this opens the door for QE4.
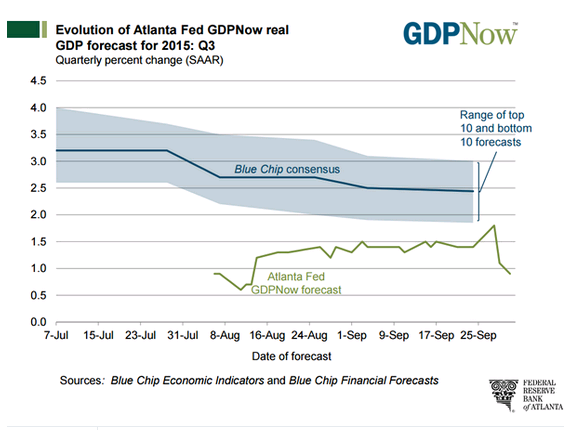
Just when you think there’s hope the Atlanta Fed GDP tracker takes it away
The success of trend following systems and managers is empirical proof that market timing can work. So I have to agree with Christopher (IntelligentValue) on this one. Marc if you are looking for a market timing system that can call every high and every low, then you will probably continue to be disappointed. However, if you are looking for ways to mimimize risk and improve portfolio alpha then market timing can be useful.
Geeeeee, that threat got a bit hot here, hey, I like this board and the General tone of it, so P123, please support the good tone of the board
into the future, so a moderate tone and a the word Moderation (which I believe should be the Job of us all but also the Job of p123) Comes
from the word moderate (I might be wrong, but you get what I mean).
The Thing about trading, investing and buiding models is, that I think I got it all, just to learn, that I did not got it all and still learn (that happens at least every 6 Months).
But if I realize, that I did not got it, I like to be said in a friendly way, that I did not got it, even (and that is the case most of the time),
if I was very opinionated before when I thought that I got it. The beeing opininated Comes from the admiration of the trading
and investing stuff…
Even if I know (or think I know) that somebody is wrong, I still would like to think of my self, that I am gentle enough to
tell the one who I Think is wrong in a friendly way.
With all due respect to the Monster know how p123 has, it might be a good idea, to take responsobilty for a moderation of a moderative tone
of this board.
So know as it is out, you can kill me.
If you do not kill me know, I am glad, because this is the best board I know and I like the working togehter here very much and
I hope I always provide in a good and friendly way. I owe that board very much, even hard dollars
I earn with p123. So I thank you all for that and also for a lot of head ups, friendly support,
a lot of learning and sometimes just for killing some boring time…
Hey, lets stay together here!
Regards
Andreas
???
It’s exactly the opposite. I (and others) objected to the 100% claim. I think this is all getting too bizarre for me.
We gain much more by presenting ideas humbly and transparently, letting the deep talent of this board test, debate, refine and hopefully improve an insight that will benefit the community rather than one’s personal subscriber base.
If you want to see what I consider a rigorous exposition a market timing model effort: http://papers.ssrn.com/sol3/papers.cfm?abstract_id=2609814
They have put it to an investible, walk-forward test in the form of an ETF: HTUS
Fact sheet here: http://www.hulltacticalfunds.com
They are even posting their positioning: http://www.hullinvest.com/HI/
Another link to current positioning: http://www.hullinvest.com/HI/wp-content/uploads/2015/06/public_report.pdf
Here is an imperfect but interesting idea to stimulate ideas and discussion on stockcharts.com that I ripped off from a SeekingAlpha poster, a dshort poster, Konstantin, along with a couple of my parameter insights: http://schrts.co/5XDyjh (Those of you with memberships can look back further.)
The concept is that you first have to respect market momentum. However, earnings matter and GAAP EPS contain less of management’s BS and shareholders earning trend should be noted unless you want to pay infinite multiples. CCI over 36 months is about half the average cycle so if SPX is turning down on a volatility adjusted trend, that is worth noting. Finally, if the breadth of the top 100 companies in the S&P500 is narrowing then the index trend is fragile and 65 is a suggested parameter to monitor.
If you figure out something better, please post it for everyone on this board (though I wish members had a board separate from all those freeloading Guests!)
Good night, good luck, good trading.
I didn’t have time to read all through it – yet – but on looking at they data items they used, it seems worth studying. It’s completely consistent with what I’ve been sating about market timing; that an approach that succeeds going forward will most likely draw on economic data, which we have on p123 under Tools >> Macro. I don’t know that their approach can be replicated on p123 (if we’re missing data items and they’re available on FRED, we can get them), but at the very least, it seems like this paper should be able to inspire new ideas for those interested in pursuing timing.
The paper does use economic data and is very interesting!
The authors did not get rid of the 10 month moving average which showed a strong correlation with future returns in their paper.
Please allow the use of custom series in rankings. Please also allow rankings to ‘sum’ scores with user specified weights on eval statements. This will allow the rankings to be used as true ‘market score’ indicators. If variable exposure is then built, we can use these indicators to vary market exposure. I have built these systems in Python and they work well, and I’d love to be able to reproduce them here - as P123 is easier for me to use.
This thread has been very interesting. I too have a problem with “100% accuracy” and I understand why it triggered some emotion. Still, I appreciate the dialogue and the fact that some of our more experienced members raised concerns. I have a large % of my retirement portfolio invested in R2G (and my own) models and I feel the integrity of P123 is critical to its success. Thank you to all that have provided insight.
-Debbie
Tom,
What you describe is exactly what was done in the paper that Marc showed us, I think. I am getting interested in your idea!
Thank you for sharing the paper. I will be following this fund to see whether the 20 indicators that they discussed help them generate supranormal performance out of sample. They discussed how it is difficult to determine whether these indicators will perform out of sample due to data dredging (selection bias of their indicators) on p. 25. They also discussed how the maximum sharpe ratio that one can achieve with market timing if one has perfect information is 1.5 on p.26. This should be a ceiling for market timing with out of sample market timing using spy vs cash performing significantly worse.
Scott
P123 - This would be great!!! Please consider implementing this.
Read the Hull’s paper.
Why don’t they show correlation coefficient of their dynamic screening model to the future returns over time. Or at least the average for the tested period.
According to their graph on page 21 it is about 0.5 approx (what is the future time frame on this graph 6M or 12M?).
They claim sharpe is about 0.85 but it can depend on long/short weights limits as well. The real edge is the correlation coefficient of their composite function of screened variables to 6M or 12M future market returns (the 1Month is totally unpredictable).
I made almost the same correlation of my composite normalised index to 12M S&P returns (0.47 pearson correlation unoptimzed at all, equal weights for factors) based solely on three independent subindexes from recalert.com. I used maximum average correlation indexes for the period from 1999 to 2014 (Leading probability, Headwind index, USLLGI). Long/short SPY gives two times increase in sharpe to the SPY long only from approx 0.28 to 0.65 and about 20% drawdown. And that sharpe increase is mainly due to crisis drawdown avoidance.
Declared sharpe of 0.85 doesn’t mean as I already mentioned better forecasting power than my static index but if even so it means
that their dynamic variable allocation system across even 20 factors (I used three but it consists many subfactors in each, see recessionalert.com)
and 1.5 - 0.5 long/short allocation based on it gives only 0.2 increase in sharpe.
Also there is a big problem with availability and timeliness of such data as Hull mentioned in his paper. recalert.com provide it on weekly basis nominally, but some indexes updated monthly, vulnerable to revisions etc etc. So it is really not easy stuff.
Anyaway Hull ETF factor report will be a supplemental source of info for the market timing decisions.
I attached the excel file with discussed model (assumed zero transaction costs for SPY for simplicity, Hull mentioned on page 22 that he uses 2cents! per SPY share priced at 200$ - 0.01% not much:)). It is not formatted well cause it is the first draft I did several months ago. (I can’t show the final draft cause it consists some confidential info)
But I hope you can find what I was writing about in it (if not then ask me)
Regards, Yury
P.S. The real thing is that the market predicts factors and indexes better than vice versa:) That’s why I’m not relying heavily on market timing in position construction and ask clean model results from designers to see pure alpha picking strategy without beta timing.
Market timing model.xlsx (4.06 MB)
So, some of you have amazing math skills: more than one person above so I won’t mention names.
Denny has amazing math skills but he can also make the hard simple at times. He mentions using multiple ports with different timing systems.
So, I am wondering how close one could get to the ideal multifactorial regression analysis by doing the following:
Run 5 sims with the 5 best factors (greatest correlation) in Hull an Qaio’s paper that are available at P123. Maybe set a threshold that puts you 100% long or 100% cash in any given sim for any single factor. If it were me, I would probably optimize the threshold value in each sim. I would then put the 5 sims into a book and probably optimize the weights, or money allocated, to each sim. The book would have a variable amount in SPY or cash depending on the market conditions (state of your 5 variables). Convert the sims to ports and make it an R2G book (when possible).
My guess is that this would closely approximate the results obtained in the paper (80% of the good with 5% of the work). If this is useful I’m not afraid that anyone (except Tom) is going to affect the liquidity of my SPY purchases.
Perhaps, one could even do better than Hull and Qaio if he tried different ETFs with the different factors (the sims in the book). There is no reason to think that a correlation might not be higher for one of the factors with IWM or a value ETF or even Gold.
I would be very interested what people with high math skills thinks of this approximation to a multifactorial regression analysis model.
BTW, the process I mentioned above would surely be curve-fitting/optimization. But would it be more or less optimized than what Hull and Qaio have done: I’m asking. Also would anyone not optimize considering the marked difference in time-frames and correlations in Hull and Qaio’s paper? In other words, who would equally weight the ports in the book? Who would not find an optimal threshold for each variable in the ports?
Yury -
The market predicting factors and indexes better than vice versa is an artificial limitation you are adding. This should not be a generic statement because it is not true. It is another example of “one dimensional thinking”.
As for all the problems you have pointed out with Hull’s paper, lets keep in mind he sold his original company to Goldman Sachs for $400 million 20 years ago. So we can assume that he is probably good at what he does. And, more importantly, he is putting his money where his mouth is, with the ETF HTUS. If his strategy is not good, then you will see him fall flat on his face. If you have a strategy then turn it into an R2G… lead by example.
Steve
I would like to second Steve’s point regarding that the referenced paper was written by a team with significant practical experience and academic knowledge in contrast to most papers that are written by academics that have “no skin in the game” or real world trading/investing experience.
Scott
It is not an artificial statement and it is true. It can be proved easily. If my composite market timing index has 0.47 correlation to future 12M SPY returns, past 12M SPY returns have 0.66 correlation to the same index. And it is true for every other market timing variables. It means that the market predicts better than vice versa! It is strange that you deny it:)
About Hull. Yes, I agree, probably he is good at what he does, we’ll see. My market timing model is not unique, it is public and almost the same what was done before everywhere.
I don’t need to put it in R2G cause it shows the same crisis avoidance as everybody made in P123. I don’t rely much on it and use it not in a model as hedging rules but as allocation rule between different models and asset classes in a book.
Regards.