Yury - this simply means that your market timing variables are reactive, not proactive. Reactive variables are good for controlling risk and for use as filters, not so good for market timing. The trick is to find factors (or variables) that aren’t a reaction to market activity. They do exist but you may not be aware of them.
One of the strongest correlations in Hull’s paper was CPI and he proposed a mechanism from the original paper. But it seems obvious to me that the CPI will be highly predictive of what the Fed does with interest rates in the future. Correlation never proves causation so I’m just guessing.
Whatever the reason I found it interesting and easy to test/implement at P123.
Reactive proactive, what a bullshit. My index based on LEADING economy indicators provided by recessionalert.com. It means that they should predict market movements. Any factors and variables are prone to the same relationship, check it yourself if you are not believe me.
Yury - the only explanation for the correlations you mention are trend following. Perhaps you should explore other possibilities than recessionalert.com.
Can we learn a little about over-fitting from the Hull paper? The “kitchen sink” method did not do as well as the correlation screening method but why?
I guess I am pretty sure that including factors with low correlation like Oil Price was one problem with the “kitchen Sink” method but what else, if anything? Was it:
the number of factors?
The consistency of the factors? What about CPI and MA which had a high correlation but were inconsistent. Are there rational fundamental reasons to include each under some market conditions and not others? Using their correlation screening methods we would use CPI but not MA at this point.
Of those that had a high and consistent correlation I would like to be able to calculate CAY and VRP which I can’t right now. Does anyone know an easy way to get those?
I’m beginning to think that at P123 we will have to stick with a few variables with high and consistent correlations to future returns. Preferably ones that are not highly correlated to each other. Right now, I can do one from the paper: PE or one of the ones highly correlated to it like DP or CAPE. Maybe I could add CPI since it seems to be working for now. Maybe add MA thinking it might have a stronger correlation in the future.
There is one more market timing factor nobody mentioned.
As you can check (from my excel file for example) SPY has negative auto-correlation (SPY value has negative correlation to future returns).
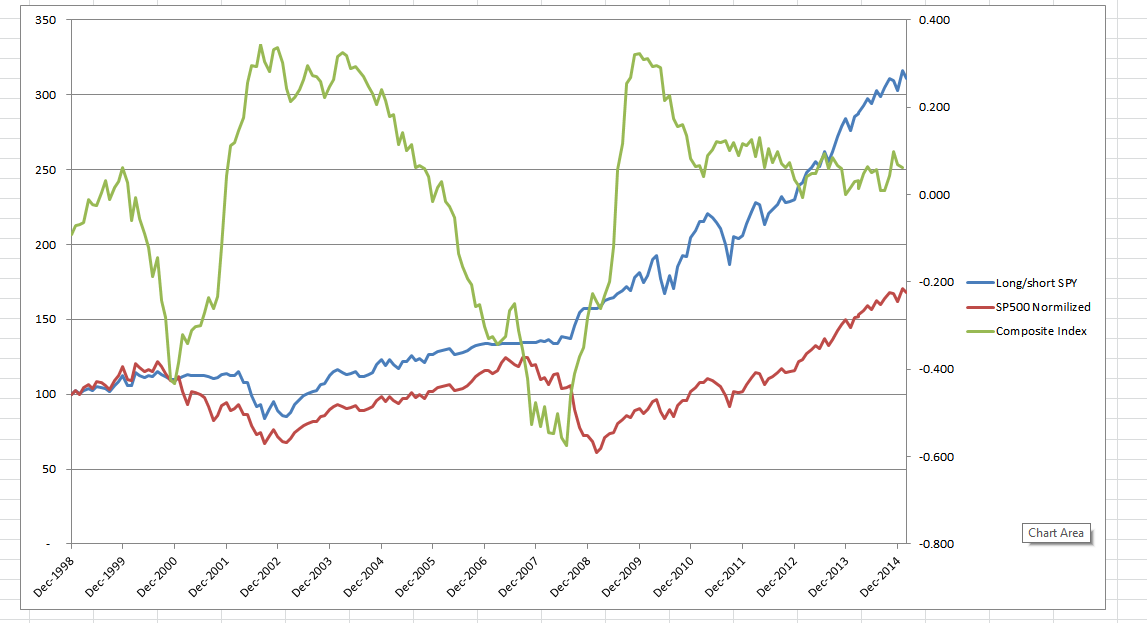
It means that adding this factor into the model will give some positive effect. It can be done through the current SPY value as of % of previous years Hi. It will give you a signal to buy at the trough (many R2G models went to unhedged mode too late during the 2008 crisis). The overall impact on my old static index presented in the file is that sharpe increased from 0.65 to 0.72 (variable weight long/short SPY). Take a look on the graph attached. Return two times higher and st dev 1.5 times lower for the presented period (and it is not optimized). By the way index correlation to avg. 12m SPY forward returns grew up from 0.5 to 0.6.
That’s the simple average of 4 normalized indexes (mean is zero, deviation devided by 3 sigma).
Three of it provided by recalert and comprise different leading economy indexes (recalert includes almost all known economy statistics)
Based on that index I change long - short SPY weight from the 0.9-0.1 mean. Long and short is limited by 100%.
Choosing the way of usage of that index (and any other MT signal) will change output sharpe.
That’s why I don’t rely on Hull’s sharpe and asking the correlation instead of sharpe (my avg non-optimized correlation to 1 year avg future SPY return is 0.6, and I didn’t find that info in Hull’s paper)
So the task is not only to construct such a market timing index with highest correlation to the future market returns but also is how to use it in practice.
For example assuming long/short SPY mode we can change the following parameters:
Use it as variable weight of long (short will be 100%-long) position or use it as discrete number (particular case and most popular way on/off hedge and only available in P123)
Rebalance period in case of variable way of usage (for example, especially assuming trading costs using not only long/short SPY but low liquid ports instead, monthly rebalance becomes much less profitable)
Mean weights for long/short at starting, long-short weight limits, level of influence of that index to long/short weight (exact function in other words)
It would be nice if somebody will make such an index (with 0.6+ correlation to 12m return, or 0.4+ to 6M) in P123.
It is possible and will be very convenient and available at any moment at one place.
And everybody would use it free on his own way. What would you say?
P.S. By the way recalert made their own model that shows 0.7 correlation to 12M return. Maybe they over-optimize it maybe not, I don’t know.
I have read the thread and judged by the vehemence that some people have responded I can sense that this is a touchy subject.
My own opinion is that a Fundamental and Technical approach can co-exist peacefully.
Each approach has its own strengths and weaknesses and by concentrating on the strengths of each approach, the two can indeed complement each other.
I’m an active trader on ES future and for me a Technical/timing approach works well.
At the same time, I would be hesitant to say that its easy. Myself had to learn the hard way how quickly a strategy could be overly curve-fitted during back-testing.
It took me a number of years (and quite a bit of school fees!) before I had a technical approach that I felt was robust enough to trade with my own money.
To combat the dangers of overly curve-fitting, I concentrate on an approach that generates lots of trades.
I do not even touch a technical strategy if it doesn’t have at least several hundred of trades where a significant portion of the trades were generated out-of-sample.
In fact, most of the strategies I trade typically generate more than 4000 trades on 17+ years of ES future data.
(Using 30 minute data bars provides sufficient data points)
Obviously, back-testing assumptions regarding to slippage becomes crucial because it doesn’t help if you have lots of trades with unrealistic slippage assumptions.
Coincidentally I also use the TradeStation (TS) platform just like Christopher and have been doing so since the mid 90’s.
As part of my strategy design & evaluation methodology,
I’m using the built in Walk-Forward Optimizer to help me determine if a strategy is sufficiently robust for real-time implementation.
Currently I’m running more than one strategy fully automated via the TS platform.
But obviously this approach is more labour intensive compared to the P123 approach. Whereas you could run your P123 portfolio only rebalancing one a week, I have a dedicated trader that constantly monitors the strategies throughout the day, because even with full automation, one cannot take the risk of just leaving the computer alone.
I believe that no single trading approach will ever be the Holy Grail. By using both a Technical and Fundamental approach next to each other, I’m simply smoothing the combined Equity curve and diversifying risk, not having all my eggs in one basket.
By the way, when it comes to stock selection combined with Fundamentals, then I think P123 is an excellent tool! I also agree with calif2 that adding multiple time frame analysis could indeed be a very useful addition in functionality.
Technical rules to MT mean discrete variable predictor factors to forecast market returns.
It has two values yes/no or 1/0. MA-50 crossed MA-200 yes/no etс.
The best MT models show R2=0.5 to 12M future return (correlation then is 0.7) based on last two decades data. Richard Anderson shows even the same R2 to 6M return which is more complex than to 12M based on 5 factor model (only one factor is technical variable - as I already mentioned and used in my model negatively correlated past returns to future ret) and past data (published 1997).
So the question now is what the technical approach can achieve in terms of correlation.
Lets calculate R2 for Intelligent Value MT model as example (I’m not sure it is technical, cause he uses some proprietary third variable. Anyway it is 1/3 of his model cause as I understood he uses it as discrete number - above or below zero or something similar and switches to cash from 100% long when 3 model’s variables trigger from zero to 1). Somebody showed simulation starting 1960 year.
Usually presented sharpe ratio doesn’t show full picture in MT. Because the way you use the MT model affects performance as well. Obviously the more R2 of non over-optimized MT model the more you can rely on it and construct MT function with higher model influence to output weights (assuming long/short). For example to use 1.5 long - 0.5 short limits with variable weight as Hull, or 1-0 fully long or totally in cash only. It brings very different sharpe using the same MT model.
So I think that technical approach can bring some positive effect but not much at all and for large time frames starting from 3M.
Combined with fundamental it brings much better result but not very high as well. Therefore I propose focusing on stock picking without MT and on undeveloped short systems.
Nobody cares about MT for bonds for some reason:)
Yupolv
I respect your opinion.
At the same time one should be careful to generalize.
I have to tell you that I actually don’t care if other people believe in a Technical approach or not.
What I do know is that my Eagle strategy for example was up +11.4% in August and +10.1% in September (based on trading the ES future with $15k capital per contract), during difficult market conditions.
These are not hypothetical figures. These are figures coming directly from my trading account where the trades were executed, fully automated via the TradeStation platform.
In other words, I’m quite happy with those returns and see no need to try and convince other that the Technical approach that I’m following actually works.
Again, no disrespect from my side, just sharing some real-time experience.
Wouter
Wouteroos, I’m glad that you make money in tough market. But 2 months are not enough. I saw many traders with 1 or even 3 years trading history that made 1000%+ of total return on forex but all of them finished the same way. I even combined them into one portfolio that tracks 20 best high frequency traders (not only forex but stocks and index like you). The result return was close to zero and that was not bad:). And 70% of traders in my port were replaced in 6 months. All that traders even with great history turned out cherry picking bias from global list of traders.
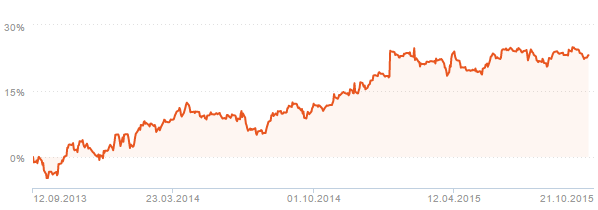
Take a look on the picture. That is a real combined result of 20 best traders (uncorrelated to each other) from thousands that showed hundreds percent return on 1+ year history before inclusion into one port. That’s why I’m so skeptical about short term trading.
Yupolv
Yes, what you said is unfortunately true and I fully understand why you are skeptical. Myself have over the years also seen many strategies fall out of the bed over time. As I said in a previous post, it was not easy and my approach developed over many years which included periods where I had to pay some school fees. But it was all part of the learning process and certainly worth it!
Those failed strategies that you refer to, were clearly over-fitted during back-testing. That’s why I personally place so much emphasis on having a high number of trades to prevent over-fitting.
The Law of Large Numbers (also known as the Law of Averages) tells us that only samples comprised of large numbers of observations reliably and accurately reflect the characteristics of the process that generated the sample. The bottom line is we can have greater confidence in what we learn from large samples than from small ones.
Add on top of that Cluster Analysis of multiple Walk-Forward Analyses combined with Monte Carlo Analysis and Sensitivity Analysis, and we can improve our chances of success significantly.
Also, I agree 100% with you that 2 months is a very short period. I merely mentioned it because during the last two months we experienced more difficult market conditions than usual (even extreme), so this period was indeed a good stress test for the robustness of any strategy.
Anyway, I have been trading this strategy since 4 Oct. 2013 (automated via TradeStation) and you can view a complete 24 month real-time track record at http://www.nextgentrading.com/nextgen-trading-system-realtime_Sep2015.htm
The strategy is up 127% after 24 months, during which period it generated 583 trades.
You will also notice that the strategy made a 29.3% drawdown during June 2015 but quickly bounced back to make new real-time equity highs in July, August and September, thereby confirming the robustness of the strategy.
All these figures are calculated directly from my actual trading account with TradeStation, and are based on an allocation of $15k capital per ES contract. Thus no hypotheticals, just straight forward real-time results after slippage and commission.
Wouter
Before inclusion in the port they showed real trading results during at least 1.5 years (some of them even 3 years), not simulation. That’s a critical point.
But the problem is that risk distribution in such strategies is not normal at all.
It has very fat left tails. And early or late it realizes.
So the answer is that these traders were just lucky guys before inclusion (cherry picking bias) when they showed 1000% REAL returns.
The further return was much much less (as you can see in the graph annual ret is about 12%, but the risk is quite low as well and sharpe is high enough comparing to individual accounts because of their theoretically zero cross-correlation).
For the last year ret is close to zero as in my port.
Interesting facts.
Don’t know how many trades these guys had during their 1.5 years real-time, but if it’s anything less than 300 trades, then I would not be surprised if some of the strategies eventually failed.
By the way, what would your analysis be of the R2G models?
Using the “Find” option of the R2G section, I ranked on “Return YTD” on the Performance tab and got the following YTD figures:
Out of 293 R2G models
46 models had a YTD%>= 10%
109 models had a YTD% between 0-9%
101 models had a YTD% between -10% and 0%
37 models had a YTD% < -10%
(Not sure if the above numbers include “graveyard” models and should still be added?)
So it looks as if 47% (138/293) of models had a negative return over the last 9 months?
I am specifically interested in the performance YTD since the last 9 months was a good test for true robustness.
One of the characteristics of a truly robust model is that the model can succeed during all kinds of market conditions, i.e. bull, bear, trending & non-trending markets.
One of the issues with collective2 is that traders keep adding to their positions as the position moves against the trader. Then the trader sells quickly when the position has profits. What this means is that 99 out of 100 trades will be profitable, but the 100th trade will sink the portfolio. This is seen mostly with FOREX traders. In this situation, a large number of trades does not predict reliability, quite the opposite in fact.
Steve
Good point!
Position sizing can easily skew results. That’s why analysis should ideally be performed trading in a fixed contract size.
When I designed the Walk-Forward Optimizer software (which was purchased by TradeStation in 2010) users always asked me if they should perform their Walk-Forward Analysis before or after position sizing.
I always felt strongly about performing the analysis before position sizing, for this exact reason.
Wouter
Yury - are you complaining about the equitygraph you posted? I don’t quite understand why you are complaining. The drawdown is quite low and the equity curve is progressing upward. Hedge funds would be envious of this type of performance. I think the problem lies with your expectations more so than the performance. Just because you aren’t seeing 1000’s% profits like was seen in past performance doesn’t mean the system selection criteria is wrong. This goes back to what I said before in that you shouldn’t expect the same performance going forward as in the past. The fact is that if you are achieving alpha or profits then you are doing something right.