The fact is that on P123 as of 2015-10-10 out of 167 R2Gs with at least 360 days since launch only 5 R2Gs OOS outperform their IS performance, 4 out of 5 R2Gs outperforming are FREE.
What does that tell you Konstantin?
Hi everybody,
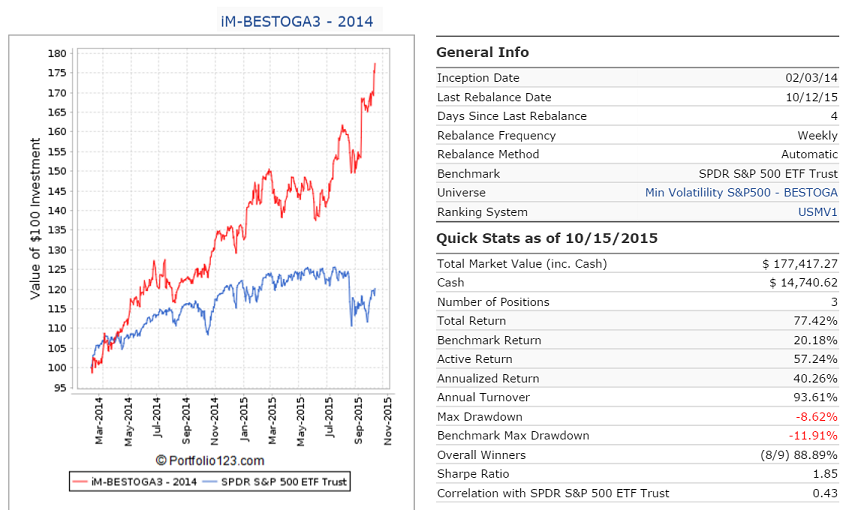
These discussions are getting us nowhere. There is one group of stocks in the S&P500 which show an annualized return of 20% from 2000 to now. They are the BESTOGA stocks, short for Beer, Spirits, Tobacco and Gambling. The recent takeover bid from Anheuser-Bush for SAB-Miller with a 40% premium for SAB-Millers shares is an example why this group is exiting. TAP gained 10% on Tuesday 10-13-15.
Steve has a model for them, but no subscribers. I have the BESTOGA3 on my website. I can assure you everybody is exited. Here is the link to the model description. http://imarketsignals.com/2015/trading-the-beer-spirits-tobacco-gambling-stocks-of-the-sp500-with-the-im-bestoga-3-system/
Even better is Combo3b. This combines 2 of my ETF models with BESTOGA3. Have a look at the combo description.
http://imarketsignals.com/2015/im-combo3b-a-model-combining-the-bestspy-sh-best1sector-spdr-and-bestoga3/
But BESTOGA3 cannot be a R2G model because it only holds 3 stocks. The universe currently has only 7 stocks. You can consistently buy all the BESTOGA stocks of the S&P500, rebalance to equal weight every 3 months, and based on past performance you should get a good return.
BTW, if you think that these stocks are socially unacceptable, then think again. TIAA-CREF, the retirement financial service organization for teachers, has all the BESTOGA stocks in their $110B stock account.
The R2G model that Geov mentioned is here: https://www.portfolio123.com/app/r2g/summary/1375598
This model holds stocks for the long term and applies similar buy/sell rules as my other Tax Smart models. Annual yield is currently 3.8%. And with the long hold time you can earn income by writing calls against the positions if you are into that. All five holdings have options.
Steve
Konstantin,
I guess it depends on your criteria. The S&P500 is up 7.5% over the last year during a hard year for the market. In fact, today’s close is no higher than the close on 11/07/2014. Of the 167 R2G Ports with 1 year OOS, there are 89 Ports with an OOS return > 7.5%. So if you are trying to beat the S&P500 there are 89 (over half) to choose from.
It is not wise (or fair) to just state that a Port’s OOS underperforms it’s in sample performance. To make a valid comparison we need to look for similar market performance in the in sample data. If the Port underperformed during other periods when the market was flat or down, then it could just as easily be concluded that the OOS performance is similar to the in sample performance.
My favorite Ports are those that use both Value & Momentum to find stocks. I find that they significantly outperform my baselines during periods that the market is doing well. However, due to the momentum of those stocks, when the market falters, they are the first to underperform the market. That is also what they have done over the last year + since the oil price started falling last July. So when one of my Ports underperforms the market during these periods it is doing what it has done before, and I don’t worry about it. The small underperformance during these times pales in comparison to the performance when he market is rising.
Hi,
I think so too, value and small cap momentum had two hard years. Only big cap momentum had
a good run. A lot of r2gs are in this area.
I think it will come back someday.
Though micro caps worked fine the last two years (not in my r2gs due to limitations, but tradable,
traded them sucessfully for 2 Years with a 300k account).
From what I see from my personal trading, value and momentum in small caps is comming back
very hard right now, hope this is not a dead cat bounce…
I believe we expect too much from our modells.
I think the way to be successfull in the markets is to grind it out, 20% or more mdds and
phases of underperformance of a style might be just normal…
At least I work on that part much more right now, then to get better modells…
I had a DD of 20% this summer, I am back to -9% within the last 3 Weeks, and I Keep telling myself,
that since 1999 my Modell (a book of 5 5 Stock modells, value, momentum earnings momentum) never
had a Phase where it made less then 180% in a 3 year time Frame and a beeing mostly up over 350% in a three
year time Frame.
Also the DDs come usually after a huge run up (also 2008, it was up 20% then down 40%, this is bearable for me!), so I Need to get trough this dd and be fine in the future…
I came to the conclusion to simply grind it out. I had a my big cap momentum model since 2002, ist not
perfect, but If I would have traded it, I would have been better of then searching for the wholy grail…
Regards Andreas
Steve, you forgot to mention that your “Vice” model is up 17.4% YTD with hardly any trading. BTW, the BESTOGA3 gained 33% YTD with 4 sell and 4 buy trades in 2015. So it is not about trading. You have to have a good universe to select stocks from.
Denny and Andreas, Thanks for the reminder on keeping a long term perspective. It is easy to lose sight of with the proliferation of instant media.
Steve, I agree that some on this board have expected performance standards that are unrealistically high. These standards usually drop with more experience as Mr. Market is a formidable opponent. Also, nice work on your R2G port.
Geov, having a good universe does help but it can be hard to prospectively identify which universe selection criteria will be rewarded in the future due to market rotation. Do you have a method for prospectively identifying this (some of my universes are constrained and some are open ended)?
Scott
Scott,
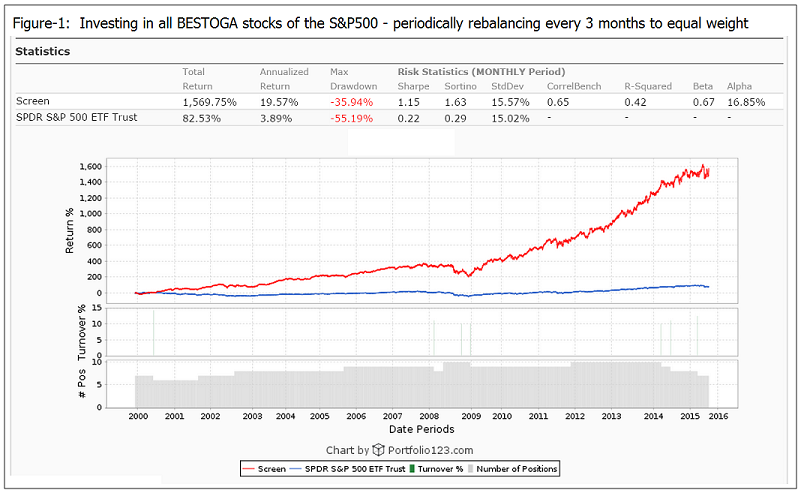
The BESTOGA stocks of the S&P500 seem to be a good example of a universe of profitable stocks. Over the last 16 years one would have had a 20% annualized return by simply investing in all of them equal weight and re-balancing every 3 months. Not a big trading effort. People always like to drink, smoke and gamble.
Steve, at least that rises two questions:
- There are outperforming R2Gs?
- 80% of outperforming are FREE R2Gs?
Denny, you are right. But I am talking about R2G OOS performance vs. IS performance, not comparing to SP500. There are fx models promising 1000% per month IS. It is not hard to beat SP500… in-sample.
It’s all about consistency. Some states no consistency IS vs. OOS, it is by design. OK, I can accept this. Past results does not guaranty future blah blah blah. Can someone guaranty IS consistency to OOS-50%?
And you mentioned both ways.
The fact is that on P123 as of 2015-02-28 out of 125 R2Gs with at least 360 days since launch only 16 R2Gs OOS outperform their IS performance, 8 out of 16 R2Gs outperforming are FREE.
So there the outperformance? 50% of outperforming are FREE R2Gs!?
Note, actually I do compare OOS to Combined (IS+OOS) performance. Real figures worse.
Konstantin, you are absolutely right. That’s the greatest problem here that I mentioned many times.
I think that’s because of P123 business model which oriented on R2G designers and their retail users.
To find subscribers (most of whom are ordinary people) you should present impressive models.
That inherently leads to curve fitting approach that significantly decrease OOS performance (Steve or somebody else from experienced designers says that some alpha still exists in OOS if it exists massively in IS, but I have quite opposite view and it has been proved in practice on P123’s R2G history).
They spent, how many 5 or 10 years? in curve fitting attempts. And I think P123 team should solve this problem somehow, in other way they spend 10 years more:) And P123 will stay as a 500 people platform with no real money.
P123 made great job in technical aspects, but not in practical implementation. If they add some critical features (I will post it in my branch - https://www.portfolio123.com/mvnforum/viewthread_thread,9182 some of them is easy to do but you should know what really need to do), and a proper business plan, they can attract different public and good money finally.
P.S. Konstantin, you didn’t take into account terminated R2G (cherry picking bias again). If it would have been possible to do you would be greatly surprised by results:)
Yury/Konstantin - The high number of models that don’t perform “as good” post-launch clearly shows that the overwhelming majority of designers optimize their models. One reason why was highlighted by Denny. He optimized for periods when value outperforms growth. His explanation is perfectly valid. The point is that backtest is a tool, nothing more, something even Marc has stated in the past.
There are some subtle reasons as well. The free models that you refer to were launched near the beginnings of R2G. I don’t know if you remember, but the first 6 months were aligned with quantitative easing. Any model that was active (post-launch) at that point in time got a very substantial gift of performance.
Another more subtle reason is that there are fewer bugs in software that is frequently used, in particular by P123 staff. In other words, factors that P123 staff use regularly is more likely to perform as expected, if it didn’t work then they would investigate and fix. Factors and functions that they don’t use often, have a higher probability of not working. For me at least, I use a great deal of the P123 functionality with the assumption that it works. But there are several instances of bugs (at least half a dozen) showing up since the launch of R2G that have certainly affected performance of some of my R2Gs. A good example is (all of the 3yr and 5yr growth) factors didn’t work properly. This affected the OOS performance of my Stitts Wealth creation models which had a Value/Growth tilt based on market conditions. (I have now modified the S&P 500 model that had defective factors with a return to “good” performance.)
In any case, I have a question for you. Would you rather subscribe to SmallCap GARP and Buffett , both of which are free and outperforming their IS records, or 1st! SME (Size, Momentum, Earnings) and TWY 5 stocks HG EMA 11 SYS which are under performing their IS records? All of these models have more than 900 days post-launch. If your objective is to out perform the IS track record then you obviously would set the bar (IS performance) low, right?
This is like all things in life. If you set low goals then you shouldn’t expect to be an over-achiever. If you are trying out for the Olympics, you train to win a Gold medal. Maybe you get a Silver, Bronze or top ten. If you train to be top ten, then maybe you won’t even finish the race.
Steve
This is not at all so.
Reference to R2G models by P123 staff presumably refers to R2G models by me.
I don’t use or not use factors based on my belief that they are free of what you refer to as bugs. (Factors used by me have, over the years, been included in some that had to for one reason or another be adjusted, including some big changes we had to implement when we switched from Reuters data to Compustat.)
As I’ve said many times before, the factors I use are those I expect to work based on my interpretation of financial theory, and none of these ideas hinge on one specific definition of data as opposed to another. Often in the past, before making changes on the live site, Marco asked me to compare my performance on the live site with the performance shown on a beta site to see if there;'s meaningful impact, and invariably, I report no changes or trivial changes. Regardless, if a bug has to be fixed, then it has to be fixed, case closed. These tests are never to determine whether to launch the change. They’re done so we can try to anticipate ahead of time the nature of the reaction we’ll get from users and try to be as ready as we can to address questions and reactions when they arise.
I assure you that Marco and I do not collect and review a list of my favorite factors to keep them as clan as possible while letting the others lag in terms of quality control. Bugs surface from sources having nothing whatsoever to do with factors I tend to favor.
“if it didn’t work then they would investigate and fix”
???
If I use a factor that doesn’t work, I don’t investigate the accuracy of data. I don’t even discuss the data with Marco because I never consider disappointing performance to be a data issue. So he couldn’t adjust data around my models or tests even if he wanted to.
I never use a factor I don’t expect to work. If I’m caught by surprise and I don’t immediately spot my translation deficiency (idea to computersese), I check the companies that show up in the portfolios to look for instances in which the spirit of the law didn’t match the letter of the law (i.e. in quant lingo, I’m checking to see if my model was mis-specified) and I solve the problems by adding redundant factors (to diversify away the risk of data aberration) and/or work with screening/buy rules to weed out systemic issues.
Details of process aside, the big answer here is that if something goes awry, I never ever point to the data or the platform. The only way I can ever solve anything is to address the “me problem.”
Marc - I was not specifically referring to you but I suppose you are the primary P123 staff user of P123. What I am saying is absolutely true in the world of software, whether you care to believe so or not. S/W that is well used will have fewer bugs that S/W that is not well used. That is a fact. And this is complicated by what P123 perceives to be a problem. Not everyone designs their ports in the fashion that you describe and the attitude is simply reinforcing my point.
As for the growth factors, that is an example of a gross bug that should have been caught before the s/w was ever released, not thrown back at your customers as their problem. The “ME PROBLEM” is actually a “P123 PROBLEM”. Every bug costs members money, money they would prefer to spend on P123 than giving it away to the markets. If P123 states that they have a certain function, then I would expect that it has been fully tested. Why I have to spell this out is bewildering to me.
Take care
Steve
-
We NEVER release anything without testing and without a known bug. But as we go on, we discover new things and when we see a bug, we can’t imagine not correcting it. We’re not alone. Every software provider that drives us crazy constantly with updates (“Bug fixes”) is doing the same thing. This is the world we live in.
-
I don’t recall which specific factor you’re referring to but I’ve been using growth factors all along and nothing involving thew data or the platform has impacted any performance of any of my models, personal or public.
Apropos the R2G oos performance. I have been on the fence on subscribing to R2Gs for many of the reasons you raise. However before proposing to the process completely, I wonder if P123 can act on some of the previous suggestions. For instance I saw a thread where the R2G report would not be single number but an average of say 10 to 100 sims based on some randomization. I feel it is not appropriate to report the optimized IIS peformance.
Marc - my recollection was that about 1.5 - 2 years ago there was an issue with the 3Yr/5YrGr% factors. I am having difficulty tracting down the exact posts now so it is possible senility has kicked into high gear ![]() All I remember was that the issue prompted me to revise a couple of my models. Perhaps it was a bad example I picked out.
All I remember was that the issue prompted me to revise a couple of my models. Perhaps it was a bad example I picked out.
Steve
Konstantin,
You may have missed my point. I was not referring to a comparison of OSS to IS for annual performance, MDD, or even Sharpe. The point I was trying to make was since the “market” has been difficult over the last year + of OSS, are there similar poor market periods in the IS data in which the Port underperformed the baseline. What I have observed from a careful review of the time histories of many of the R2G Ports that “OOS underperformed their IS’ over the last 360 days, is that there are many time periods over the IS data that the Ports also underperformed their average performances.
When I find a Port that underperformed its baseline during similar market conditions during it’s IS history, I conclude that during the last year the OSS is similar to the IS, and the last year’s underperformance “is expected” based on the IS time history.
So I repeat my previous statement; “It is not wise (or fair) to just state that a Port’s OOS underperforms it’s in sample performance. To make a valid comparison we need to look for similar market performance in the in sample data. If the Port underperformed during other periods when the market was flat or down, then it could just as easily be concluded that the OOS performance is similar to the in sample performance.”
To echo what Denny saying: Value and momentum are doing poorly over at Zacks too. Unless their in-sample data was negative (they do not give this data), their out-of-sample data is underperforming.
I am paper-trading a generic Value and Momentum port (it also uses Zacks rank) based on Zacks premium screener. The screen uses Zacks Styles for Value and Momentum will no additional factors besides Zacks rank. It is doing poorly. A paper-traded generic growth port is in line with the benchmark.
Everyone, everywhere is having problems with Value and Momentum. I do not think it is the fault of P123s designers but for sure switching to Zacks is not going to help. I use P123 for my real money.
The only issue I remember having had with growth rates was what a pain in the neck it was to calculate them unless we had a prebuilt item,and I advocated for a general-purpose growth rate function, which was recently implemented. i don’t recall whether I talked about it on the forums; I certainly whined a lot in house.
As to calculation of the growth rates, I’ve always been aware of Marco’s c++ code and don’t recall ever having had a problem with it.
The biggest issue I remember you raising was with Ind algorithms and that was a classic case of something that seemed to work for many years (long before p123; our first Ind was a reverse engineering of what we got from Reuters and what Reuters got from Multex and what Multex got fromMarket Guide which it created back in the mid-1990s) that was discovered to have had a serious flaw only when we were able to look at it on a new way based on a new tool (the fundamental charting). And as we extensively discussed argued etc last spring, the disturbing and not-previously-discoverted element of randomness to which the old algorithm was prone was such that regardless of what impact the fix may have had on anybody’s simulated performance, the user should have been grateful for our having fixed a bug that could have damaged oos performance and that we offered a new function that even allowed the user to reinstate the randomness if desired.
And that brings us back to the topic at hand, or at least to the topic to which I replied last night. The Ind changes had no significant impact on any of my models (and I usedInd A LOT – an I advocated the heck out of it in both of my books). Ditto the many definitional changes implemented when we switched to Compustast. And ditto some occasional fixes we’ve made that I can’ recall. And I’m not at all surprised – the way I model, any change that removes stray elements of randomness is a good thing. And while quite a few folks here do not agree with the way I choose to work, I’m not the one who called out my R2Gs as being rare for delivering, for the most part, live performance in line with or better than in sample performance. That was done by someone else in this thread. And my jumping in here is not to pat myself on the back (I’ve been doing this long enough to know that as soon as one does that, one hits the proverbial bad streak), but to point out that it did not work out that way because we somehow rigged the data (selective debugging)to favor the items I use but because it’s what I aim for when I choose items.