Thank you, Tomyani. I intend to give an update in 6 months, whether results remain good or not.
My methods are changing significantly. Before, after screening stocks for a few quantitative comparisons, I would read company SEC filings for information not reflected in the numbers, check news articles and grade the company and industry news as negative or positive, mull over the potential for business cycle changes and lawsuits, second-guess growth estimates, etcetera. Very time consuming and not always helpful.
I now want to simplify with just a quantitative approach. It will not always be correct, but it only needs to be significantly better than throwing a dart at a ticker list. I feel confident that Portfolio123 provides enough capability to do just that.
I want to chime in with a cautionary note - p123 is a great tool, but don’t get carried away. It is very easy to make backtests that show monumental returns. I think your approach is wise, taking a pre-existing, and well-proven ranking system. I would of course, suggest having more holdings, typically at least 20.
To use this tool properly, take it slow. Remember to remind yourself that the great investors have achieved 20-30% annualised return over the long run. There may be advantages to being small - Buffett has said he thinks he could do 50% per annum on a $1million portfolio. To my mind this indicates what are realistic targets.
I think it can be an unfortunate problem that new subscribers (and this happened to me too) are seduced by the fabulous returns shown by various backtests, and ignore the less good, but still very achievable and high returns of more “tried and tested” models. In other words, if you see fool’s gold, you may end up on that path, and not stop to look at the real gold.
I agree absolutely. This portfolio is a test and I have allocated less than 10% of funds to it. I intend to expand the holding count to at least 20 stocks if I increase the allocation, either with the same model or a complementary one.
My target is 20-30% annualized, and I would be satisfied with perhaps 10-15% alpha. A backtest of this portfolio since 1999 shows (27.16% with my market timing, 21.66% without) compared to SPY’s 4.03%, and I would be thrilled if it performed nearly that well going forward. Since I’m now retired, the importance of capital conservation has grown and I place more importance on standard deviation, beta, and the potential for market timing rules that limit drawdown.
If being small is an advantage, I have nothing to worry about in that regard. Large funds definitely have problems finding ways to put money to work, and it leads to some market inefficiency in individual stock prices at all market cap levels. Buffet tends to look for underlying value in the quality of management, having an edge in the industry’s market, and long-term growth potential. These are difficult to analyze using a monthly rebalanced quantitative approach. I now tend to look for companies with good fundamentals that will hopefully attract an incrementally larger following in a shorter time frame.
I expect to do my own analyses and don’t use momentum or any other technicals. I congratulate those who use them successfully but I feel more confident trying to tweak the fundamental methods that have been most successful for me in the past.
I really appreciate all of the opinions and information provided by yourself and others in the forum. It provides a wealth of ideas to test and will keep me busy for a long time.
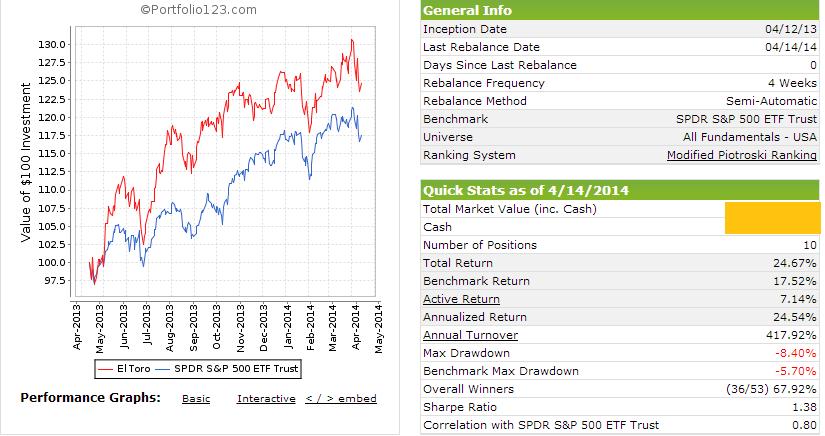
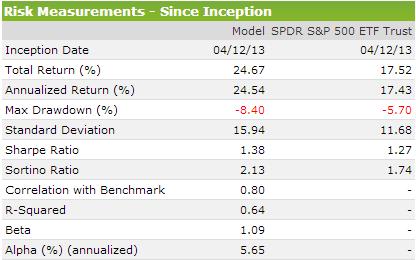
The port was started 4/12/2013, so it has another 3 months to go before the second six months of results are completed. Through 280 days, the after commissions (port/SPY) total return is 25.06%/17.45%. Annualized return 33.87%/23.35%. Sharpe 1.68/1.53. Sortino 2.74/2.16. Obviously, the overall market has been very good in this period so what happens to the model in a real downturn remains to be seen. Roughly comparing results to higher market cap R2Gs that have a similar launch date and public P123 ports for the same time period, I’m satisfied that it is performing reasonably well for my first effort. It’s “OK” for now. But I would like to reduce standard deviation (18.71/13.58) and beta (1.07) which may be difficult in this port without impacting return significantly.
That said, here are my thoughts about the overall experience so far.
For a while, I couldn’t keep my hands off the model! It’s a learning experience for me, and the first trial. So every time a significant loser stock crept into the mix, I looked for ways it could have been avoided. I’ve tweaked the model 3 times with minor adjustments that will hopefully remain positive in impact. For now, I’m tweaked out. I suspect most model designers will go through a similar post-launch reaction.
It has been very helpful to have the automated analysis of buy and sell signals received by email. This is a key benefit of Portfolio 123 for me. Regardless of what else is going on in your life (and the last few months have been very disruptive for me), it’s very helpful to have “an assistant” perform analyses for you and hand you the results on a fixed schedule. My portfolio is set to semi-automatic, so I follow the sell and buy recommendation stock list and post the actual trades after they are done.
I am not interested in trying to squeeze every bit of incremental profit from each trade, so in screens and simulations I assume next day average of high and low price. My belief is that over time and many transactions any positive or negative slippage I may experience from average price will be minimal. Since screens don’t allow for commissions, I include a percent slippage that roughly represents the commission costs.
I still have a lot of learning and experimenting to do with this platform. My current focus is on ways to improve under-performing periods and analyzing the newly available economic indicators for regime switching and market timing possibilities.
Thank you for sharing your learning points. I joined last spring and thanks to staff like Paul and experienced users on this site, you can jump start your learning.
One question i do have for you and the advanced members is related to tweaking the model to the point that it is now over engineered, and may not come close to forward looking results. What are some ways that one can see if they have data mined tweaked to the point that the model will not be representative of actual performance going forward?
Here is one thing that i just noted.
One of the things that i did was to up my membership from screener to designer. I realized that the number of trades that i had was statistically insignificant and i was backtesting with 40-60 trades compared to now 200 trades going back to 1999.
In Port123 it is easy to think you understand something only to find out you are mistaken later. Guess you can call that the conscious competent compared to conscious incompetent which classified me well before.
By the way, i realize that i will never reach the competence level of some of our advanced members (nor do i want to) and so include ready2go portfolios from members like Denny to include in my book of portfolio.
This is a very important but extremely complex question. There are other threads that attempt to solve this problem, and I can’t propose a reliable test method. There are general guidelines that help, but the only true (partial) test is actual performance out of sample in a new time period going forward. I say partial test because every model is a probability function, and there is always a probability that even a 100% valid model will not perform to satisfaction in a new environment going forward, either for a short or long period of time.
In essence, we would like to know the probability of a function continuing to perform in the future, but the function itself is a probability that assumes the environment (market, economies, politics, commodities, wars, natural disasters, technology, you name it) in the future is represented by the past, our function properly accounts for it all, and no significant factors are ignored. That is impossible in my view. Some place faith in statistics about the function (how many variables versus degrees of freedom, how many trials were used, how many trades, and so forth. My faith is in the belief that we don’t even know how much we don’t know and that we tend to find reasons to believe (rationalize) that which supports our preconceived notion of what is right. Sometimes we use statistics to support our rationalizations.
I’m not pursuing an extreme return model. Those would likely have a different approach to prevent over-optimization. Guidelines I use in my own efforts:
Use representative fundamental data as much as possible and technical data as little as possible. I believe it’s easy to rationalize patterns in price, volume, momentum, volativity, etcetera, and I have more faith in fundamental relative comparisons. Reversion to mean has some value, but what happens when a new mean occurs or another factor dominates?
Model with at least 10 holdings (20 or more is better) on a 4 week rebalancing schedule. If it doesn’t perform well with 10/4 but does with perhaps 5 stocks weekly, then it may be overly selective and more likely to break down. This is a choice I make because I would prefer to find a model that is not highly selective.
Check the data to see if NAs significantly impact rankings and filter those stocks out where possible (a bit fewer unknowns then remain in the pot).
Attempt to find a model that does not significantly underperform an alternative investment or index in any year. After finding one, market timing can be applied. Sector rotation might help. This one is currently tough for the quality/value-based models I prefer. My best current model has one underperforming year that I’m working on slowly to resolve.
Always include either slippage or commissions representative of what is expected. Never leave them out of a model.
Test each rule’s effect for impact by varying its importance or value. Does the change in impact make sense? This should be done at each level (universe, ranking, buy/sell).
Expect some failures. If it’s perfect, it’s not. Trying to remove all losers from consideration can easily lead to over-optimization.
I have more faith in a model that passes more stocks than are chosen. For instance, if I want to hold 20 stocks but only 10 pass all of the rules, then my concern about over-optimization rises. This is a “spread the risk” concern that might be handled differently depending on your approach. Two models that each hold 10 unique stocks, for instance. Keeping a portion in cash when few candidates pass. Different approaches can be used.
If you haven’t yet, read some of the threads on this issue. There are other viewpoints and lots of knowledge that could be helpful.
The extra data is very important. I’m at the Lite level and can screen back to 99 but am limited to the latest 2 years on sims. That currently is OK for me. A limit I would love to get rid of is only one personal ranking system. I might have to upgrade…
agreed however there is some value in following divergences in RSI as an example. I gave up using technical indicators for reasons you mention and now use a weekly chart with 30 wma and volume as my litmus test. One other chart type i recommend a look at is point and figure charts. they were started in 1933 originally as a price recording approach which got turned into a chart with targets (up/down)
i have backtested my models and am a subscriber to 2 ready2go models. It appears weekly rebalance does work. Most of my models are positioned for 5 stocks with exception to one model and my subscribed ready2go models have 5 stocks. This may be due more to my search for value and lets face it, there is not much value out there. So why force it.
Sorry, I didn’t mean to imply anything negative about weekly rebalancing. I backtest better performance with weekly rebalancing but I don’t normally develop the model at that frequency. My belief is that modeling first on weekly rebalance, especially with a small number of stocks, is more likely to find models with a higher chance of failure. Perhaps I’m too cautious?
There are a couple of other basic techniques that could be useful but I don’t normally take advantage of, perhaps to my disadvantage:
One is the use of EvenID which effectively splits the universe into roughly equal halves. From its Help description: “Use a rule like EvenID=TRUE while developing your system, then switch it to EvenID=FALSE to test the system out-of sample.” The two halves do share the same time periods, so it really doesn’t qualify as a completely out of sample technique.
Another is the use of Random as in “Random<0.8” which can throw out a randomly selected 20% of stocks that would otherwise pass the buy rules over the backtest period. This forces the model to use a slightly different set of stocks each run and could highlight models that are “fragile”.
Said I would do it, so here are the results after one year. Although the portfolio was created 4/12/13 (a Friday), it didn’t invest until 4/15/13 so the true 1 year return is through 4/14/14 (today). I’m satisfied since the model is focused on larger stocks (ADT >$5 million) and it had a few changes during the year.
One thing caught my attention in one of your earlier posts; a remark to the effect you wish standard deviation would be lower. Be careful about getting too carried away with this sort of thing. Stocks that rise briskly increase your standard deviation; surely you aren’t regretting any of those.
The language of risk is very well articulated in the Financial academic community. But in a practical sense, I think the quality of the knowledge they’ve generated on this topic is very poor. Beta, standard deviation, sharpe, sortino, value at risk, etc. . . . all sound great on paper but are essentially worthless when you realize that all you’re really getting is a report card on what just so happened to have happened during a specific period in the past with pretty-much zero predictive capability.
This is a bigger topic than can be discussed fully in a post within this thread, but I believe that within the next fifty years or so, pretty much all the standard financial risk metrics in use today will wind up on the scrap heap and be replaced with an entirely new risk framework. I also believe that this new framework will most likely be expressed not in the language of “finance,” “statistics,” or “mathematics,” but in the language of accounting and fundamental analysis. (Many would be amazed at the quality and creativity of research coming out lately from Accounting academics,who’ve been eagerly jumping into the void left by Finance academicians who have completely lost their minds in mathematical nonsense; the sort of garbage that, among other things, told bankers that they were doing a good job controlling risk back in the mid 2000s.) If you’re using a value-quality piotroski-inspired approach, you’re probably doing far more sensible risk control than the current vocabulary is able to express. In fact, Piotroski is a perfect example: he’s not a Finance professor. He’s an accounting professor who is on the review board of three accounting research journals and entitled the paper that produced the model that inspired you “Value Investing: The Use of Historical Financial Statement Information to Separate Winners from Losers.”
I found this comment interesting: Finance academicians who have completely lost their minds in mathematical nonsense. I do not think that math is the problem but there are far too few that know how to reasonably blend math and finance. Many in finance throw around mathematical terms that they really do not understand to produce over optimized garbage research which leads to poor out of sample investment performance.
I wasn’t referring to over-optimization. I think a lot stems from their starting “IID” (identically and independently distributed) assumption. We’re dealing in the stock market with companies, businesses; not particles that can be subjected to markov series, brownian motion, etc.
Let’s consider something simple like Beta. Work with All Fundamentals. Look at p123’s three and five year betas, and also create one of your own with the beta function. Our beta math/logic is completely correct. Yet you’ll see many betas that are indisputably ridiculous – but the numbers have to be what they are because that’s how the sticks moved during the respective measurement periods relative to the market.
From the accounting side, however, there is some fascinating research that ditches capital asset pricing model and beta and uses fundamental factors to forecast future costs of equity. Show a finance PhD a 10-k or a fundamental ratio and they’ll go “yuk, phooey” assuming they even know what they’re looking at. Show the same thing to an accounting PhD and they’ll go “cool, I can do all sorts of great things with that.”
If you really want to see something interesting, download and read Piotroski’s paper. Notice how much effort he devotes to practically apologizing for his “heuristics” (factors selected on the basis of human judgment). Not sure who was giving him grief while he was working on his paper, but today, we’ve heard of and make money based on what we learn from Piotroski; as to his presumed critics, they live on in obscurity and probably haven’t helped anybody make a dime.
Marc - [quote]
One thing caught my attention in one of your earlier posts; a remark to the effect you wish standard deviation would be lower.
[/quote]
It’s not my main driver but a goal, std. dev. lower than the benchmark. The portfolio above did not do that in the first year, but one year is only a beginning. I’m testing a related 30 stock model that backtests a better return, lower drawdown, higher Sharpe and Sortino, and lower standard deviation. But it’s std. dev. is still higher than the benchmark, and I would like to reduce it.
If there is no predictive ability in the historical risk statistics of a model, then I should put my money under the mattress or choose the model with the highest return. But then I would be professing belief in the predictive ability of one historical statistic (return) and ignoring relative comparisons of other stats. Why one and not the others? So I choose to believe there is some relative prediction ability in the risk measurements, imperfect as they might be.
I had to grin when I read your words, because I see very strong parallels between these concerns and what I would say about the last 50+ years of theoretical particle physics. A similar battle played out between pure math based on probabilities and approaches based on field structure models. For now, pure math has won but some (including me) believe the approach used has missed the truth. I am just as frustrated about that as you seem to be about portfolio theory. In short, it might take more than 50 years for your vision to come true! For what it’s worth, I agree with your general position.
I would be interested in the accounting side fundamental factor research you alluded to. Got any suggestions?
Actually, it’s very easy to see that these stats have zero predictive ability. Just create some reports in p123 that show beta, etc., and then repeat the exercise for a whole bunch of different as-of dates.
And it makes sense. There’s no reason to expect predictive ability. Imagine visiting a doctor because you’re feeling severe knee pain. The doctor does not ask about any history (i.e. Did this come about while participating in sports?) nor does the doctor take an x-ray nor does he even do a manual examination. Would you follow his recommendation? Or would you go to see a different more competent doctor, one who investigates to determine the cause of the pain and prescribe treatment (cast, surgery, alleve, etc.) based on the cause of the pain.
Beta is the incompetent orthopedist. It attempts to prescribe a treatment based (overweight, underweight, avoid, etc.) based solely on symptoms recorded by the naive observer and with no effort to determine causes (company size, cyclicality of the business, percentage of operating costs that are fixed, balance-sheet leverage, etc.). Risk is not about volatility of returns. Volatility is a report of symptoms (My knee hurts. My stock bounces around too much.) Instead, risk is about the characteristics of the company (My knee hurts because I tore my ACL. My stock bounces around too much because the company is an airline with a monstrous degree of cyclicality and a humongous fixed-cost operating profile and insane leverage.) The characteristics of the company tend to persist, so an analysis of these characteristics can give you a sense of the level of risk you’re assuming. But beta, sharpe, etc. . . . it’s just a report of symptoms on a specific day. If my airline stock falters at times when the market rallies, it might wind up with a very low, or possibly even negative beta, suggesting conservative investors should overweight the heck out of it. Does that make sense? But mathematically, that would be a completely correct response.
We absolutely can analyze and forecast risk, but only if we act like competent orthopedists. We need to take the x-rays and look at the underlying factors that give rise to what we observe in the moment.
Piotroski is a perfect example of guy who did this. Buffett does this all the time; he typically pokes fun at quants and their toys and moderates his risk by investing in what he regards as “inevitables,” companies with certain kinds of fundamental chartacteristics.
I’m out of town now, but when I get back, I’ll give you cites for some academic work you might find intriguing.
ROFL. You mean the geeks suck at physics too? You made my day!
Bob,
Thanks for your testimonial regarding the value of the Portfolio 123 membership and benefits. I am convinced that this could be what I have been looking for as a method to grow our retirement funds to meet our financial goals over the next 10 years. My thought was to use the Piotroski model as you have done, but I am intregued with the approach that others have suggested of using another portfolio model in tandem to bring the number of positons up to 20.
I’m currently subscribed as a guest, and will most likely subscribe as a Screener to gain multiple books and receive the email trade updates. Any thoughts on what you considered your 2nd best choice for a RTG model?
Also, I am somewhat surprised that the general consensious among members is to forget attempts to use technical analysis to time the market. Have you eliminated any timing considerations in the six month of results you posted?
I think you are wise to look at P123. I’m sure Bob will add his ideas below. I do not know what the consensus of the members is but there are a lot of models with at least some market timing available. You might look at “Chaikin with Market Timing” for a model with a lot of technical analysis. The author is mgertein who posted just above your post. And it is free.
Hi Doris, and welcome to p123 from a short-time member.
First, I must note that I am not a registered advisor of any kind and whatever I say I try to relate to my own situation, experiences, and financial beliefs. There is a wide range of users here, from totally inexperienced to very, a wide range of ideas as well, and you can get into it as deep as you want.
Second, I was totally off the grid for a couple of days and just saw your message. Hope you haven’t been signed in, refreshing every once in a while to catch my reply
I came here for the same basic reason, to grow retirement funds. I am totally retired now and depend on those funds to supplement social security and a small pension.
In general, I agree that using another model to expand the number of positions is a good idea. But it partly depends on how much money you intend to invest, whether you are currently retired or have several years at least before retiring (related to how much risk you are able and willing to take), and how much faith you have in each model. Models with fewer positions usually, but not always, outperform (or underperform, if the rules are bad) the same model with more positions. With a small amount of money and lots of time before needing to depend on it you might do better by not spreading it among models. As the money increases or the time to dependence decreases, the goal changes and spreading the money among models is probably a good idea. It’s probably an even better idea to first look at diversifying among asset classes rather than among stock models.
The model I use is my own private one, and I don’t currently intend to invest in a RTG model or build one. So I have not studied the available ones enough to suggest anything there. If you consider a RTG, do what you can to understand as much about it and its designer as possible and whether its goal matches your situation. There are some good designers here and some variety in models.
As for my own modeling and whether or not I have a second best choice versus the modified Piotroski approach I’ve used: The modifications I have made to the basic Piotroski model are attempts to tie together different approaches including the other All Star models, growth, sentiment, momentum and just about any other idea I come across. And I will likely continue to modify it as I find ideas that blend well with the existing model. I feel comfortable with the model so far and will likely expand its number of holdings to 20 or 30. If you want to attempt your own modeling, I suggest using your guest membership time to its fullest. You have the ability to run simulations and rankings for the entire data history, not just 5 years back. Look at the universes, ranking rules, and buy rules of the many prebuilt screens available and decide on a single starting model, then try refining it by bringing in attributes from others to see what effect is generated. There is a lot to consider at multiple levels (universe, rank, buy, and sell) and I used my guest subscription time to become somewhat comfortable with the process and do some full-length simulations, comparing them to the equivalent screen and finding suitable slippage for the screener that would be equivalent to commission charges in the simulator or portfolio.
There is also a wealth of information (and a lot of differing opinions about modeling periods and approaches) within the forums, as well as good stuff in the tutorials. This is an active site that I’m glad to have found.
I’m not certain there is a general consensus about technical timing, or even a consensus about what constitutes technical versus other approaches. I myself prefer to look for macroeconomic timing clues in commodity prices, inflation rates, borrowing costs, specific sector activity and such versus looking for changes in earnings, market momentum or volatility. I just want the holy grail - timing clues that occur before the market responds broadly. But when I can’t find those economic clues then I do consider the “technical” clues.
The one year results I posted of my model do not contain any out-of-market periods because the timing rules I’ve developed so far were not triggered. I expect to ride with most fluctuations but would like to avoid deep drawdowns of more than 20%.
I hope this answers your questions properly, and I hope you find what you want here. I’m sold so far.
I think what you mean is that an over-reliance on data crunching without conceptual understanding is bad?
However, I need to stand up for ‘Geeks.’ I was raised by a ‘geek’ but was just a lowly jock in high school. I donned my ‘geekdom’ gowns later in life. After realizing that…Geekdom is something to aspire to. Not demean.
I get that you were joking perhaps. But, it’s a potentially hurtful comment, unwise and far from true to continue to ‘demean’ geeks . ‘Geeks’ are can be very, very good at investing. The best in fact. ‘They’ appear to run most, if not all major quant funds attracting big money from professional investors. And ‘they’ are the ‘best’ in the field of quantitative investing. People such as David Harding at Winton Capital Management. Or the 6 Stanford PhD’s running Two Sigma. They ‘only’ have $20 or Billion dollars under management each. Or Joseph Piotroski (whose systems we all use…and has a CPA and PhD in accounting…has published widely and teaches at Stanford…sure marks of ‘geekdom’). Or Wes Grey (Finance PhD from U-Chicago).
Geeks are also likely most of the audience on P123. If the 1,000 or whatever active people here who build quant trading systems and study factors aren’t geeks, who is?
‘Geeks’ have also been instrumental in giving us the internet, google, modern technology, airtravel, space flight, modern medicine, the technology behind television and film, etc.
Let’s hear it for the Geeks. For ‘fun’, I googled it…