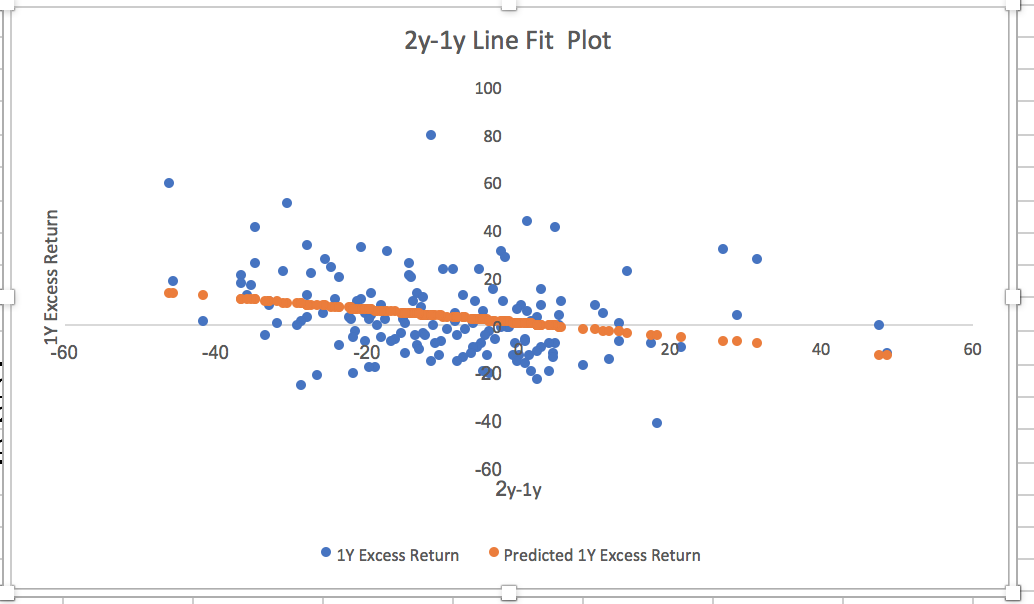
BTW, here is the plot of Yuval’s results (I get the same results).
Maybe I am missing something but I think this is interesting. This goes beyond regression to the mean and ACTUALLY HAS A NEGATIVE CORRELATION.
It might be worth considering whether there might be some survivorship bias. Perhaps, some bad ports got lucky the first year and were not withdrawn but could not continue their lucky streak. I am not sure that answers this.
David, this would make sense IF the most recent numbers showed a slightly higher correlation to OOS performance than long-ago numbers. But they don’t. In my correspondence studies, a 10-year look-back period shows the highest correlation to future performance. Anything less than six years is definitely suboptimal. On the other hand, it’s probable that a 30-year look-back period would also be suboptimal. If you could weight 10 years higher than 20 and higher than 5, that kind of weighting would make more sense than weighting the most recent period highest. The example I began this post with shows the problem of weighting recent results too high.
[quote]
So I did another study. If I restrict the designer models to those with more than five stocks, the correlation of performance between last year and the year before last is -0.16 (i.e. an inverse correlation) while the correlation of performance between last year and the ten years before that (including backtested results) is 0.26.
[/quote]What about the correlation between 2015 performance and the ten years before that?
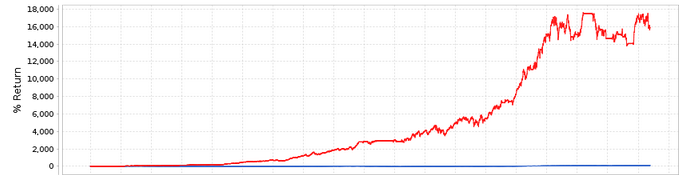
Now I’m beginning to see why backtested results are not displayed . . . This is a 10-stock model that went public over three years ago. The chart shows very clearly where the backtest stopped and the OOS performance kicked in.
Here are the results of my correlation study. I used 40 designer models with more than 10 stocks that have been active for at least three years and I tested the correlations between the performance over the last three years (one at a time) and the prior 1, 2, 4, 6, 8, 10, and 12 years.
The results were basically terrible. Especially if you look at rank correlation. There was basically no correlation at all except for the four-year performance, which was only 0.15. If you look at regular correlation, you can see a little bit in the six-year performance too. But besides that, it’s all very close to 0.
I think that’s because there’s a hell of a lot of curve-fitting going on. The example I just posted wasn’t the only one I saw. The way the performance dramatically falls off immediately after launch is crazy.
I attach the Excel file with my results.
I believe I would get better results if I were to look at alpha rather than CAGR, or if I were to limit the study to 20-stock and higher models, or if I were to measure aggregate three-year OOS performance–or all three of those. But that’s a project for another rainy day.
I would get far better results were I to exclude models that show signs of curve-fitting rather than robust backtesting (but that would have to be subjective and post-hoc, invalidating those results).
One takeaway, though, is clear. There is simply NO correlation between the OOS performance of a strategy over a one-year period and over the following one-year period. I tested both the last twelve months vs the prior twelve months, and the prior twelve months vs the twelve months before that. I even tested the last twelve months to the twelve-month period that ended twenty-four months ago, leaving out those terrible 5/2015-5/2016 months. And I found nil. Basing your DM picks on short-term OOS performance is a mistake.
[quote]
I would get far better results were I to exclude models that show signs of curve-fitting rather than robust backtesting (but that would have to be subjective and post-hoc, invalidating those results).
[/quote]Yuval, this particular model has a very objective curve fitting tell.
The oos flatline periods were not present in the backtests. That is clear giveaway that the buy rules were over optimized.
You have to understand that the original R2G system was designed to fail. The only way to attract subscribers was to put up the best performing simulations regardless of whether or not they made sense.
As for optimization, I am finding success by:
choosing an industry or subindustry that I expect to trend higher based on macro-economics (examples: cloud computing, defense)
find two or three best performing factors for the recent past (3 - 5 years)
create a highly optimized port using a ranking system with the optimized factors. Minimal buy/sell rules
Also I have two private ports that have been running for a while: Cyber Security and Tech dividends. The underlying universe for both of these and also the Cloud Computing DM are inlists created from ETFs. The OOS for Cyber Security and Tech dividends performance graphs shown below.
Georg very helpfully told me that I could use a Simulated Book with one asset, namely a designer model. So I ran equity curves doing that and used Excel for the correlation studies. I wish I’d known of that trick before! It gives you both the complete backtest and the OOS results (without any distinction between them).
One more reason R2G (Smart Alpha) is a bad idea. My view is P123 should get rid of it, but Fat Chance, some people are making a living off of it, and Marco thinks this is the way to the masses.
Overfitting with market timing is the most damaging, I think. If I overfit the rule of buy stocks starting with “A” because it captures AAPL on the backtest the port may not suffer too much. It probably will not outperform because the universe is too constricted. But I may not underperform unless stocks starting in “A” are having a bad year.
If I overfit with the rule of buy on a full moon and sell on the crescent moon I get the flatline with no performance. I am out of a generally rising market and I underperform.
But designers face serious pressure to avoid the drawdowns, I think.
Maybe I can look at “% invested” this weekend and see if this is actually an important factor and not just theory.
Maybe start by seeing if there is a correlation between “%invested” and the returns.
Yuval, thanks for sharing and bringing this back up as a topic for discussion. As we have discussed a few times on the boards before, I have been running statistical analysis like this for the past couple of years. My focus has been on monthly predictions, not annual, but I have seen similar results for short timeframes. One thing I will mention about your analysis is that you don’t really have a sizeable population to work from using simulations. I utilize the rolling backtest feature to create a decent sized database. My latest version has 695 data sets for 30 largely uncorrelated screens (5 stocks each), using a 4 week hold. Using that data set and looking at relative performance, I have found much higher correlations. Using raw performance has very little correlation. I only have 695 data sets because I use the first 5 years of data for development and roll it forward OOS to see how they perform. You could do the same thing on an annual basis, but I think the correlations will be low.
Your intuition on alpha is spot on. I evaluate my data using average return, Sortino, Sharpe and Alpha. Alpha has the highest correlation of the four. Sharpe is the lowest and Sortino and average are in the middle. All of them have the highest R-squared values around the 4 year range. I have tested longer periods, but the coefficients drop off.
Below is a data snapshot using 4 year Alpha to predict the next month’s returns. The R-squared for this data set is 82.6%. For perspective, the 1 year is only 11.4%.
In plain terms what this means is that if you invested in the top 3 screens based on 4 year alpha, then you would have an average monthly return of 2.71% vs. 2.1% if you invested in all 30 screens. The nice thing about this method is that is should avoid curve fitting and it will rotate away from screens as their Alpha starts to fade. Putting this together and updating it each week is a giant pain the a$$, but it is worth it for the additional 11% CAGR.
Not that anything in any of the text books should matter. Those guys are crazy. I guess it is just size (of the dataset) that matters after all. But,
rolling tests are not independent as the data overlaps.
You are taking something that may not have problems with being a time series (monthly data) and converting it to a time series–multiple 3 year time series. As you know the problem is that times series will often show correlations that are not real. Wow!
3)when you do rolling tests don’t months get included in the data more than once (in more than one rolling period). For a 3 year rolling average counting the same month 36 times!?!! Is that what you mean?
Counting a month 36 times will give you more data—no arguing that one.
Mike, just a rhetorical question: you should continue-on and don’t mind me. I’ll go back to my texts a figure out where they went wrong.
I hope things continue to go well with your investing.
Your post is really very helpful, and thank you for sharing your insights. I take it, though, that there’s no way to get rolling backtests for designer models, right?
I wanted to suggest two additional measures that I have found very helpful, equal to OLS alpha in my correlation studies: median excess return (the median of the differences between monthly return and monthly benchmark return) and LAD (least absolute deviation) alpha. If you’re using Excel, you can get LAD alpha by downloading a resource pack from real-statistics.com.
Thanks for the suggestion on the analysis. There is no way to do rolling backtests on screens from others. I have borrowed from some on P123, so my 30 screens are not all my own. It is a good tool to use for your own benefit.
Jrinne,
Your point about data overlap is a valid one, so let me add a bit more detail about how I do the analysis. Because I have to hold stocks for a minimum of 30 days, I basically roll 4 sets of portfolios. My start dates are 1/5/2004, 1/12/2004, 1/20/2004, 1/26/2004. After that everything repeats to your point. I also lag the data to account for timing of buys/sells so I am not using future data. I modeled the approach after many of the academic research papers that I have reviewed. I agree that text books and academia don’t always offer a realistic approach. My real world application is I turn 25% of my portfolio each week. I have also analyzed weekly data in the past, which doesn’t have the same data issues, and it also correlates well. I don’t bother updating it anymore since I cannot use it. I also did the same analysis from AAII data that was only monthly and found similar correlations. There is some overlap of the 4 time series sets that I use, but you would be surprised how uncorrelated they can be over time. If you want to test it for yourself, do 4 straight backtests using the dates above using 4 week holds and see how different the data is. One more key point, the Deciles in the previous post are not part of the data sets at all. They are single month returns from 5 weeks in the future.
Could this analysis be fool’s gold? Sure, but I don’t have a better way to choose a handful of stocks from the 150 stocks I have available each week from my 30 screens. It does make me feel better that generally the correlations are low in the short run, go higher as you approach 3-4 years and taper off longer term. I am definitely open to suggestions if anyone has a better way to analyze the data.