The use of technical analysis

I’ll throw in something concrete. I’ve found this useful to sell an over-bought holding and bump up the ports Avg Return.

Eval((LoopSum("Close(CTR)>BBUpper(60,2.0,CTR)",5)>=3)&(RankPos>X),1.0,0)

Here, set ‘X’ to the number of holdings (i.e. for a model that holds 10 stocks, set X to 10).

1 Like

Her are some of the best performing from danp`s excel sheet:

Pullback Loopsum( (close(CTR)-open(CTR)),5)/5 Universe Lower 10,4
Pullback RSI(8) Universe Lower 9,8
Pullback close(0)/lowest(#close, 50, 1) Universe Lower 9,7
Pullback rsi(10) - RSI(10,10) Universe Lower 9,7
Pullback (close(0)-Low(0))/(Hi(0)-Low(0)) Universe Lower 9,6
Pullback UpDownRatio(5,0) Universe Lower 9,6
Pullback close(0)/sma(10) Universe Lower 8,9
Pullback RSI(10) Universe Lower 8,5
Pullback ((Close(0) - Close(5))/Close(5)) Universe Lower 8,3
Pullback Close(0)/ema(10) Universe Lower 8,0
Pullback RSI(12) Universe Lower 7,9
Pullback (Pr4WRel%Chg-Pr52WRel%Chg)/abs(Pr52WRel%Chg) Universe Lower 7,4
Pullback close(0)/lowest(#close, 10, 1) Universe Lower 7,4
Pullback rsi(10) - RSI(10,5) Universe Lower 7,1
Momentum Close(0)/lowest(#close,10,0) Universe Lower 7,0
Pullback Close(0)/ema(5) Universe Lower 6,6
Pullback RSI(20) Universe Lower 5,9
Pullback Loopsum( (close(CTR)-open(CTR)),10)/10 Universe Lower 5,5
Momentum Price/PriceH Universe Higher 5,5
Pullback close(0)/lowest(#close, 5, 1) Universe Lower 5,5
Momentum Eval(Low(240)=Hi(240),(close(0) - Low(241)) / (Hi(241) - Low(241)),(close(0) - Low(240)) / (Hi(240) - Low(240))) Universe Higher 5,1
Pullback ((Close(0) - Close(10))/Close(10)) Universe Lower 4,7
Momentum ema(50)/ema(100) Universe Higher 4,4
Pullback Close(0)/SMA(20) Universe Lower 4,3
Momentum SMA(50)/SMA(200) Universe Higher 3,9
Momentum Loopsum( eval(close(CTR)<close(CTR+1), 1, 0),5) Universe Higher 3,9
Momentum Sortino(100,5,10) Universe Higher 3,6
Momentum Sortino(100,5,5) Universe Higher 3,5
Momentum sma(120)/sma(240) Universe Higher 3,5
Momentum Pr52W%Chg/Beta Universe Higher 3,4
Pullback Close(0)/sma(50) Universe Lower 3,2
Momentum (close(20) - close(220)) / close(220) Universe Higher 3,1
Pullback Close(0)/SMA(5) Universe Lower 3,1
Momentum (Pr4WRel%Chg-Pr26WRel%Chg)/abs(Pr26WRel%Chg) Universe Lower 3,1
Momentum Pr52W%Chg/PctDev(52,5) Universe Higher 3,0
Momentum Pr26W%Chg/PctDev(26,5) Universe Higher 3,0
Pullback Close(0)/ema(50) Universe Lower 2,8
Pullback Loopsum( eval(close(CTR)>close(CTR+1), 1, 0),20) Universe Lower 2,8
Momentum Pr26W%Chg/Beta Universe Higher 2,6

Thank you! Nice. It improved both performance and “overall winners” compared to my “test” system:

Test system:

Adding sell rule:

Do you use a similar buy rule to avoid overbought stocks?

Yuval,

I have not done a lot of testing of technical factors… But these were the strongest of the technical factors by any statistical tests that I did do.

Perhaps no coincidence that you mention this first. But again there are a ton of technical factors that I have not even looked at and I would not disagree with anyone who believes they have found better technical factors.

Best,

Jim

I’ve experimented a bit but not enough to use it in my models.

BTW, from your list, the following is a biased indicator. It favors low priced stocks. If it were a percentage, that concern would go away.

Pullback Loopsum( (close(CTR)-open(CTR)),5)/5 Universe Lower 10,4

Mr. @Whycliffes, sir!

Thanks for your excellent posts. I fear my I/Q is getting in the way for some parts of your posts, so I am hoping you can help me understand.

  • When you said " danp`s excel sheet", which excel sheet are you referencing?
  • When for the first rule you wrote “… Lower 10,4”, I assume that the “Lower” means lower is better, and I assume the “10,4” is the European notation that we in the US would write “10.4”. But what does the “10,4” signify?

Sorry, Mr. @Whycliffes, sir! I accidentally hit “Send” before I was finished. Now to more of my questions…

  • You have as your ranking system “AAA US 15 Total rating API 500N uten yt sine”. Is that the name of a private ranking system or is it a public one? I ask because I am so ignorant of a large part of the P123 web site.

Thank you for your replies,

Cary

Thanks. This same rule can be simplified by taking out the Eval as:

LoopSum("Close(CTR)>BBUpper(60,2.0,CTR)",5)>=3 & RankPos>X

True. But the given form was used to realize partial sells. I kept in that form to facilitate testing under the optimizer.

I see. It makes sense.

Take a look at the last post from danp here: Single factor testing tool developed using the API - #26 by Whycliffes

You will find the spreadsheet from danp.

There is a score in the right column, and yes lower is better :slight_smile: And yes your are right on the notation.

The score is a combination is based on:
image

There are some comment in the top cells on how the total score is calculated.

This is my private one, it’s just a testsystem I used to see if: “Eval((LoopSum(“Close(CTR)>BBUpper(60,2.0,CTR)”,5)>=3)&(RankPos>X),1.0,0)” would improve the performance.

Thank you so much, Mr @Whycliffes , sir!

You have pointed out something in this post that may have saved me a good bit of suboptimal work. As for the spreadsheet, as I described in this post located at Explanation for List of factors.xlsx spreadsheet and the ranking of rank factors - #6 by carymac07, I figured out almost all of the causes and the data made a lot more sense. But now for something for which I need clarification.

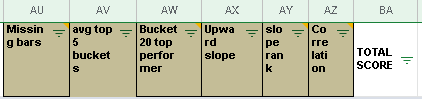
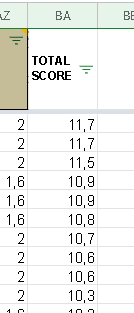
Your post shows the columns AU through BA, with BA “TOTAL SCORE” being the one to use. I had been using the column AE “avg top 5 buckets” and column AS “Top 5 rank”. Now you indicate that I should use column BA “Total Score” sorted low (good) to high (bad). As I look at the columns, shouldn’t I focus on column BB “Rank” sorted low (good) to high (bad)?

I want to thank you very much for your post, because as of Thursday I have been performing simulations of each single factor (sorted by column AS “Top 5 rank”) for 6 different stock universes using 3 different rank sell rules, i.e., “Rank < 95”, “Rank < 60”, and “Rank < 40” instead of the one that what was intended to be used.

And I will try out your use of Bollinger Bands as you showed.

Thank you again,

Cary

I use BA, high to low:

image

But I have tried several of the other columns also, just as a test. But the total score gives a good indicator on nodes that can be used in a rankingsystem.

Thank you so much, Mr. @Whycliffes , sir!

Here is some info related to technical analysis in general you may find interesting:

  • The book “The Encyclopedia of Technical Market Indicators”, 2nd edition, by Robert W. Colby, published in 2003. In this book, Mr. Colby looks at over 200 different technical indicators and assesses each indicator’s performance by itself, akin to @danp’s spreadsheet for the different stock factors and formulas. It includes our beloved Chaikin Money Flow indicator, as well as different moving averages, MACD, Bollinger bands, etc. While there are most likely more recent books, this is still worth your time.

  • The book “Evidence-Based Technical Analysis” by David Aronson. While you may already know the material in the book, it shows a (the ?) proper way to test the validity of technical analysis indicators.

I hope these 2 books help.

Cary