Here’s a link to a sim I created this morning based on Value Line Performance ranks:
https://www.portfolio123.com/port_summary.jsp?portid=1122757
It’s not the be-all and end-all of anything; just fiddling around getting the feel for ways to use it in conjunction with p123 capabilities. I just want to share some general thoughts:
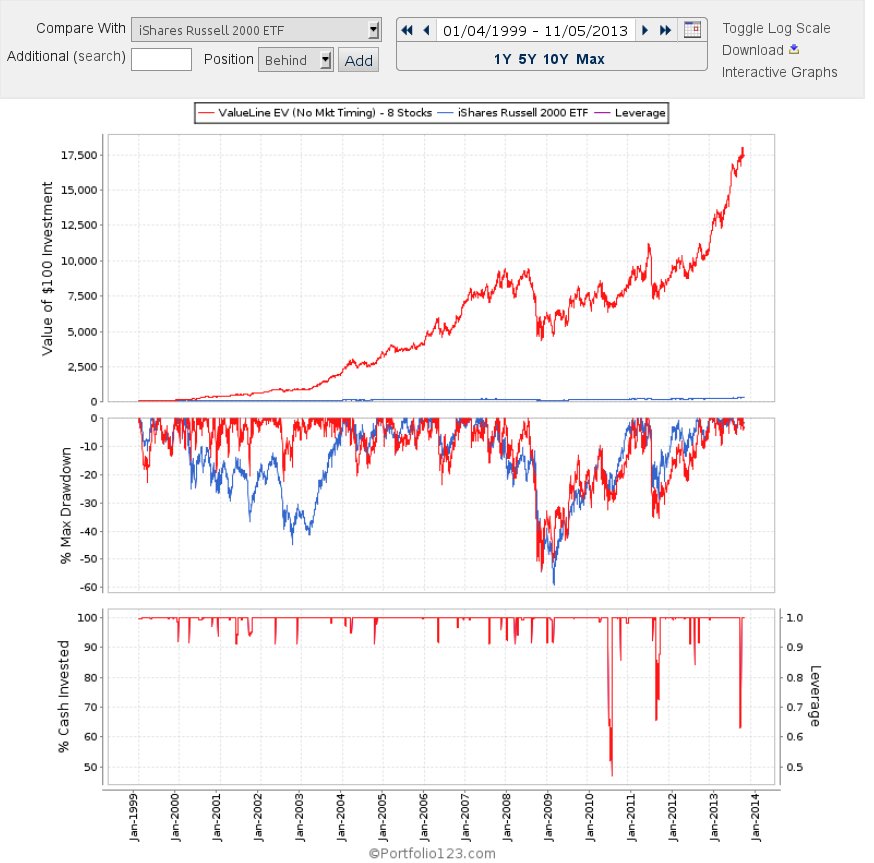
Many people think of VL in terms of investing in 1s or 1s and 2s. That’s certainly a valid approach (and I did OK with some screens along those lines). But don’t forget the alternative to buy-the-winners. We can also use Value Line to identify and eliminate the low end. The sim is run off a universe I created with just one rule: VLPerf<=3 (IOW, rather than chasing the top, I just look to weed out, right at the outset, the 4s and 5s).
In addition to using VL for screening rules, consider doing your own thing with rules and ranks but do them based on a universe created based on VL.
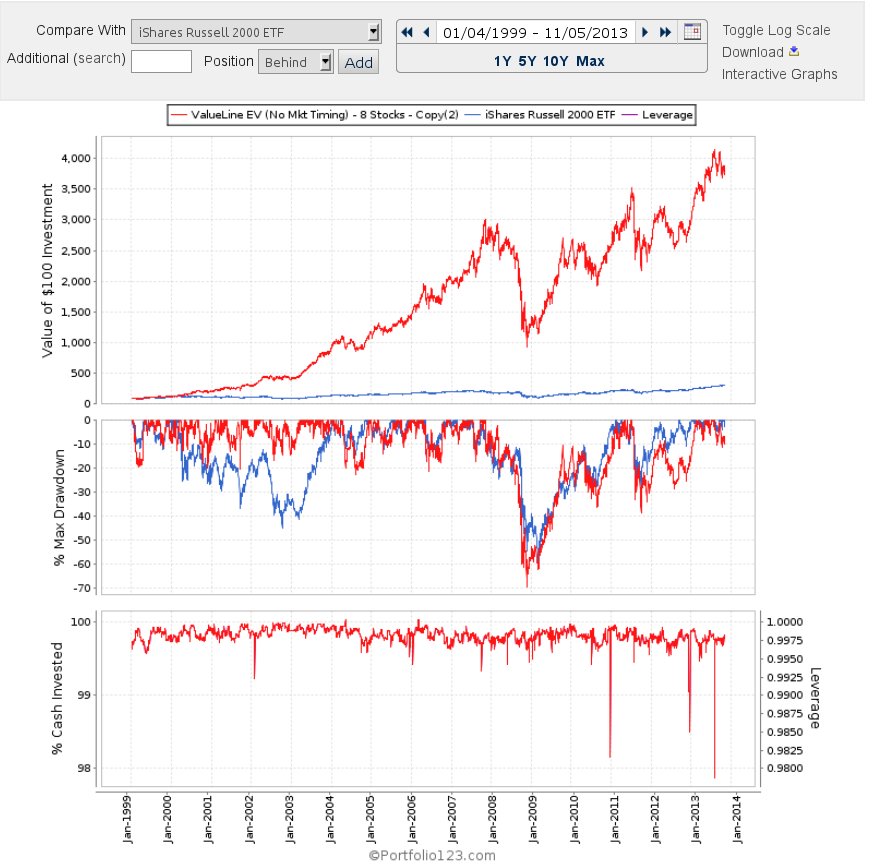
If you use VL factors, remember to use a Russell 2000 benchmark (I use the Russell 2000 ETF to capture the dividends).
I recall last week somebody posted something to the effect that if you use a reasonable liquidity filter, which he defined as $1 mill, performance of stocks well-ranked by VL only matches the Russell. Yes, that’s right. But remember what this product is: it’s the Value Line “Small and Mid Cap” Survey. Setting a liquidity filter to $1 mill wipes out about a little more than half the rank 1 2 or 3 universe (and also, more than half the entire ranked VL universe). That’s not a realistic way to use this material. When I set minimum liquidity to 300k, my VL 1 2 or 3 universe as a whole outperformed ( a little over 200 basis points per year) and with positive alpha and 1.84% annual alpha (let’s remember that in the real world, any alpha above zero is considered spectacular). What this means for R2G is something model designers will have to determine for themselves. But I can tell you individual and professional investors have done fine with these ranks with real money over many years as have institutions (although as a matter of course, the latter do not try to establish or close entire positions in one shot with one trade but do so over the course of days, weeks or sometimes months; not just with VL small stocks but with any small stocks).
Remember, too, there’s no rule that everybody must always max out on p123 automation. Many p123 users runs screen-ranking models not necessarily to trade everything but to look for ideas – looking at companies one at a time. For those who use p123 this way, combining your own p123 ideas with VL ranks can lead you to some really terrific ideas. When I look into stocks/companies produced this way, I’m finding myself much less likely to go “Eeew …how did that piece of **** make it onto the list?” We can never be completely free of stocks that pass the letter of the law but fail the spirit of the law, but it sure is helpful if we can reduce the occurrence of this sort of thing.
Anyway, be creative with this stuff and HAVE FUN!