WHICH ANOMALIES ARE LEGIT?

Nice paper Chris, thanks.

My first impressions:

He tested every “known” (i.e. published) anomaly. He used market cap weights and measured performance of tenth decile minus first decile. This means that his results are directly applicable to us who use equal weights.

[color=crimson]Stock price reaction to earnings announcements should be simple enough for Portfolio123. Unfortunately and surprisingly, they dropped the ball on this one. There seems no way for us to accurately model this, despite the fact that we seem to have the data.[/color]

Chris,

Lovely post, Chris. You greatly added to my Mother’s Day reading, much to the chagrin of mothers of the world.

First impressions:

  • Not all that surprised by paper’s conclusion, but mildly feeling vindicated.
  • Also, says “Our results indicate widespread p-hacking in the anomalies literature.” Uses p-value of .03. … teeheehee

Chaim,

Seem like we should be able to model this. Can you explain where the difficulty lies?

Nice to see some of you are developing an appreciation for statistics!!! At least when someone else has done it.

The only thing better than this paper would be to find that your own studies confirm these studies and that the anomalies are working for you. Then you could be really sure that you are on solid ground—and get rid of the trash once and for all.

Not that I am done or that I have even gotten a good start yet. And it is true: [color=darkblue]P123 is a statistics platform[/color] with backtests and rank performance tests often telling you all you need to know without a formal t-statistic or p-value.

You can do some things that aren’t in this paper. You can add-in slippage up front. Do you really want to compare the upper decile to the lower decile? Why not look at what you are really interest in: the upper decile compared to the benchmark.

P123 in not just a statistics platform: P123 IS A GREAT STATISTICS PLATFORM USING THE SAME DATA SOURCE AS THIS PAPER!

Thanks Chris.

-Jim

David (primus),

To model stock price reaction to earnings announcements, we would do something like this:
Close(BarsSinceAnnouncementQ0 - 3) / Close(BarsSinceAnnouncementQ0 + 1)
But we are missing a variable. How do we estimate the number of trading days since the earnings announcement?

What’s your formula?

Not that I am paranoid about such things, but what if these researchers for the National Bureau of Economic Research wanted to ‘prove’ that, quote, “In all, capital markets are more efficient than previously recognized.”
If one does not verify their findings, then it would be more fuel to the fire that if you are beating the market, you must be doing something ‘odd’ ,ie, illegal…
Not that I am paranoid…

If you got 100 billion hedge and there is almost no way you beat the sp500 long term. Buffet gave away a lot of bets to big
hedge fund managers, but they did not take them or lost not beating the sp500.

If you have a port of 1 Million there are a lot of “anomalies”, a lot more then they find, because they will make an Assumtion
on liquidity and port size and transaction costs and slippage that is based on a bigger then 1 Million port.

With a small port like a million, Size (lower market cap), low vol, value, momentum (though only slightly weighted, 10% is enough) do
work just fine and there will be other niches as well with that kind of small port size…
Regards

Andreas

Like typical academic fools, Hou, Zhang, and Xue publish their results. That is great for science, stupid in finance.

The most important thing I have learned in 25 years in markets is that if you tell people about something, it won’t work anymore.

If you don’t have an edge, you won’t win as a trader. If you give away your edge, you no longer have an edge.

I you don’t believe what I just said, then you should quit trading and go work in academia :slight_smile:

Buffett makes the S&P bet… but a lot of people beat the S&P for Sharpe ratio and if you manage money carefully, that can be the most important stat.

How close does “LatestActualDays” get you?

I am looking at 1-month drift vs. standardized unexpected earnings.

messier11: I disagree, “annomolies” (I hate this work, basically we are using hacks to expolit human behaivour!) are based on human behaiviour (everything that works is hard to do: e.g. Buying Value, Buying Small caps, Buying momentum, buying an all time high on the Indexes etc.) and niches that are too small for the big
guys, so they are persistent.

Its like, ohh, we now know how to get skinny: eat healthy and do exersice and take hormons (something a lot
of People do not know: look up DHEA and Pregnenolon if you are older then 35!). Yeahh, we are all going to be skinny?

No way: because
it is very hard to do, so edges that are hard to implement will persist as long human behaiviour does not Change.

90% of the game is your dicipline, not your IQ, otherwise everybody would be a millionare here at p123 in about
5 Years with a port of 200k to start! This is not the case because easy looking things are hard to implement.

Regards

Andreas

Here is the critical sentence in the paper, the one that opens Section 3.3.1: “Empiricists in the anomalies literature have much flexibility in test designs.”

Ere’s an example with one of his factors, dividend yield ( he labeled it a.2.14 Dp, Dividend Yield and this is from page 76 of the pdf):

“At the end of June of each year t, we sort stocks into deciles based on dividend yield, Dp, which is the total dividends paid out from July of year t−1 to June of t divided by the market equity (from CRSP) at the end of June of t. We calculate monthly dividends as the begin-of-month market equity times the difference between returns with and without dividends. Monthly dividends are then accumulated from July of t − 1 to June of t. We exclude firms that do not pay dividends. Monthly decile returns are calculated from July of year t to June of t + 1, and the deciles are rebalanced in June of t + 1.”

Based on the testing approach, examining the significance in return between the top and bottom decile, the authors got what they were supposed to get; no benefit.

High yield dividend-paying stocks are not supposed to outperform low-yield dividend-paying stocks, If anything, we expect the reverse. High dividend yield is such because the market expects the dividend to be cut or eliminated, and the market’s track record in predicting this sort of then has been pretty good. If you want to use yield as a factor, you have to create a specialized sub-sample defined by companies for which dividends are not likely to be reduced or eliminated.

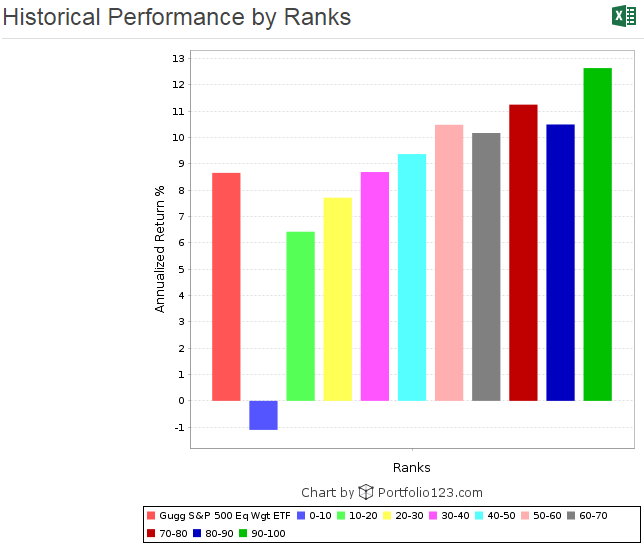
The same holds true for every factor. None can ever be expected to work for an entire universe; all have to be applied to a subset. For example, low P/E can only be preferable when applied to a universe of companies with better growth potential and/or less risk than the market assumes. Etc., etc. etc.

The paper proves a point, but it looks like it’s not the one they thought they were proving. They are proving that pure mega-sample quant analysis accomplished nothing. And this is a great thing for us. Unlike researchers like this, we have screening/buy rules and custom universes, so we can study and profit from anomalies don’t even know enough to be studying. So the more papers like that come out, the better things get for us as our trades can get less crowded.

As for the use of statistics – it’s great BUT BUT BUT:

S - DK = BFM
-DK = CSD

Therefore,

S + CSD = BFM

And,

BFM = OPU or S - DK = OPU or S + CSD = OPU

where,

S = Statistics
DK = Domain Knowledge
BFM = Big Fu**ing Mess
CSD = Crappy Study Design
OPU = Opportunities for Portfolio123 Users

Marc,
I cannot help but think about Piotroski’s study and the Piotroski score (not to be confused with recommending Piotroski models to anyone).

He found that a low Price to Book has opposite effects depending on the Piotroski score.

Aronson says a similar thing: “….relevant information is contained in the web of relationships (interactions) between the variables. This means that the variables cannot be evaluated in isolation as they can in a sequential/linear problem.”

The Piotroski example is just an example of what you are saying, I think. Aronson says this in a formal way that sounds official. But he does not say it any better than you do (assuming I understand what you are saying).

And I do think there are “OPU” by combining factors and functions or using universe restrictions or buy/sell rules that are not evident in this data. BIG TIME!!!

Great points IMHO. And regarding the above equation: LOL.

-Jim

primus,

This close. Thanks.

EDIT: This is a one-factor ranking system based on the factor in the paper with the highest T-Stat.


Is that your blog, Primus?

http://the-world-is.com/blog

From the paper… backs up what I said earlier…

"Schwert (2003) shows that after
anomalies are documented in the academic literature, they often seem to disappear, reverse, or
weaken. McLean and Pontiff (2016) study the out-of-sample performance of 97 anomalies, and find
that their average high-minus-low returns decline post publication. "

It is true that Fama & French wrote about the small size premium in 1994, and from Jan 1995 thru Dec 1999 the S&P 500 tripled while the Russell 2000 merely doubled. And the S&P 100 beat the S&P 500 during that span.

Whoops!

I’m not sure, however, that Fama’s publication had anything to do with that.

I believe these factors rotate. At times, small caps lag. At other times, small caps lead. At times, value leads. At other times, value lags. At times, low volatility stocks lead. At other times, they lag.

I don’t think this is indictment of the anomaly per se. Just the nature of the beast. In other words, the anomalies surely exist. But they are surely never permanent. The good news is that they seem to recur after they’ve fallen out of favor for awhile.

This is why I wish there was a way to rank ports in a book to select some but not all of the ports in the book . . .

Or that the company’s growth prospects are approaching zero; i.e., it’s a cash cow. It doesn’t change Marc’s point at all, but I thought that it had to be said. :slight_smile:

Yes, that’s another issue in the study, one I forgot to mention in my prior post. A mega-sample from 1967 to 2014 is fine if one is seeking universal truths, but given the way structural change in global economies, financial markets, etc.is the norm rather than the exception, it’s not likely any investor or trader can make money based on anything gleaned from such a study. If I’m seeking to vindicate the forces of truth, knwoedge and wisdom, my models should incorporate factors that would allow them tol flourish if the CPI was rising 15% annually. That would make me wise and a hero to factor researchers. But I’d probably have to drive an Uber to make ends meet.

Messier,

www.the-world-is.com is my blog.

I incorporated much of this conversation into Postulate (8) within: http://the-world-is.com/blog/2017/04/axioms-of-asset-valuation/.

OPU = Opportunities for Portfolio123 Users

Yes, Yes, Yes. 100% Agree with Marc!