I see in my own backtests and in the design model portfolio that there is a clear, significant difference between backtest results and out-of-sample results.
This holds true even for those who claim to have performed a series of stress tests to ensure there isn't too much over-optimization. I recall reading a post from Yuval some time ago, in which he expressed reasonable satisfaction with a result where the out-of-sample live return was half or two-thirds of the backtest result.
But the question then is, has anyone conducted any thorough assessments or investigations or seen any studies that can shed more light on this and perhaps suggest how to incorporate better criteria into our backtests to reduce this gap?
I utilise liquidity files to ensure I am using liquid stocks. I break this down into sub-universes to test it across different universes and various sub-periods. There is no issue with "survivorship bias" in the P123 data. I avoid too many single rules in universes and simulations to prevent individual overfitting.
What do you all think are the most critical reasons, or what have you observed?
Are there regime changes in the market that cause this?
Are the rules in the ranking system too complex?
Are there too many rules in the ranking system?
Is there too much testing of the strategy, leading to indirect over-optimization?
Is there a poor ability to follow the model afterwards due to human factors?
Is it because the factors we find are arbitrated away?
Is there so much noise in the market that it is unlikely and impossible to use backtesting for future results?
Yes — this exact gap has been studied rigorously, and the findings converge:
Harvey & Liu, "Backtesting" (JPM 2015) — formalizes the industry's 50% haircut on backtested results, then shows a flat haircut is wrong: below ~0.4 Sharpe the appropriate haircut is usually more than 50%; above 1.0 Sharpe it's at most ~25%. Marginal backtests are mostly noise; strong ones survive better. Rdrr.ioCME Group
Falck, Rej & Thesmar (CFM, Quantitative Finance 2022) — published anomalies deliver about 50% of in-sample performance out-of-sample. They also tested why: overfitting proxies — the number of operations needed to compute the signal, and the sensitivity of in-sample Sharpe to outliers — have real predictive power for decay, while arbitrage-related variables contribute only marginally. EconPapers
McLean & Pontiff (Journal of Finance 2016) — returns are 26% lower out-of-sample and 58% lower post-publication; decay is worse for higher in-sample returns, and returns hold up best in high-idiosyncratic-risk, low-liquidity stocks. SSRN
Suhonen, Lennkh & Perez (JPM 2017) — 215 bank alt-beta products: median 73% Sharpe deterioration backtest-to-live, with the most complex strategies decaying over 30 points more than the simplest. SSRN
Mapping that onto your list: too much testing is the best-evidenced cause — the strategy you deploy is the max of many trials, and that selection effect alone explains roughly half the decay before anyone trades against you. Complexity/rule count is second and directly measured (CFM's operation count, Suhonen's complexity result). Arbitrage is real but second-order, Regime change is usually the story we reach for when overfitting is the actual culprit. Human factors are a real but separate behavioral gap. And "backtesting is impossible" is refuted by the data — OOS keeps ~half the edge on average. Discount, don't despair.
What to build into the process: log your trial count and apply a multiple-testing haircut (Harvey-Liu's haircut Sharpe, or Bailey/López de Prado's deflated Sharpe); require t-stats near 3, not 2; judge strategies on median performance across configs and sub-periods, never the best run; stress-test outlier dependence (delete your best handful of months — does the edge survive?); prefer fewer, simpler rules; and write down your expected live haircut before launch so you can score the model against a pre-registered number instead of a moving target.
I like the comments about complexity- Only Anecdotally speaking, but frequently when I try to tune up a well built strategy by adding new rules, I find it deteriorates out of sample; whereas removing rules adds to robustness- I’m referring to buy and sell rules here, not sure how it applies to purely fundamental ranking factors-
The point of optimization is to come up with a system that is likely to outperform other systems on the whole, given the probabilities. It is NOT to predict performance. Nobody can optimize a system and then use it to predict performance. It's never been done, it never will be done.
If you want to predict performance rather than optimize, use a ranking system you created a long time ago and run it strictly out of sample with at least a three month gap between the creation of the system and the beginning of the simulation. That should give you a rough idea of potential performance. Once you even begin to optimize, you've infected your performance numbers and rendered them useless for prediction.
The way optimization works is that you try to figure out what system will be likely to outperform other systems, and you go with the one that is most likely to outperform. You do this by calculating performance measures, of course. But you treat them as relative, not absolute.
And if not optimizing the weights (using 1/N for each factor style). Noting that there will be some optimization just by factor selection and universe definition. What decay should one expect in live versus sim?
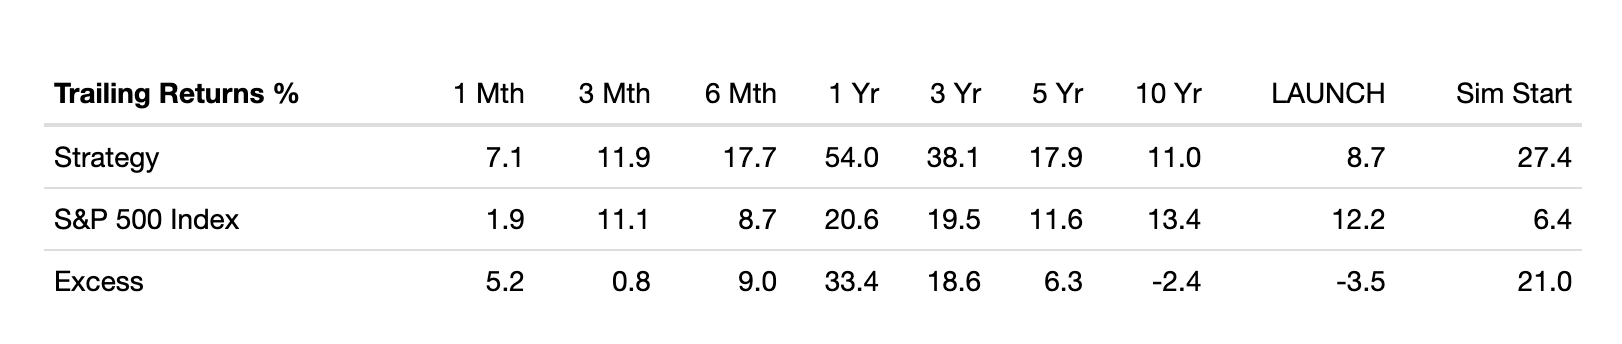
We can quantitate this to a large extent. Comparing LAUNCH to Sim Start for the Designer Models is not exact the same as comparing in-sample results to out-of-sample results, but it will give you some idea of the decay designers experience (27.4% CAGR for Sim Start and 8.7% for LAUNCH in this model). This is for Keating's E-Z Mid Cap Trader:
Conclusions: I chose Keating’s model to avoid commenting on any active member’s models. Looking at other models is see there is a wide range of decay in the designer models. Wider than I expected with some showing a lot of decay and some showing little or no decay. I am less sure of any general conclusions about what decay to expect than when I started looking at this.
It would be interesting–if we had easy access to just in-sample and out-of-sample Designer Model results–to see what the correlation between the two is.
Why should there be any relationship other than a very vague relative one between sim performance and live performance? Saying that there's a "decay" implies a relationship between two numbers. But there is nothing in logic or data or mathematics that would say that there's any relationship between them. The only relationship is probabilistic: a simulation with a CAGR of 12% would be likely to underperform a simulation with a CAGR of 35% if curve-fitting could be entirely eliminated (and it can't by the very nature of the beast). But the actual number a simulation gives you is entirely meaningless.
As a supplement, we can calculate the performance decay using this simple formula: Performance Decay = 1 - (Live Excess Return / Backtest Excess Return)
Using the numbers from your example: 1 - (-3.5% / 21%) = 1.1667 (representing a 116.7% decay)
@marco, what are your thoughts on implementing a decay metric directly into the platform? I understand, we are still waiting on the 'Return 10Y' feature, so I understand it might not be a quick update, but it would be very helpful to have in the future.
It would be nice to have this metric for the training data versus validation or test data in the machine learning module too. Most if not all Kaggle (or professional) machine learners will output the training metrics in the validation runs as you know.
Use case: People will see that at least for some of their models sglinski is right. He is aware that at least for some models overfitting harms the out-of-sample performance.
It is really hard to get over the idea that improving the backtest performance will always improve the out-of-sample results. To believe it you really have to see it. One way to get an intuitive sense of this would be to see this in the machine learning module.
Specific example, when we run a grid-search on elastic-net regression regularizers can improve the validation performance but the training metrics will be worse. If we can see that often in our models, we will get an intuitive understanding of this entire thread.
In other words, I would extend @pitmaster’s idea to the train/test data in the machine learning module substituting Training Data Excess Returns for Backtest Excess Return and Test Data Excess Returns for LiveExcess Return in his equation:
The in-sample vs. live performance gap widens with more exotic ranking systems, weird factors, complex buy/sell rules, and heavy optimization — essentially cherry-picking the best performer out of thousands of possibilities.
Key mitigations:
Follow Yuval Taylor’s mindset: optimize for relative outperformance (use averages across configs)
Stress test thoroughly: Run the ranking system on sub-universes and outside its original set, remove factors, change weights, vary position sizes, and check stability over long periods and different regimes. Portfolio123 has many strong threads on these methods.
Favor simplicity — adding rules often hurts OOS robustness.
Apply multiple-testing corrections (Prado’s deflated Sharpe, Harvey & Liu haircuts) to avoid over-optimism.
One thing I've noticed with my AI systems is that, they track their backtested historical results fairly well, and they tend to put very little weight on Market Cap. For a long time I felt like the AI systems were being a bit dumb about this... but after using them for a long time and stress-testing them from every angle, I've come around to thinking they're just seeing something we refuse to see: the smallest companies are a minefield, and it doesn't take much to get burned. So Market Cap as a factor/catalyst isn't nearly as reliable as we'd like to treat it.
Most of my classic ranking system carries a fairly high weight on Market Cap (lower is better), and most other ranking systems I've seen people trade off of do the same. Is this a mistake?
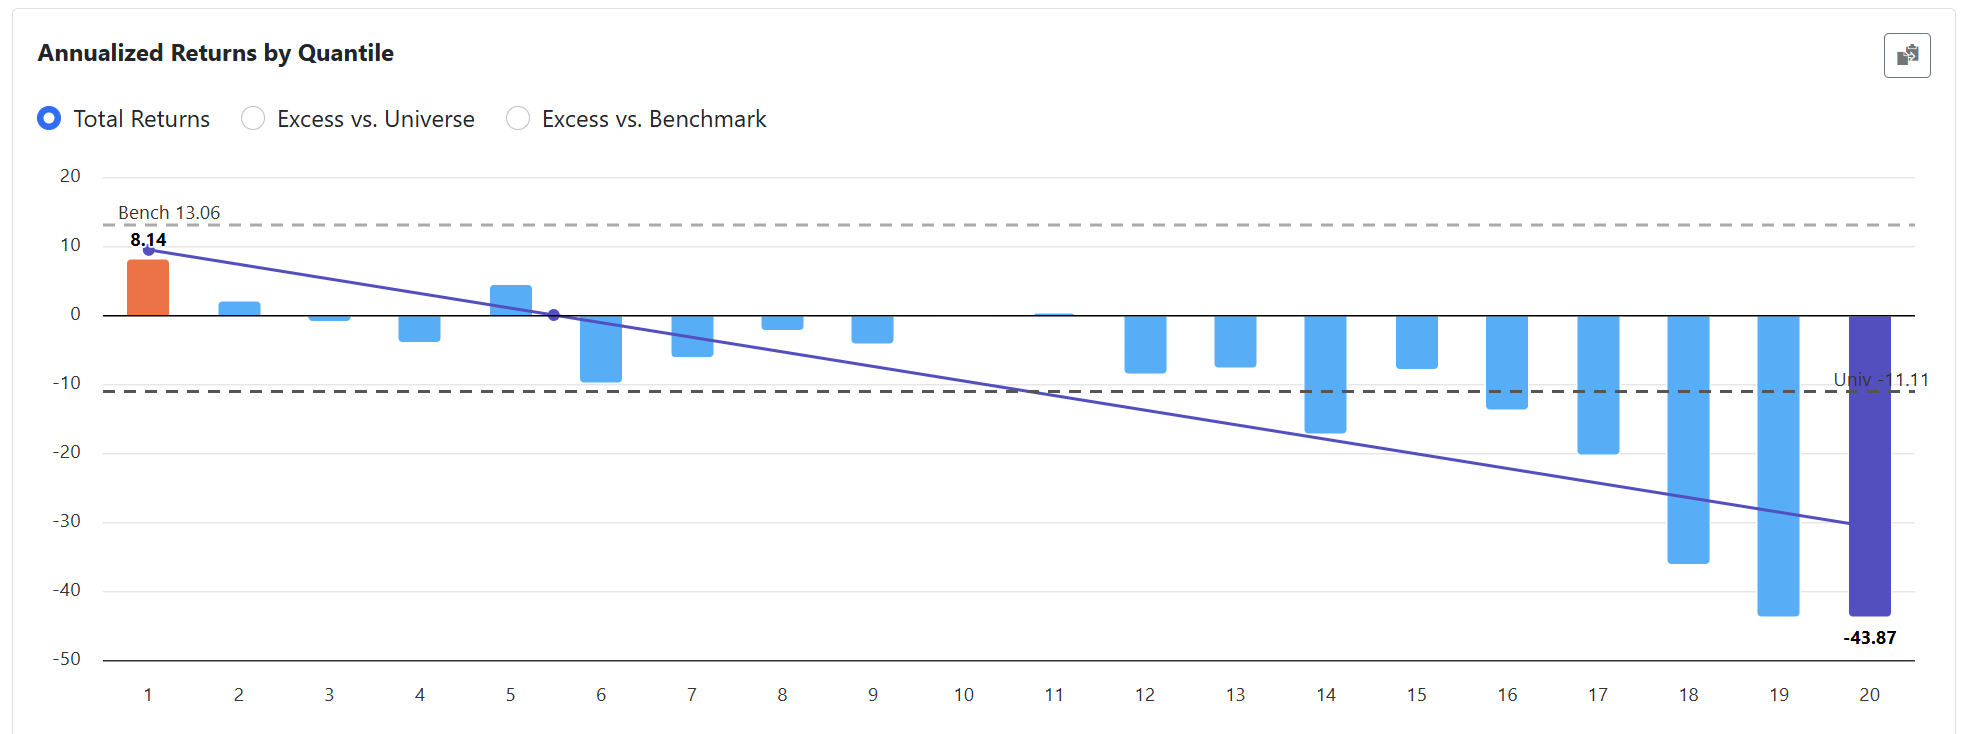
Below is a screenshot of returns by Market Cap quantile in the microcap space I trade, over the last 5 years, lower is better. As you can see, the tail is brutal, mistakes will be costly.
So anyone with a high weight on Market Cap in their classic ranking system — myself included — is really fighting an uphill battle here. I suspect a lot of us have simply overfit our systems to the Market Cap factor.
I tried to look a bit more at the available design models, and it is probably true that most of those currently available are aimed at small-cap, but also when I look at the large- and mid-cap segments of what is available, many of them also seem to fall significantly after launch, though this could be due to strong "Over-optimization".
Otherwise, I agree; small and micro-cap sometimes fluctuates enormously... and it might be easier to over-optimize to a small-cap segment
When you talk about varying the position size (e.g., 25, 50, 100, etc.), what exactly are you looking for? Are you expecting to see only a small amount of performance decay, but nothing too drastic? Or what is the main thing you're trying to evaluate?
Exactly as you said, some kind of degradation...it depends on how huge the universe is , in the end you are trying to capture more fish with nice characteristics (your factors) in the same ocean...and you know how are oceans nowadays ,same with subuniverses
I think this is similar to what Kahneman writes about in the book Thinking, Fast and Slow. There was a study showing that the most successful schools tend to be small schools. That is a real statistical fact, and a lot of money was subsequently spent by the education department making schools smaller. But they stopped doing that when they realized the worst schools were also disproportionately small.
School size wasn't a causal factor or even a confounder; it was simply a manifestation of higher variance in smaller sample sizes.
We see the exact same thing in quantitative modeling: small-cap and micro-cap stocks exhibit a much wider range of results. I don’t want to over-generalize—I cannot say that using market cap as a feature in a model is always bad. But it is fair to say that it will almost always increase the variance of your model. And overfitting a high-variance model is exactly how you manufacture spectacular backtested returns that fail to replicate live.
It’s like looking at that small Kentucky school, Oneida Baptist Institute. It looks incredible if you measure it by the outlier success of an alumnus like Jensen Huang (CEO of Nvidia), but betting on the school's long-term performance because of that single data point would be a mistake. Small schools, like small stock universes, naturally yield extreme variance.
Extreme variance that can become a particular problem when coupled with overfitting of other features.
Developing models doesn't seem like a complex task to me if you look at it from a simplistic point of view:
- Simple universe
- Simple ranking
- Rules that control risk rather than boost performance
The most important thing is the initial hypothesis, much more so than the backtest. To do this, I believe it's necessary to understand the nature of each factor and how they interact with one another.
Ever since I understood this, all my models have improved significantly, especially with big caps.
Thank you Yuval for elaborating. Then I think I must have misread your previous blog post about backtesting period (what backtesting period correlates most with future returns). For that blog post, were you also talking about relative performance? You did not mean “ if we have a 10 year backtest showing a 40% cagr, then its also likely to return similarly in the next few years” but rather “ if system A outperforms system B in a 10 year backtest, then it is likely that system A will outperform system B in the next few year.” Is that correct?
Market cap is an augmentative factor. It doesn't work on its own--in fact, it's very dangerous to use on its own. But it augments the performance of other factors. This is true no matter what period or what universe you use. If your AI models don't recognize this, there's something wrong with your AI models.
And what could be wrong with them? Well, to begin with, if you were designing a system to evaluate stocks based on future performance, favoring neither long nor short, you would leave market cap out as a factor, because it augments results on both ends. If you use market cap lower better, your highly-ranked stocks would outperform and your low-ranked stocks would not underperform very much. If you use market cap higher better, your low-ranked stocks would underperform terrifically but your highly-ranked stocks would not outperform very much. An evaluation system that is neutral will not use augmentative factors unless it can use them bidirectionally, which ranking systems can't do.
Can AI systems? I don't know. I would assume tree systems could learn to favor low market cap on both ends and high market cap in the middle, but I don't even know if that would help.
The only way market cap is a useful factor in a ranking system is if you're only going long or only going short.
If your AI models are not using market cap, then I would guess that they're NOT designed for going only long or only short. It's not because market cap doesn't work. It does work. It works extremely well. But only for unidirectional ranking.
 ,same with subuniverses