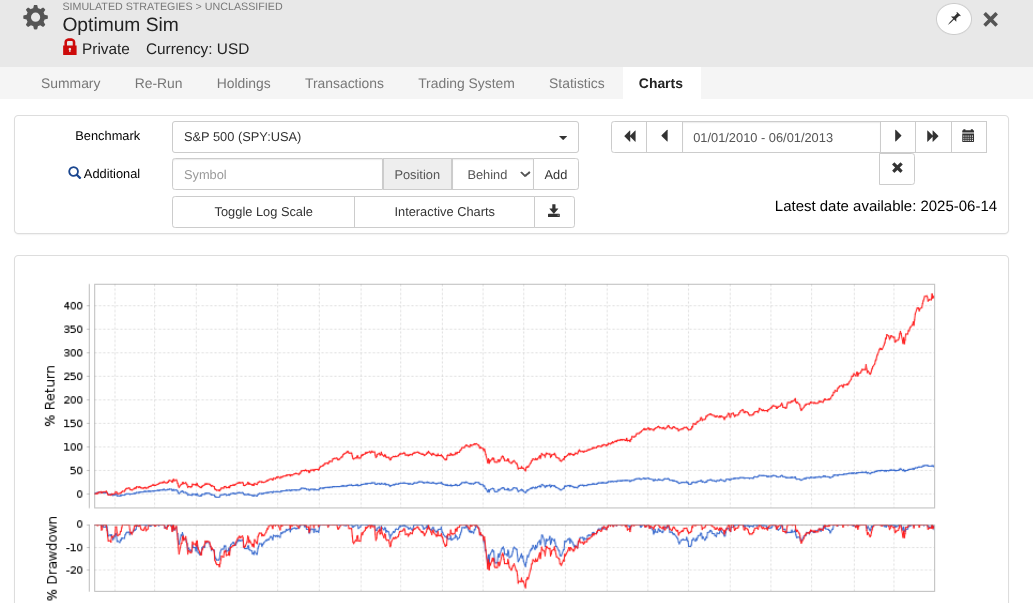
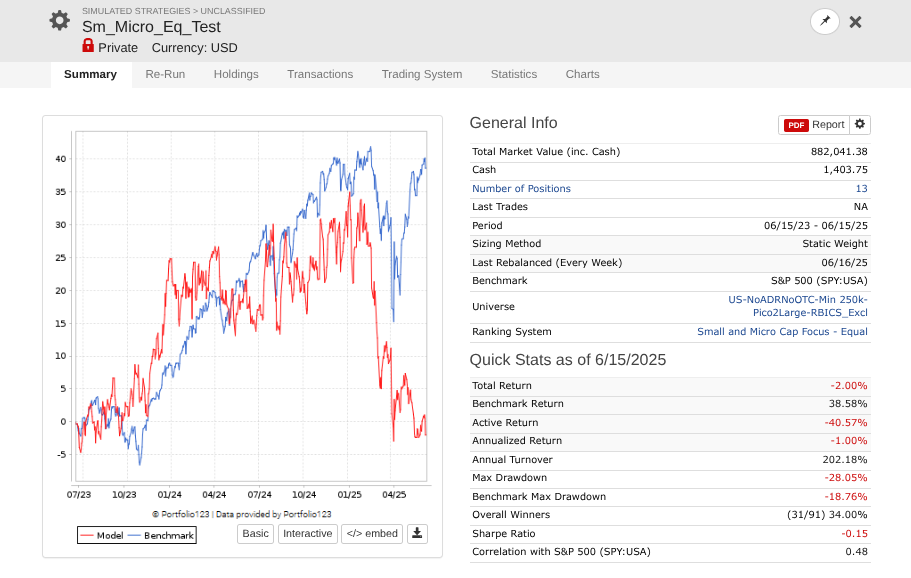
So I took a year off to evaluate how my models performed OOS, and man, is it UGLY for nearly every long system! Surprisingly, the short system is fine...
Anyone else having problems? Does anyone have thoughts here on what I could do better?
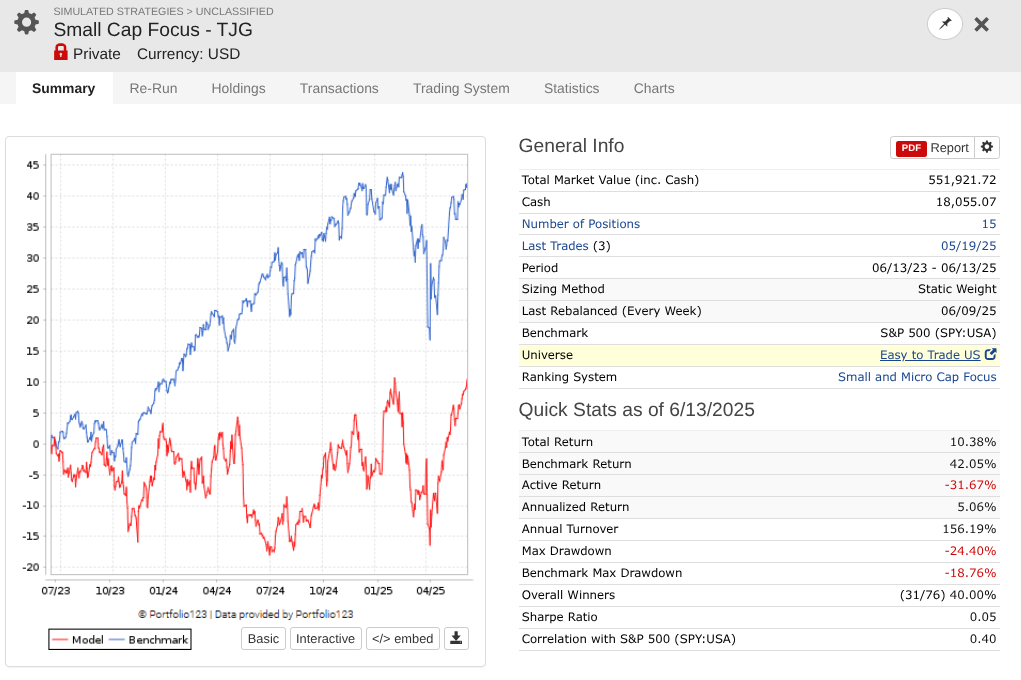
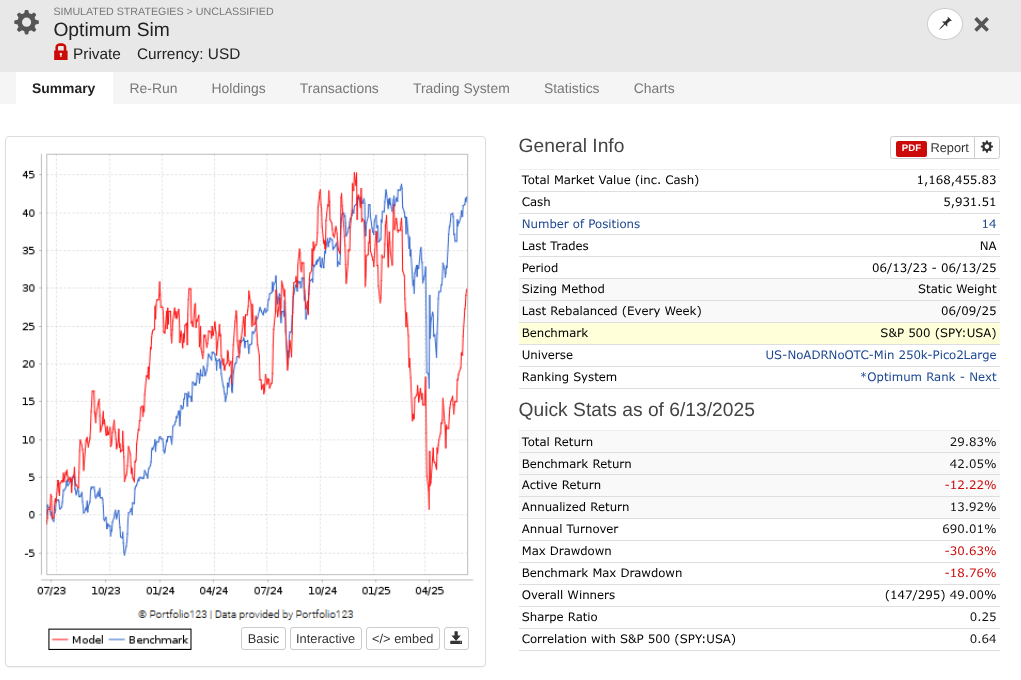
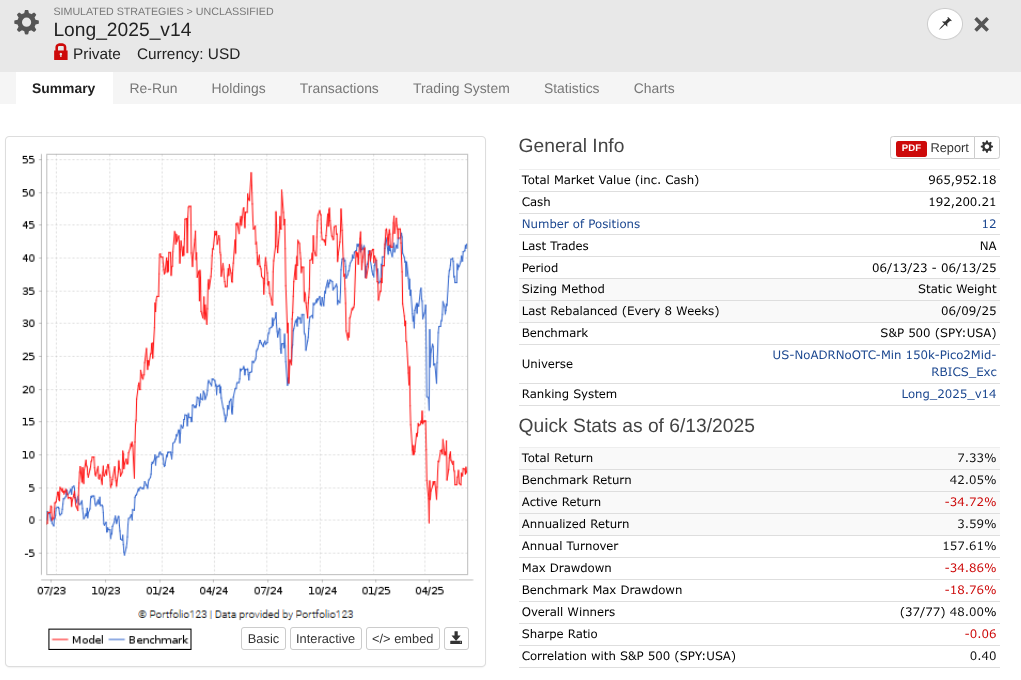
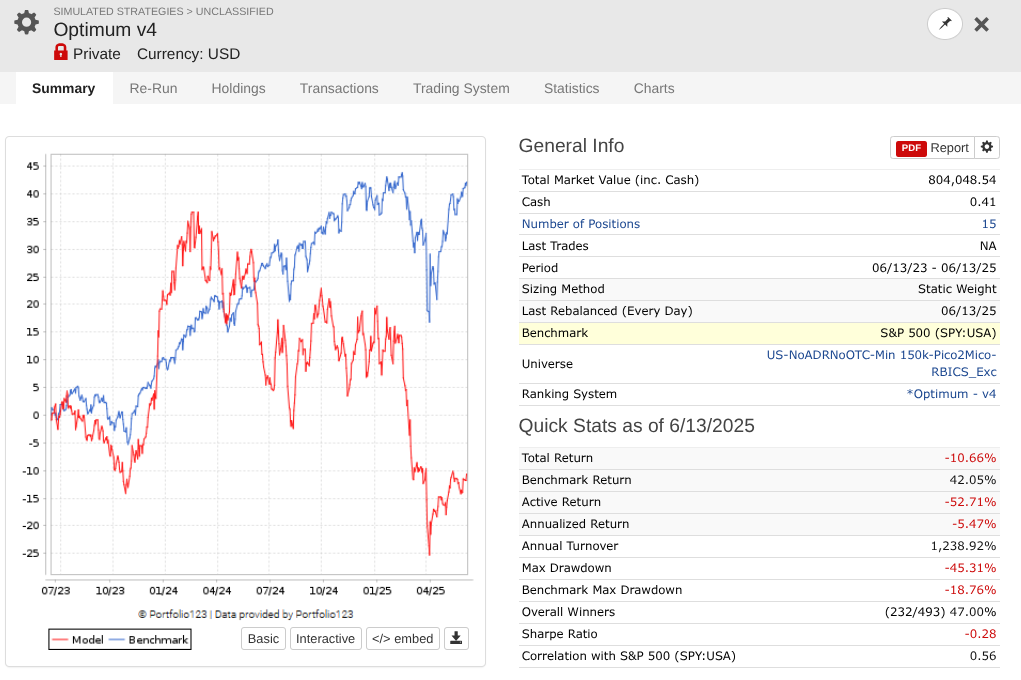
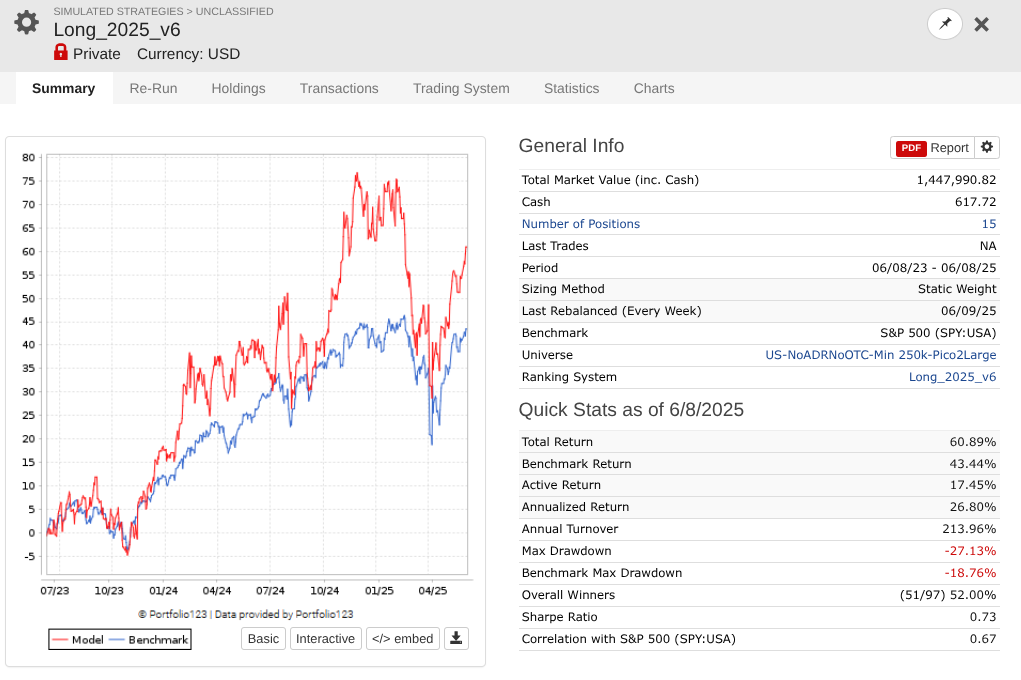
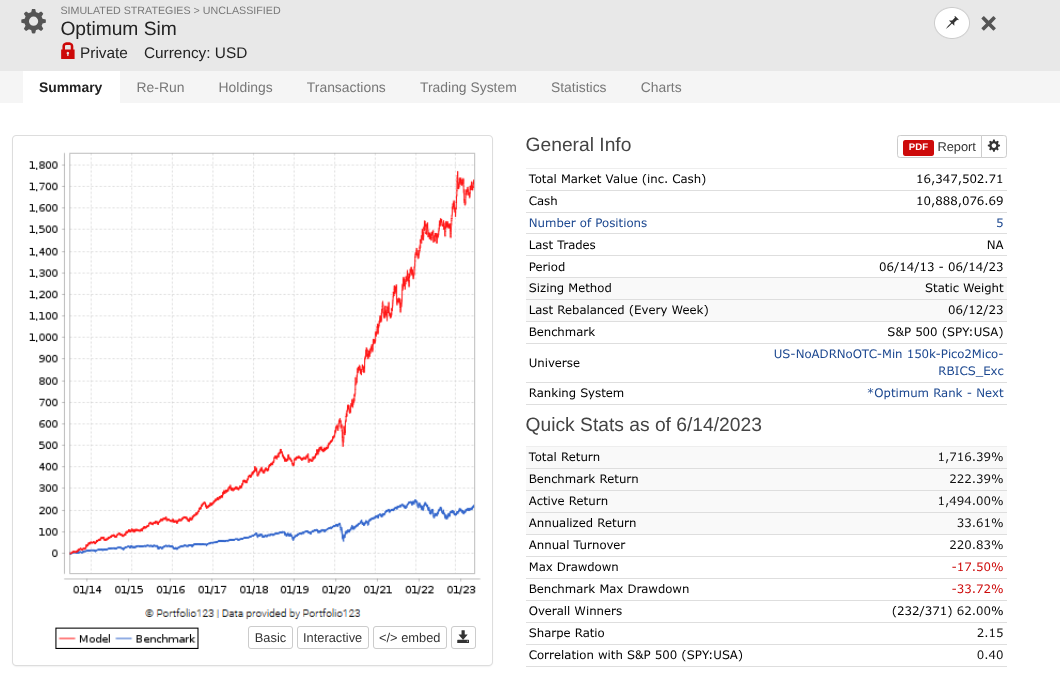
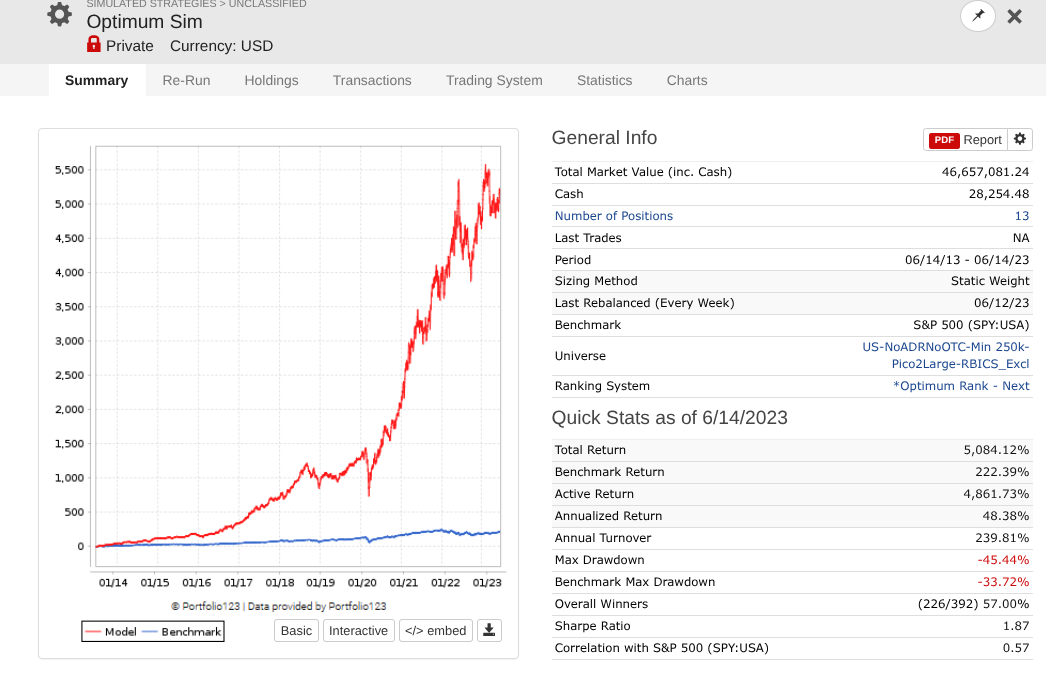
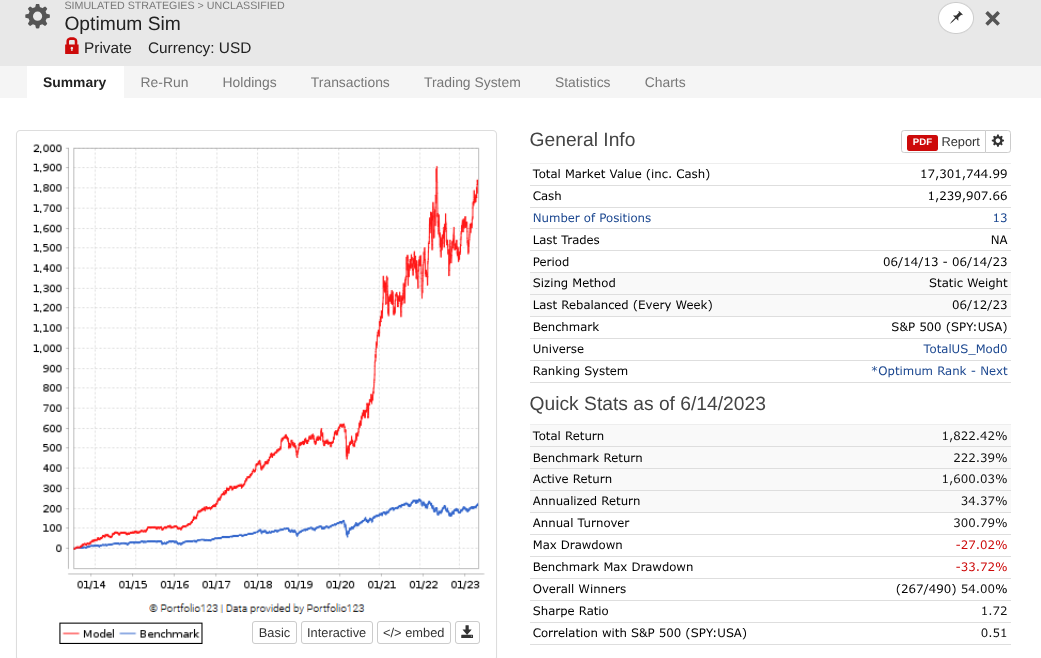
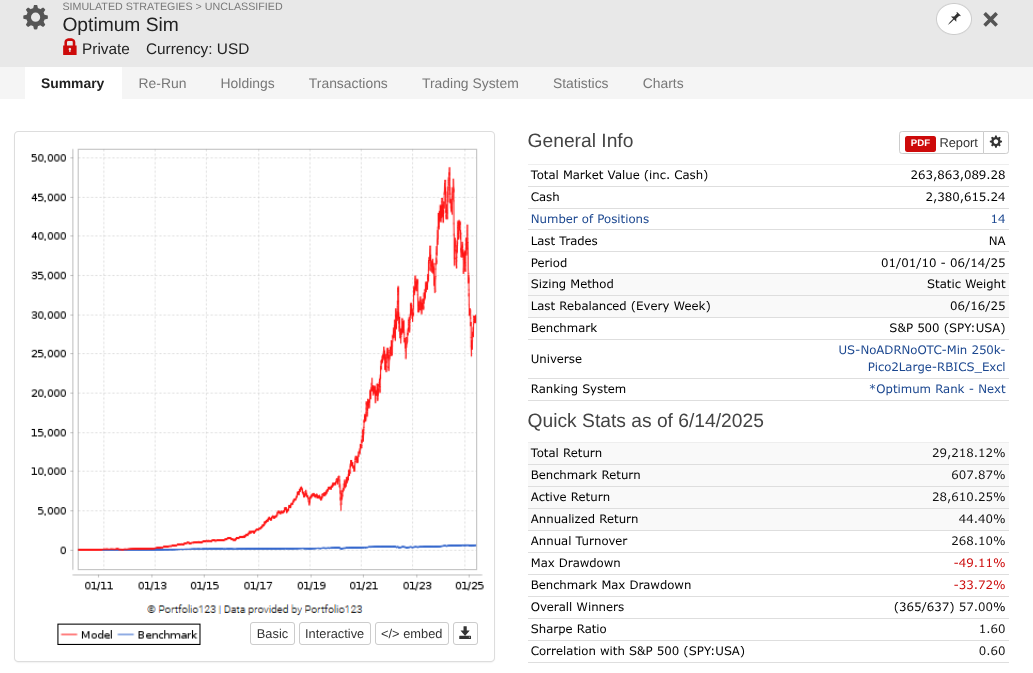
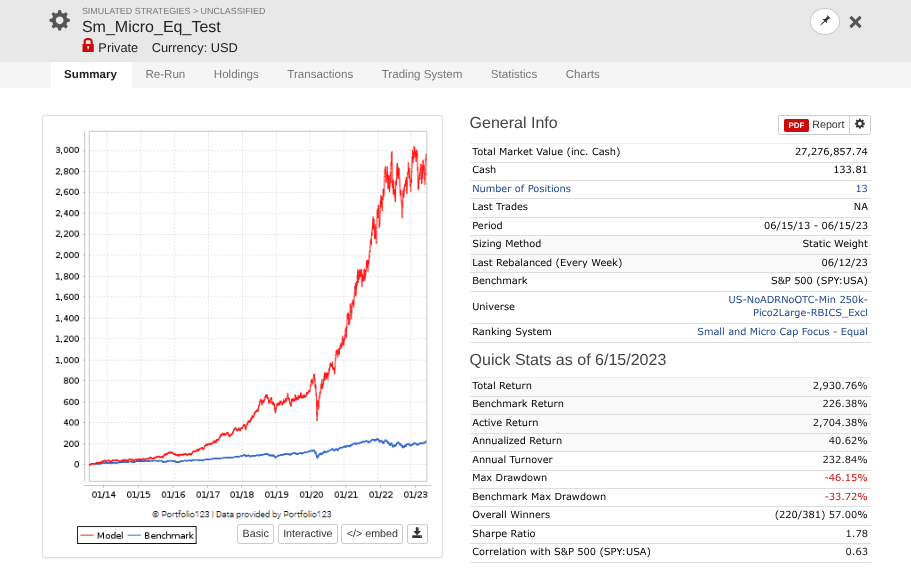
Note that every one of these systems, aside from P123 SmallCapFocus, is a 40+% CAGR with Sharpe 1.7-2.2 trained from 2013-2023 with 15-50+nodes. Many follow similar concepts like Earnings Growth, Momentum, Quality, Sentiment, Pullback, FCF Yield, Accruals, Size, Volume, ShareTurnover, etc., with equal weights following in the footsteps of people like Yuval and Danp, etc. I am curious as to whether I am the only one having these problems? My universes are similar to Easy2Trade US. See reference systems below.
To me a 15 stock portfolio seems to be a bit low for your system. Stocks in some of your selected universes have a lot of idiosyncratic risk and usually unless a lot of work is done to avoid poor quality names I would want a larger number of names in a purely quantitative system.
These large and common individual losses are causing a low win/loss ratio and the drawdowns look quite severe which is hurting your long term compounding. If one of your picks declines say 80% that is currently pretty dangerous for you as it would hurt your portfolio by about 5%.
Did you review your generated rank lists to see if you agree with the output and if it is doing what you want it to do? I would review your worst losses to see what can be improved as odds are you are selecting a lot of low quality names.
When you retest after correcting for some of these picks I would also test with a lot more than 15 names unless it is a large cap portfolio and even then you likely want to do more anyways.
2024 was a very difficult year for a lot of fundamentals-based strategies if you compare it to the S&P 500. I barely broke even myself. That said, many of my designer models have done fine since 6/9/2023, to keep the comparison the same as your screenshots. One is up 38%, one is up 83%, one is up 19%, one is up 51%, one is up only 2%, one is down 2%, and one is up 37%. For your benchmark, you might want to consider using Small-Cap Value, which has a two-year return of 10.39% rather than the absurd 42.05% for the benchmark you're using. Lastly, my real investing is really outperforming in 2025. I think fundamental factors may have come back into style.
If you limit the universe to small cap stocks, they will actually perform quite well. Even the classical official Combination model performs consistently.
I agree with many users that the universe plays a crucial role.
Yuval also mentioned that the universe should not include stocks you would never consider investing in.
I exclude (or treat separately) sectors and industries whose accounting practices, business models, or regulatory frameworks differ significantly from the broader corporate landscape. Misinterpreting factor signals from these industries is a common source of model underperformance.
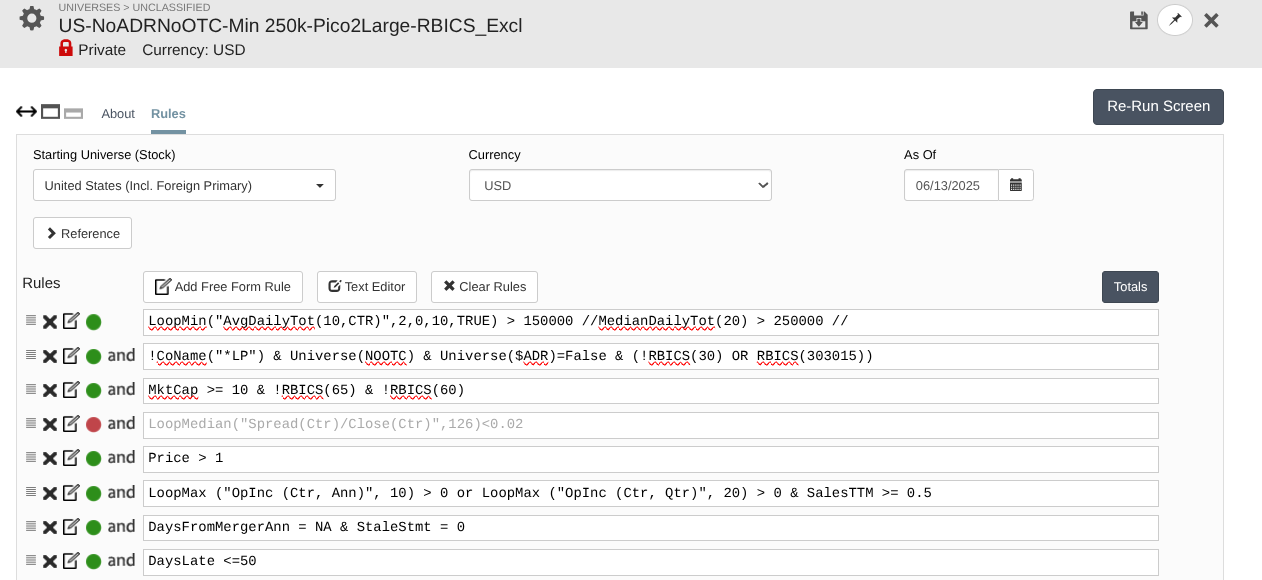
I exclude the following (conservative approach): IsMLP = False !RBICS(30, 65, 45153020, 25101040, 90151010, 40153010, 40151010)
It is important to note that Nvidia, a single stock, contributed about a quarter of the S&P500 gains in 2024 so there is that too in terms of using that specific benchmark.
So I’m not sure about your universes, but you said:
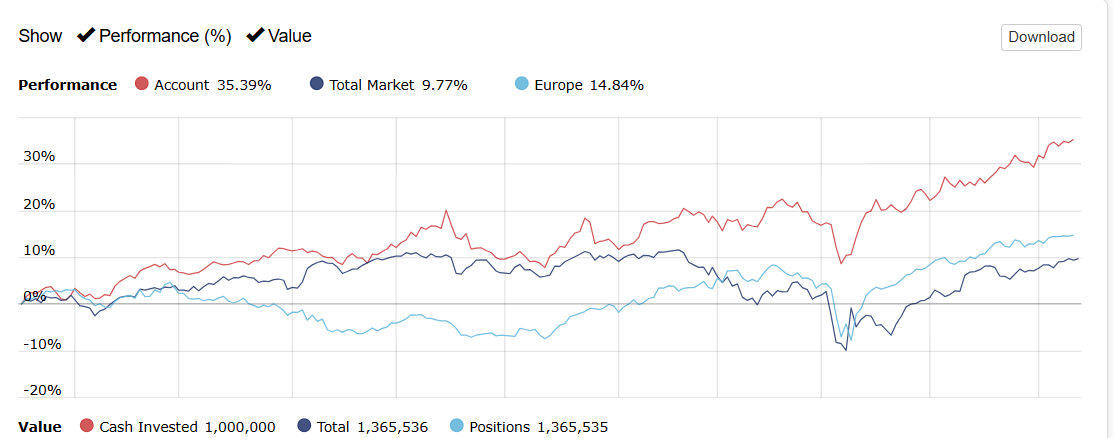
The Easy2Trade universe returned 16%, while your average across all models was about 21% over the same period. That’s not “ugly”—in fact, it suggests you may have an edge. It’s true there’s a lot of variance among the models and not all may have an edge, but finding even one good model could be considered a win.
Here’s how I’d look at it:
You have five models. Which one performed best in-sample? Was it also the best out-of-sample? If so, you’ve effectively done a kind of cross-validation—testing multiple approaches, picking the best in-sample, and then seeing how it performs out-of-sample.
Two years of out-of-sample validation isn’t a huge window, but these are clearly positive results. The evidence suggests this last model may actually have predictive power (again, assuming it was also the best in-sample).
If these are the only models you’ve focused on for the last two years, your universe is similar to Easy2Trade, and the best in-sample model is also the one performing best out-of-sample, then I’d say the evidence points to a solid model. I’d keep tracking it, or even consider allocating a small portion of your portfolio to it at first.
Of course, the evidence may change over time, but for now, I’d suggest you “take the win.”
15 stocks => too much idiosyncratic risk. Make it at least 40 or 50 for pure factor investing.
small stocks vs. S&P 500 benchmark => relative to the S&P 500, your portfolio is dramatically overweight small caps. Too much exposure to Size risk factor. Sometimes large cap as a group outperforms small cap as a group in a big way, sometimes it is the other way around. Your ranking system cannot predict it. To fix it: add appropriately sized short position in Russell 2000 and appropriately sized long position in S&P 500. A fair question would be: how do I know what "appropriately sized" means? Answer: you need a RIsk Factor model. The good news is that P123 will probably have one soon. Stay tuned.
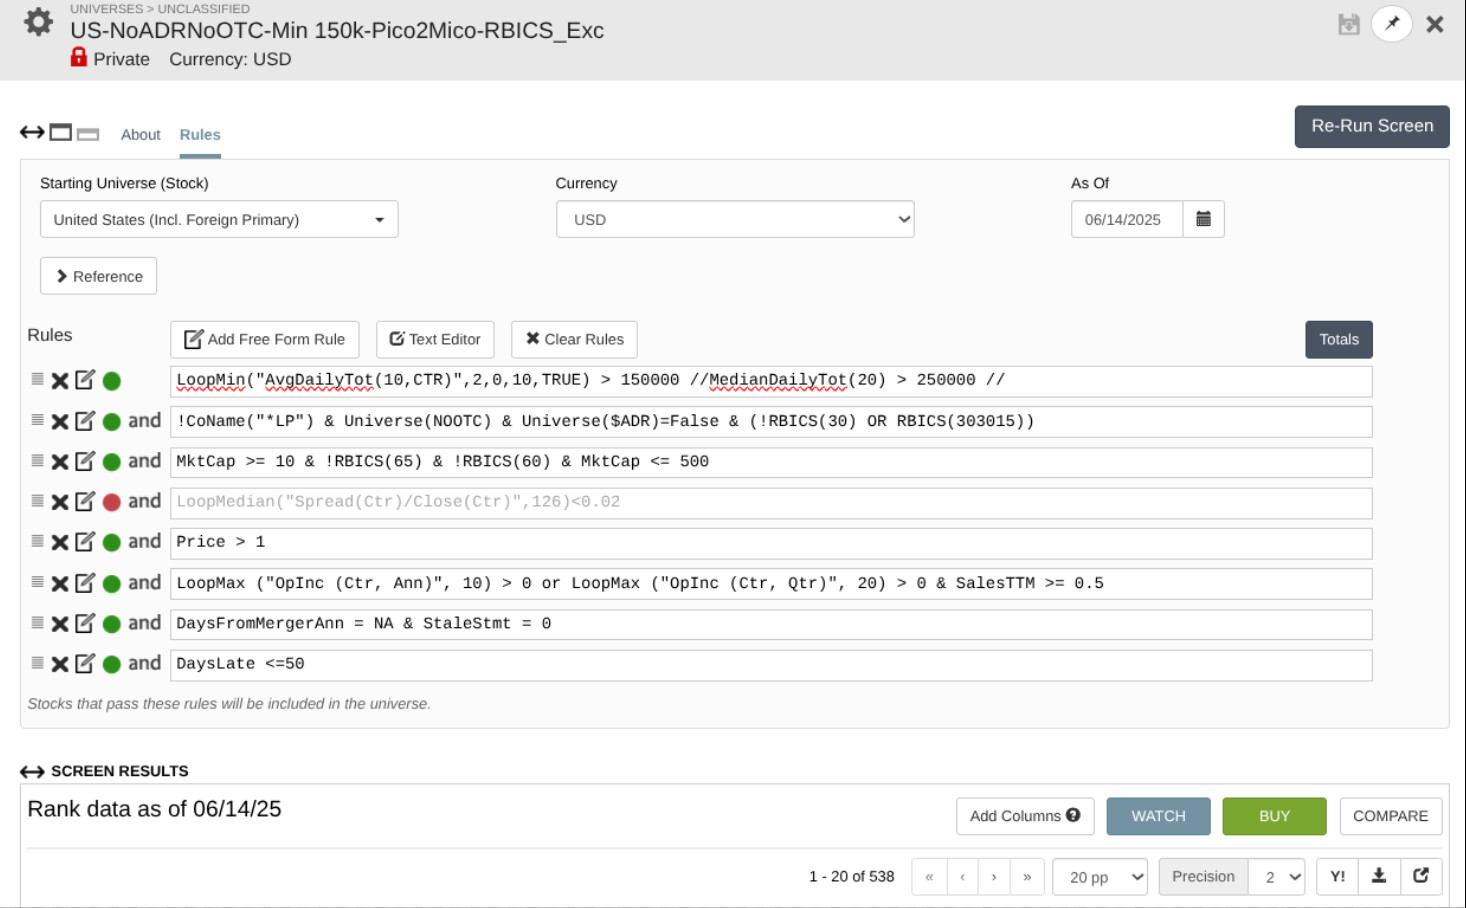
As I've posted here: What Universe do you use? - #22 by yuvaltaylor I've updated my universe as defined in the screen prints to derivatives of the following the only changes between the screen prints as defined in the naming convention is:
1: RBICS included or Excluded e.g. Finance, Utilities, Telecoms.
2: Mkt Cap 10M --> Any Size or Limited to < 500M or < 2B
So without RBICS and 10M--Large --> ~3k stocks and with RBICS ~2k stocks and with <500M ~500 stocks.
I'm using 15 based upon this post: How to Manage Your Portfolio to Maximize Your Returns - Portfolio123 Blog though I've also looked at 20, 25 which still deliver similar results. I have less success in sample with 50 which may be due to all kinds of reasons, but its still Sharpe of ~1.3-1.7. I've done my best to exclude the universe to only stocks I would be interesting in buying see my other post below which includes min liquidity etc.
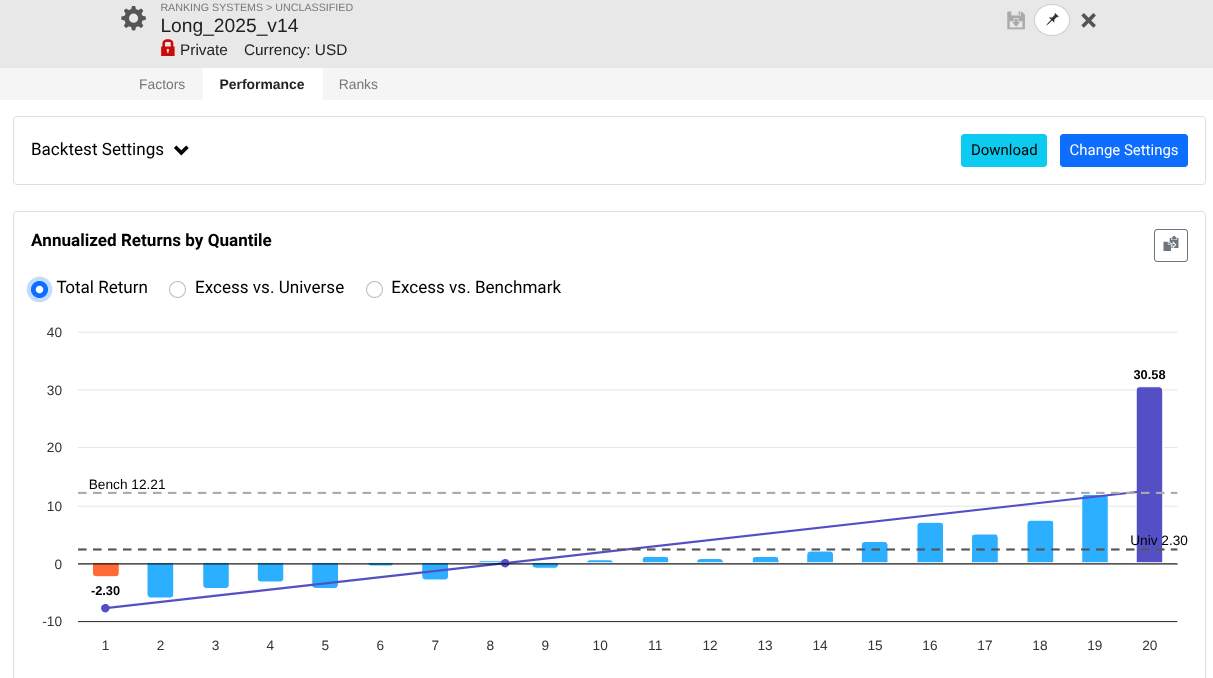
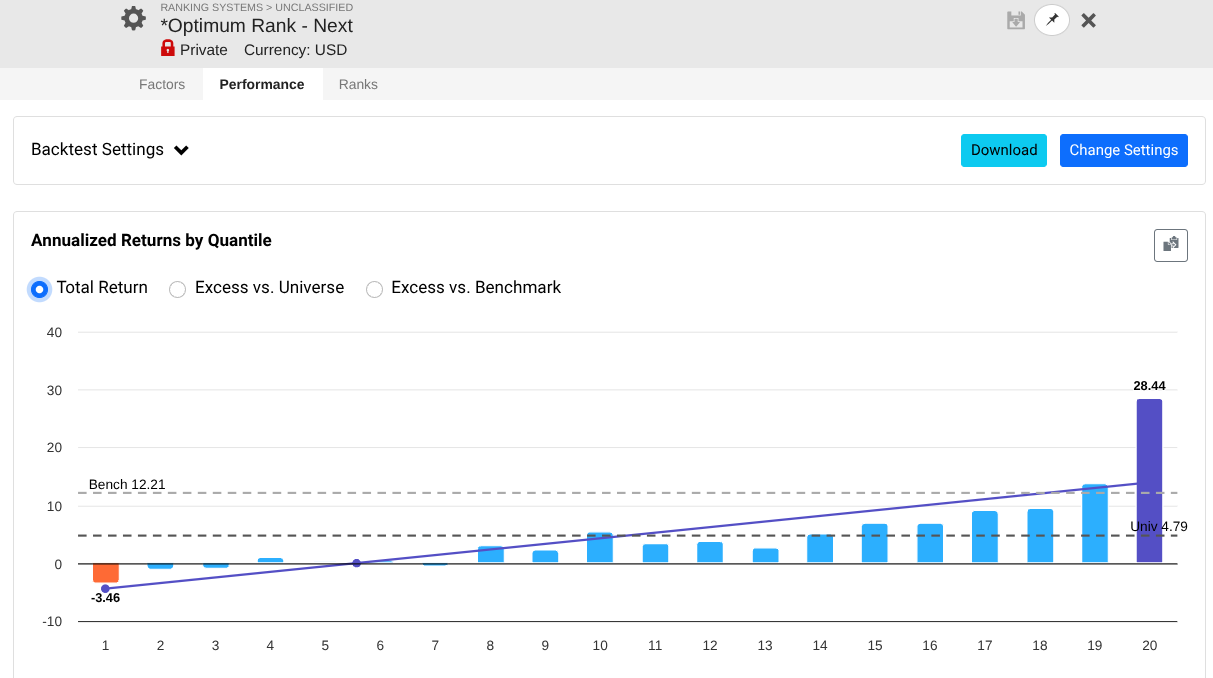
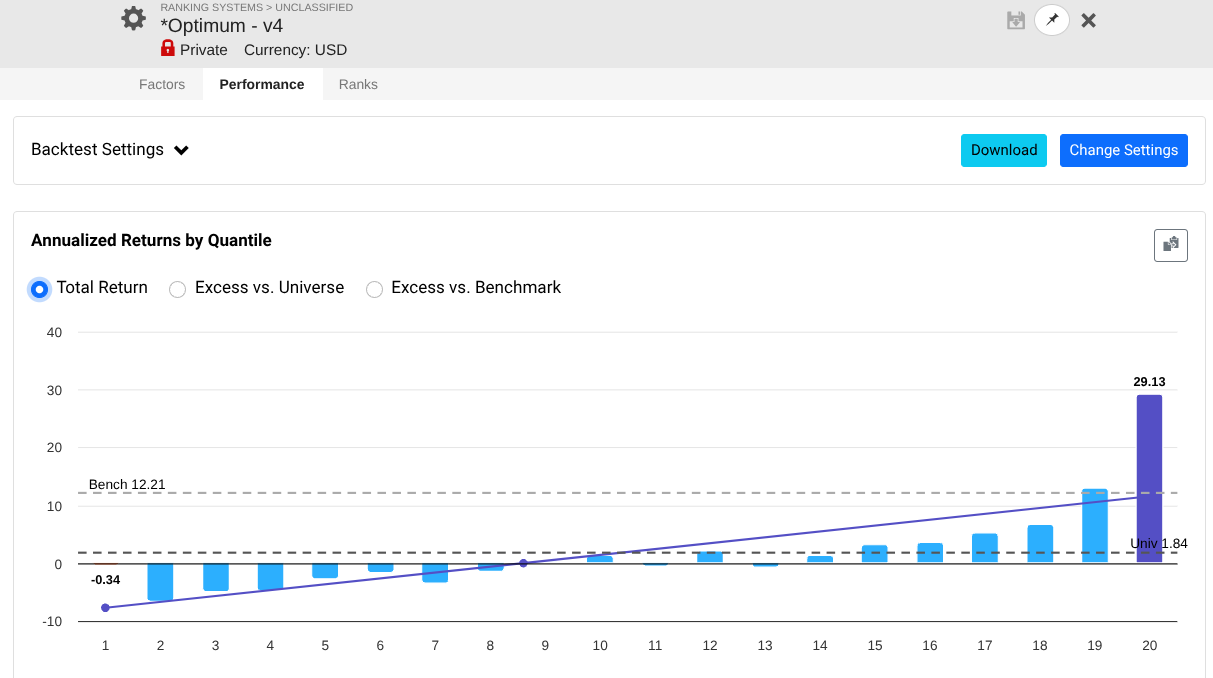
My generated rank lists for some of the above strategies are the following:
I have also run Mod(StockID, 5) = 0...4) against the universes as described by Victor here: Reasons for 'Big Gap' in results between a ranking system and a simulated strategy my results are not as consistent as Victors with a range of 5% which is more than I'd like but still reasonable e.g. between 30% and 25% for bin 20, but still performs well as a RS.
I agree that in sample I get higher performance at the expense of lower number of available stocks e.g. when I limit to smaller stocks e.g. Pico2Micro 10M --> 500M MktCap vs Pico2Large but that comes at the expense of having a smaller pool of available stocks (see screen print of only ~500 stocks in Pico2Micro) and then is more suceptable to problems when you use Mod(StockID, 5) = 0); however both cases out of sample are garbage as shown in the first post.
Jrinne, I'll admit I am intimidated in responding to you because in reading your material you are well beyond my expertise. regardless my best performing in sample performed mid out of sample and my worst performing in sample performed best out of sample. See above for an example of Sharpe 1.8-2.15 in that model it is quite good in sample but trash out of sample. See another post above for my methodology for beating up on the systems using Mod(StockID,5) which works quite well in sample and is garbage out of sample.
I've built probably 100+ models, these are a sample of some of the best models I've built in sample from forum guidance, SmallCapFocus derivatives, or Danp's spreadsheet where I've added and tested an additional ~1500 formulas via DataApi.
Thank you for pointing out E2T performance as I usually only compare to S&P performance.
I can only conclude that I am continuing to find a way to curve fit my models for whatever reason and that their OOS performance is a measure of that.
Yes as listed above the performance when I run Mod(StockID,5) the performance is similar to 1.3-1.7 sharpe which is lower than the 1.8-2.2 Sharpe but still reasonable for me based upon limiting the number of available stocks.
Here is one with Mod(StockID,5)=0
Even the most basic value+momentum model has outperformed the S&P 500 over this period, and the out-of-sample performance of your model seems a bit odd.
Could you shine some more light on the factors you are using and/or the way you design your models? The big drop off after launch in 2023 indeed seems pretty odd considering that you did robustness tests using MOD and used data from 2011 onwards.
Did you run your backtests with 50+ stocks before? Did you do rolling backtests via the screener? Did you try filtering out your top stocks of your first simulation run in your subsequent runs as a robustness test?
Of course, more data wouldn't hurt (so you can run it from 2002 onwards), but I think you have been a bit unlucky too.
Here, I think this will scratch the itch as it covers the problem with data, which is essentially available to everyone.
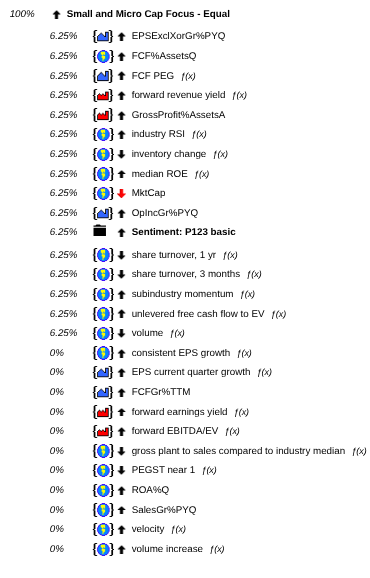
Start with SmallCapFocus apply equal weighting to all formulas and just prune the formulas 1 by 1 if they don't provide value in a 20 bin RS from 2013-2023. I might have added a single formula, but its common stuff.
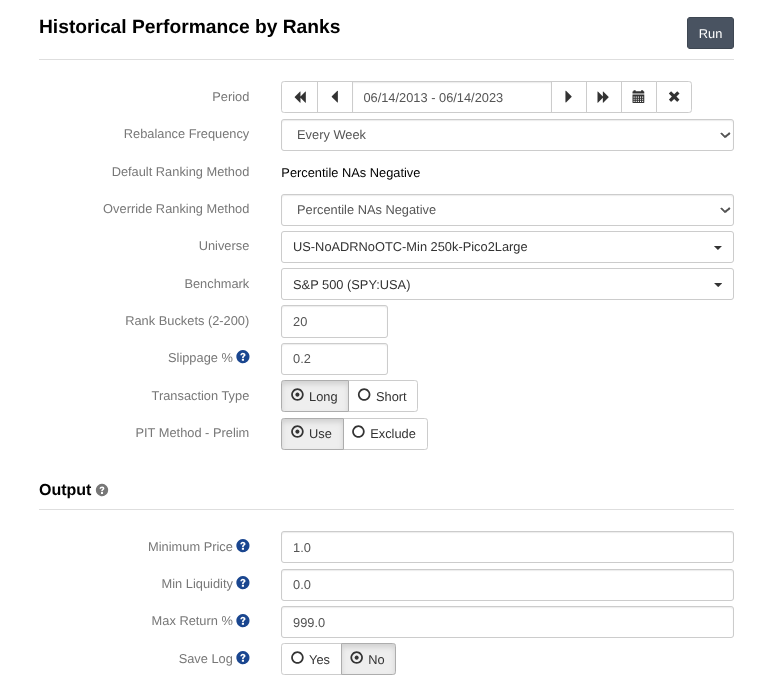
Run the Multi factor rank system against 2013-2023 and see that it does reasonably e.g. sharpe ~1.7
Now run it on the out-of-sample period for 2023-2025. Note, some of you may say this is fine, but this is worse than half the performance of in-sample with a much worse curve, so the "example" easy to access use case to me is not performing as expected out of sample. NOTE this is an example that is easily available to everyone which is why I am using it. This is exemplified in my other systems, which use similar concepts of Earnings Growth, Momentum, Quality, Sentiment, Pullback, FCF Yield, Accruals, Size, Volume, ShareTurnover, etc., as stated in the initial post.
I think Core Combination is a better starting point for improvement as its more balanced to cover more factors and has a longer OOS history to check its consistency.