Greetings all,
Usually when I build a (ranking) strategy I have a ‘quick and dirty’ test to check for robustness that is as follows:
(1) I try not only rely to on backtesting, but think for myself in terms of what factors to choose and which factors to give a higher weight based on for example the level on noise in the data for that specific factor and my conviction in the factor’s construction.
(2) backtest on multiple universes (so for example a US ‘total’ universe and 5x subsamples of that total universe with Mod(StockID, 5) = 0)
(3) backtest in multiple regions (so for example not only in the US, but also with European data).
(4) backtest over multiple timeperiods and/or use performance measures that take into account more than only the cumulative return over the period but also its robustness across time.
(5) backtest with multiple methods (ranking, simulations, screens)
Up untill now when robustnesscriteria (1) - (4) were satisfied for multi factor ranking systems, always (5) was automatically satisfied as well. So when for example a ranking system bucket test looked promising, so did the simulations that used that ranking system. But yesterday I encountered a situation where this was not the case, which was surprising to me.
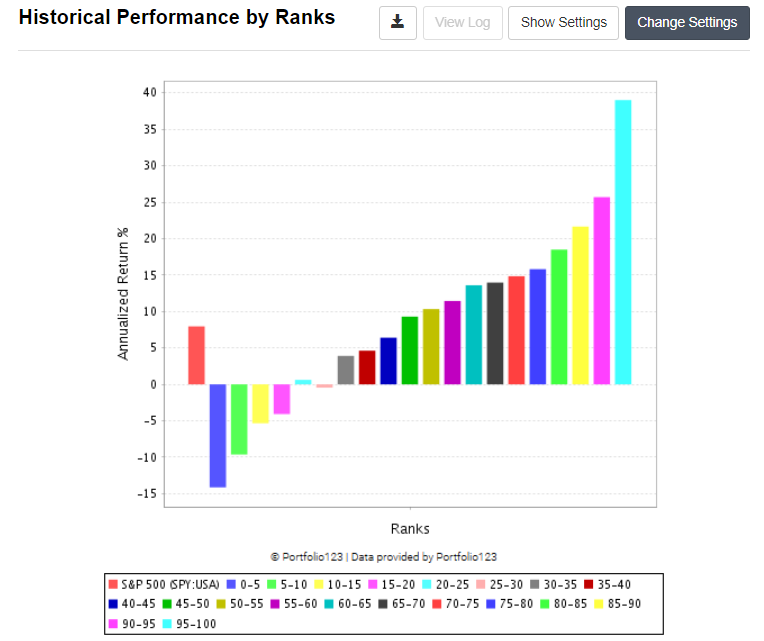
After constructing a ranking system based on (1) I ran a simple multi factor ranking bucket test on a broad US Universe with a volume constraint as in (2).
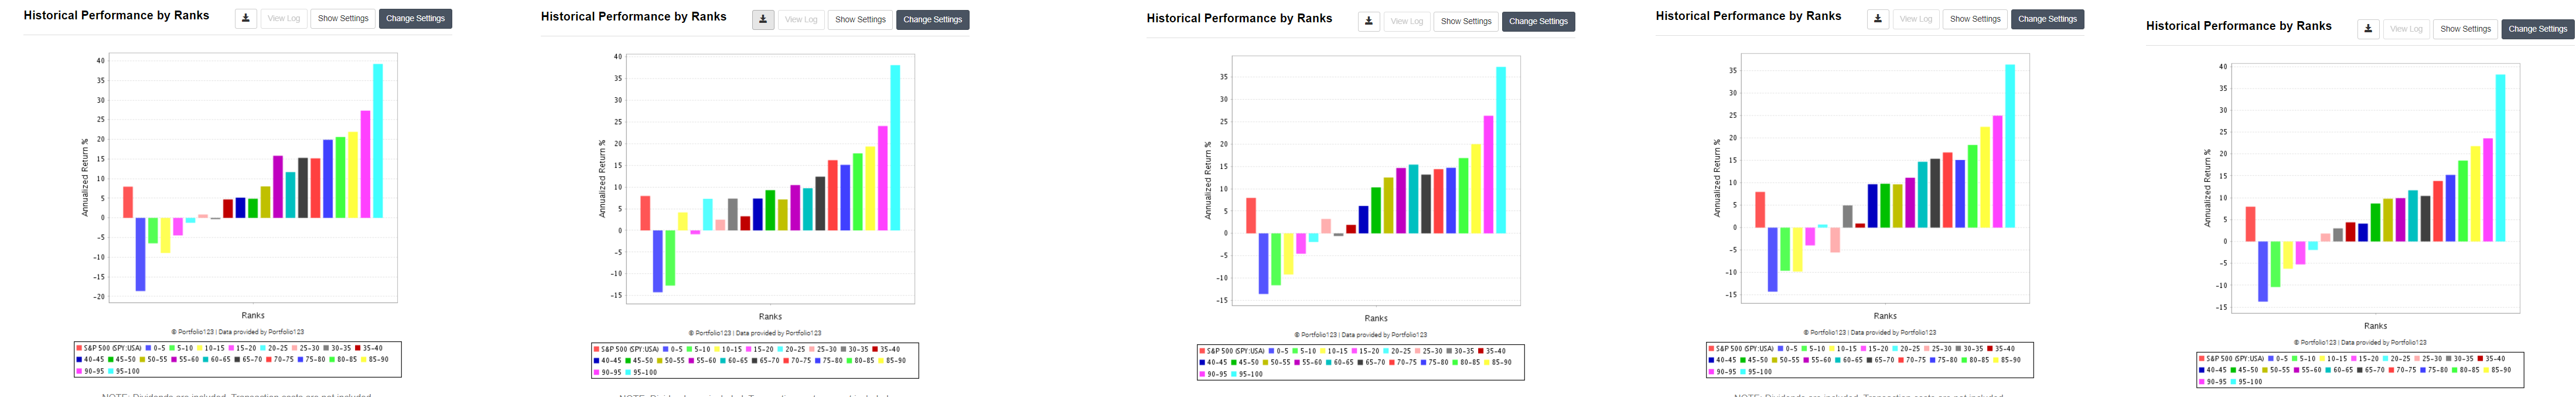
That looked ‘good enough’, so I also ran it with 5x subsample universes with the result as follows.
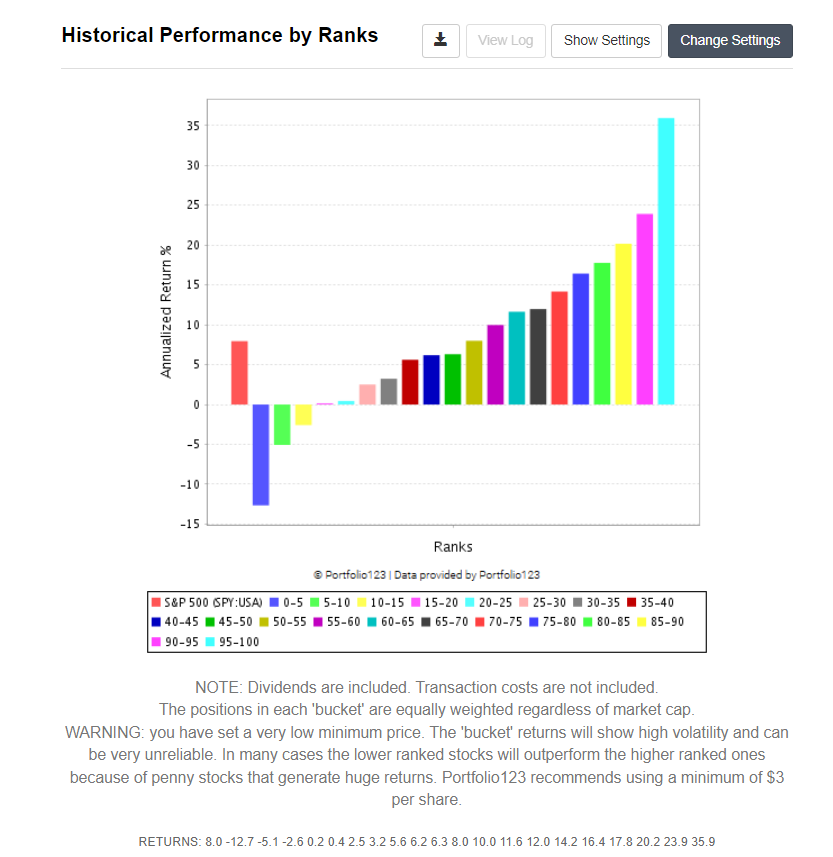
Eyeballing the graphs, I was still statisfied, so I moved to step (3). Using a broad European Universe wtih a the same volume constraint I got the following result:
Again using 5x supsamles resulted in
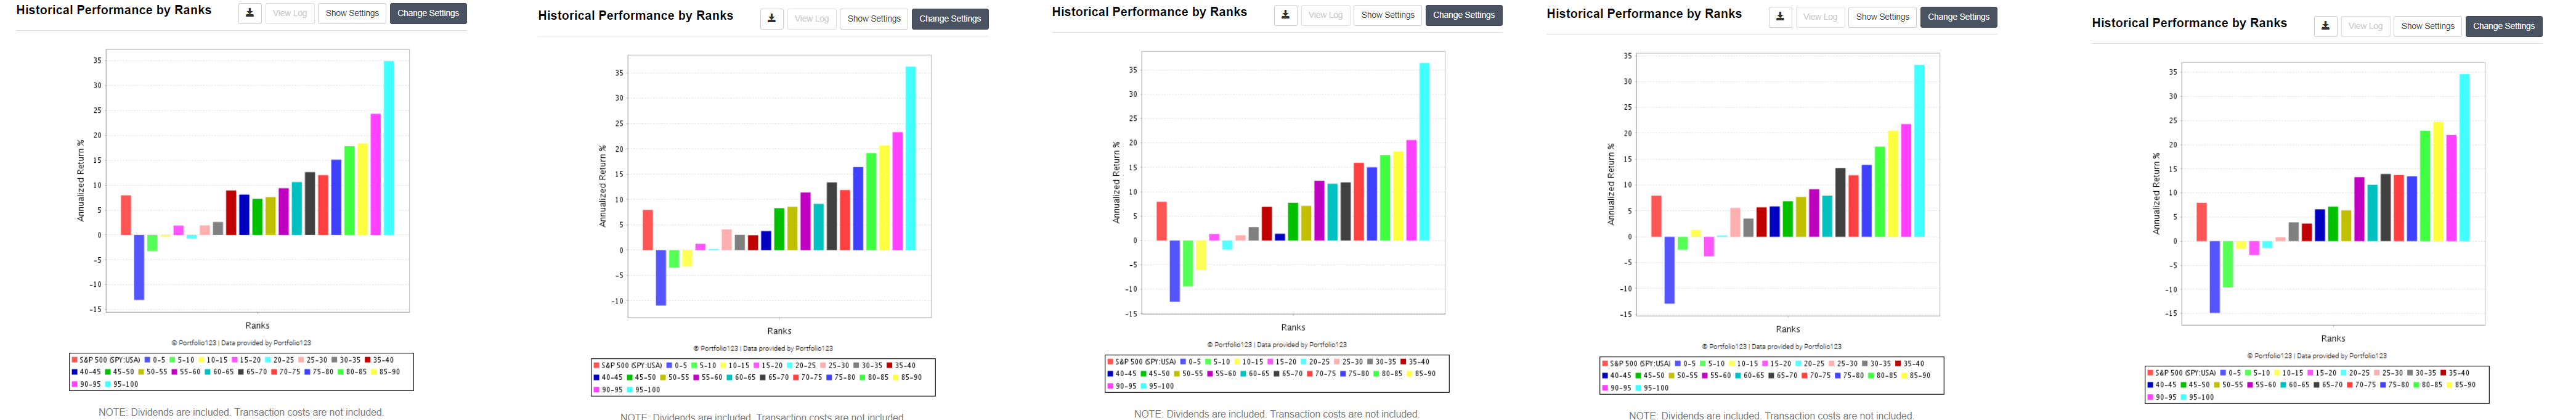
which still looked good enough to me.
Next I use some robustness measures as in (4) that I described here Ranking your ranking systems - #16 by Victor1991. This was also satisfied. So I moved on to (5), testing it on the broad US Universe I used in step (2), but this time in a simulation.
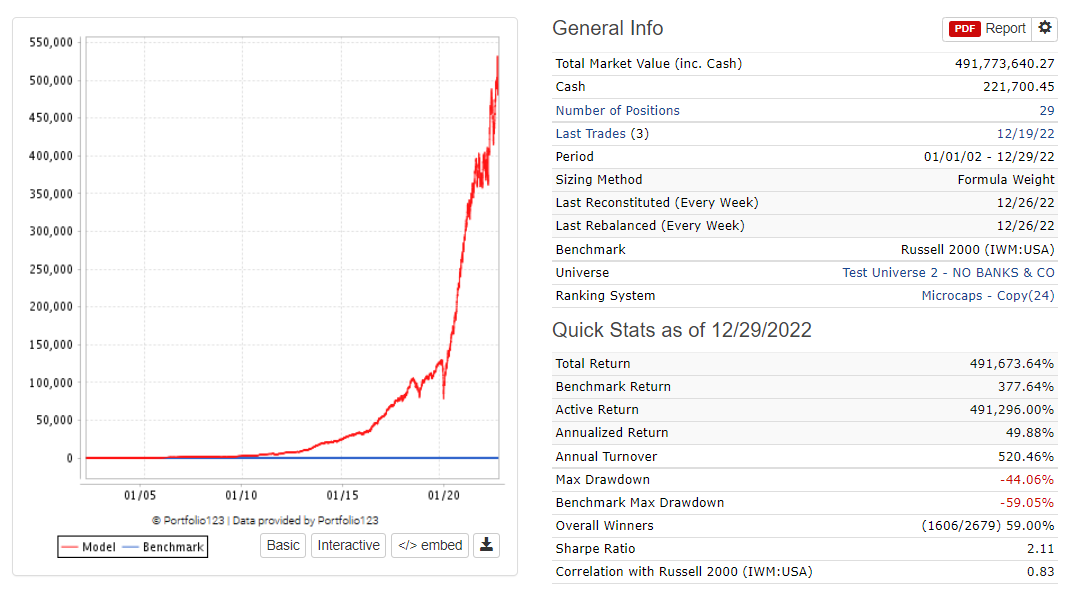
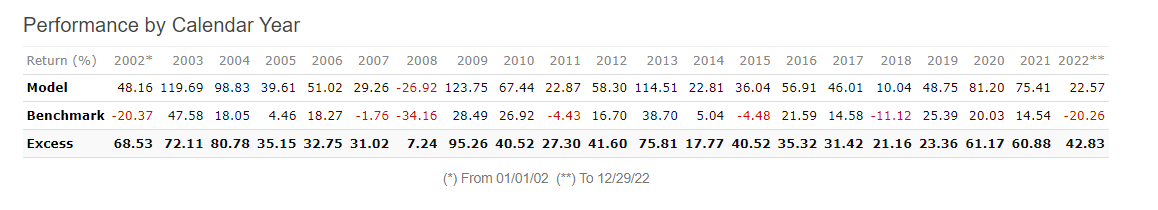
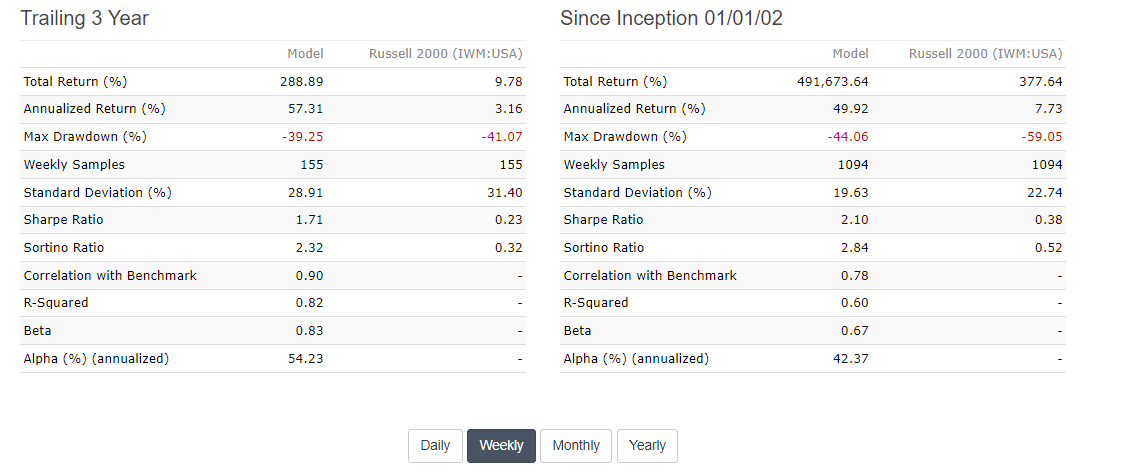
Based on the above numbers, I’m still interested in the strategy. The annual turnover is a bit too high for my liking, but let’s move on and test it on the broad European universe of step (3) for now to see what happens there.
Surely we can expect an annual alpha there somewhere between 35-40% based on our previous ranking bucket tests and simulation with US data. Right?
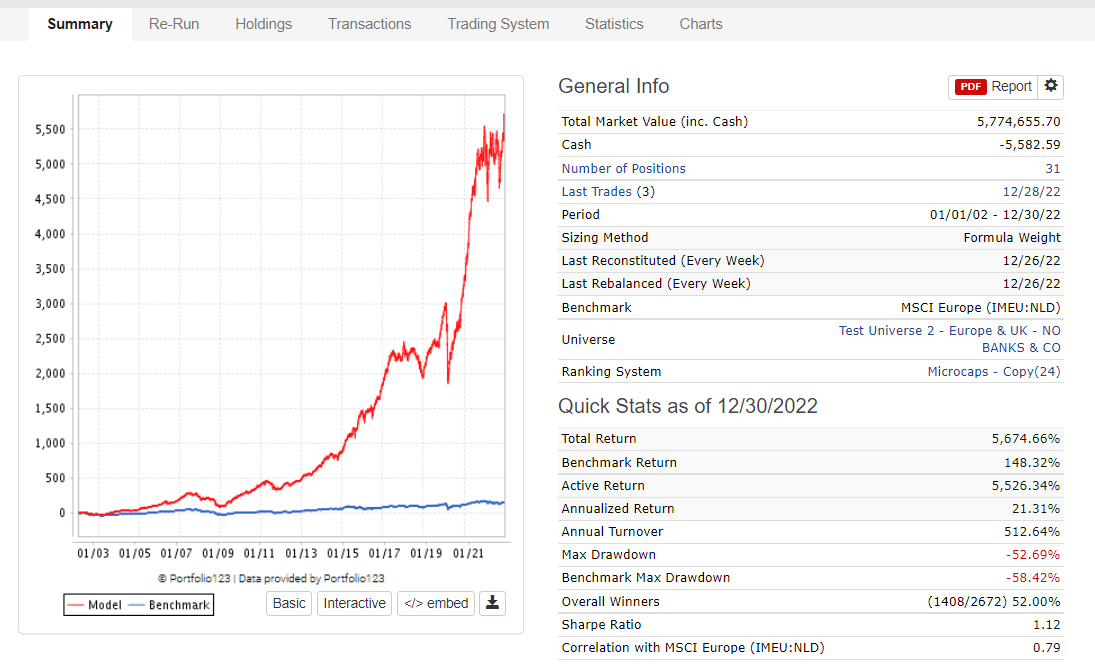
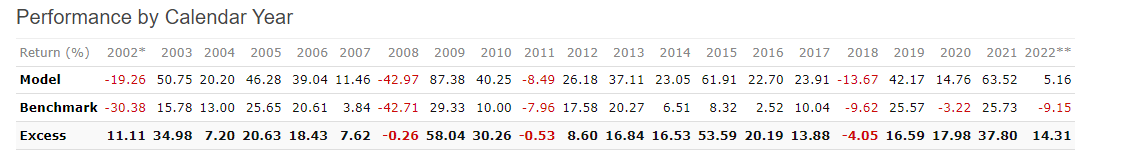
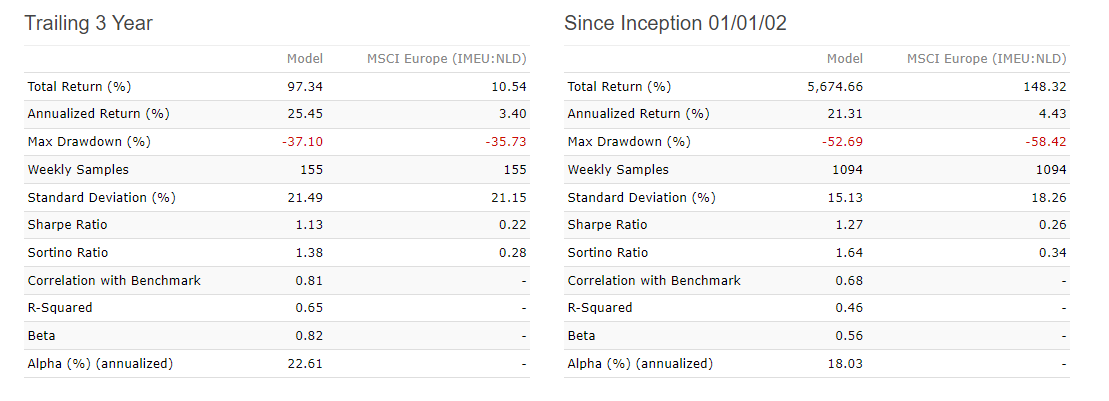
Well, that was actually quite dissapointing. What happend here? Looking at this result of step (5), I’m not that comfortable about this strategy anymore, even though it seemed quite promising based on steps (1) - (4).
I’m interested to hear your thoughts on what you would do in a situation like this. The gap between the simulation results in the US and in Europe seem very high, even though the ranking bucket results did not seem that far apart. Would you go back to the drawing table and revamp your ranking system? Would you doubt your simulation settings (see below for mine)?
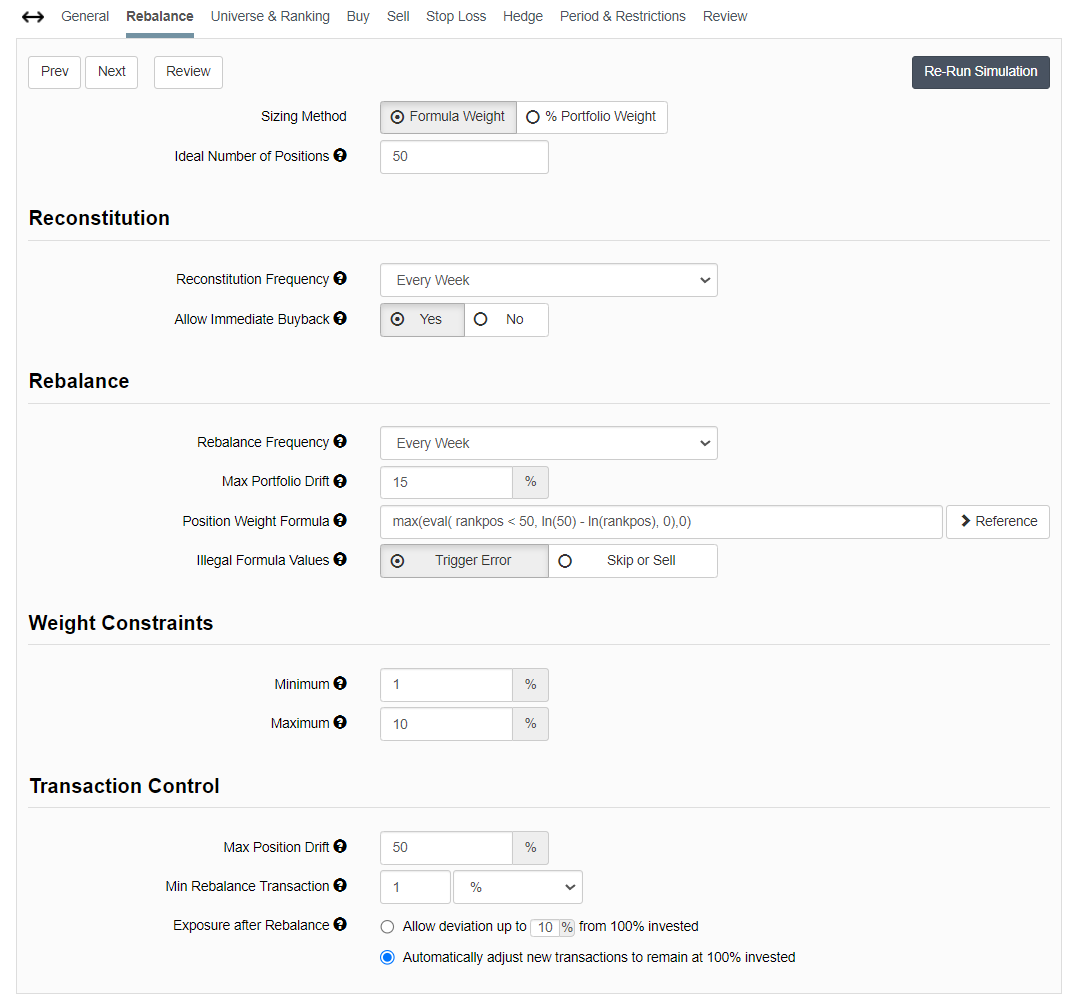
Let me know if you need any more information about my procedures in case you need it to formulate an answer to the above question. I would love to get some input here.
I have developed quite some systems based on procedures that are every much like the procedure I described here in steps (1) - (5) and because this time the ranking system did not satisfiy only (5), I’m starting to doubt my procedure as a whole and think I need more robustness checks even if I use it only as a rough first test.
Best,
Victor