Imagine a weight loss study that compares people taking Ozempic to nursing home residents. They lost weight! But wait - compared to what population?
That's what P123 backtests do right now.
If you pick 20 stocks from the Russell 2000, the benchmark is the Russell 2000 equal-weighted. Not the cap-weighted Russell 2000 index. Not the S&P 500.
You can't measure consistency or statistical significance comparing different populations.
Your universe IS your control group. Otherwise you literally don't know if your outperformance is real or random noise.
Feature Request: Add 'Equal Weight Universe' as a benchmark option. The system already calculates it for ranking.
CALL TO ACTION:
UPVOTE if you want this feature
You can't judge alpha without a proper control group. Period.
For finding the benchmark with the highest correlation to your universe, run an ETF screen, use the Ticker command to name which ETFs you want to see, and then use the ShowCorrel command www.portfolio123.com/doc/doc_detail.jsp?factor=ShowCorrel. If you make a few guesses as to which of the ETFs comes closest to your universe, you can see which of them correlate highly with those. That'll help narrow it down. You can then download price series for your universe (by running a screen on it with no ranking and no rules) and for the ETFs in question, import them into Excel, calculate the period returns of each series, and run a correlation table using the Data Analysis tool.
TL;DR: The bigger problem here isn’t just the 2010 glitch — it’s that UnivAvg() is averaging price levels, while most of us who are doing ML or excess-return work really want an average of returns. UnivMedian() avoids the obvious 2010 anomaly, but it has the same conceptual issue: it’s the median price, not the median return.
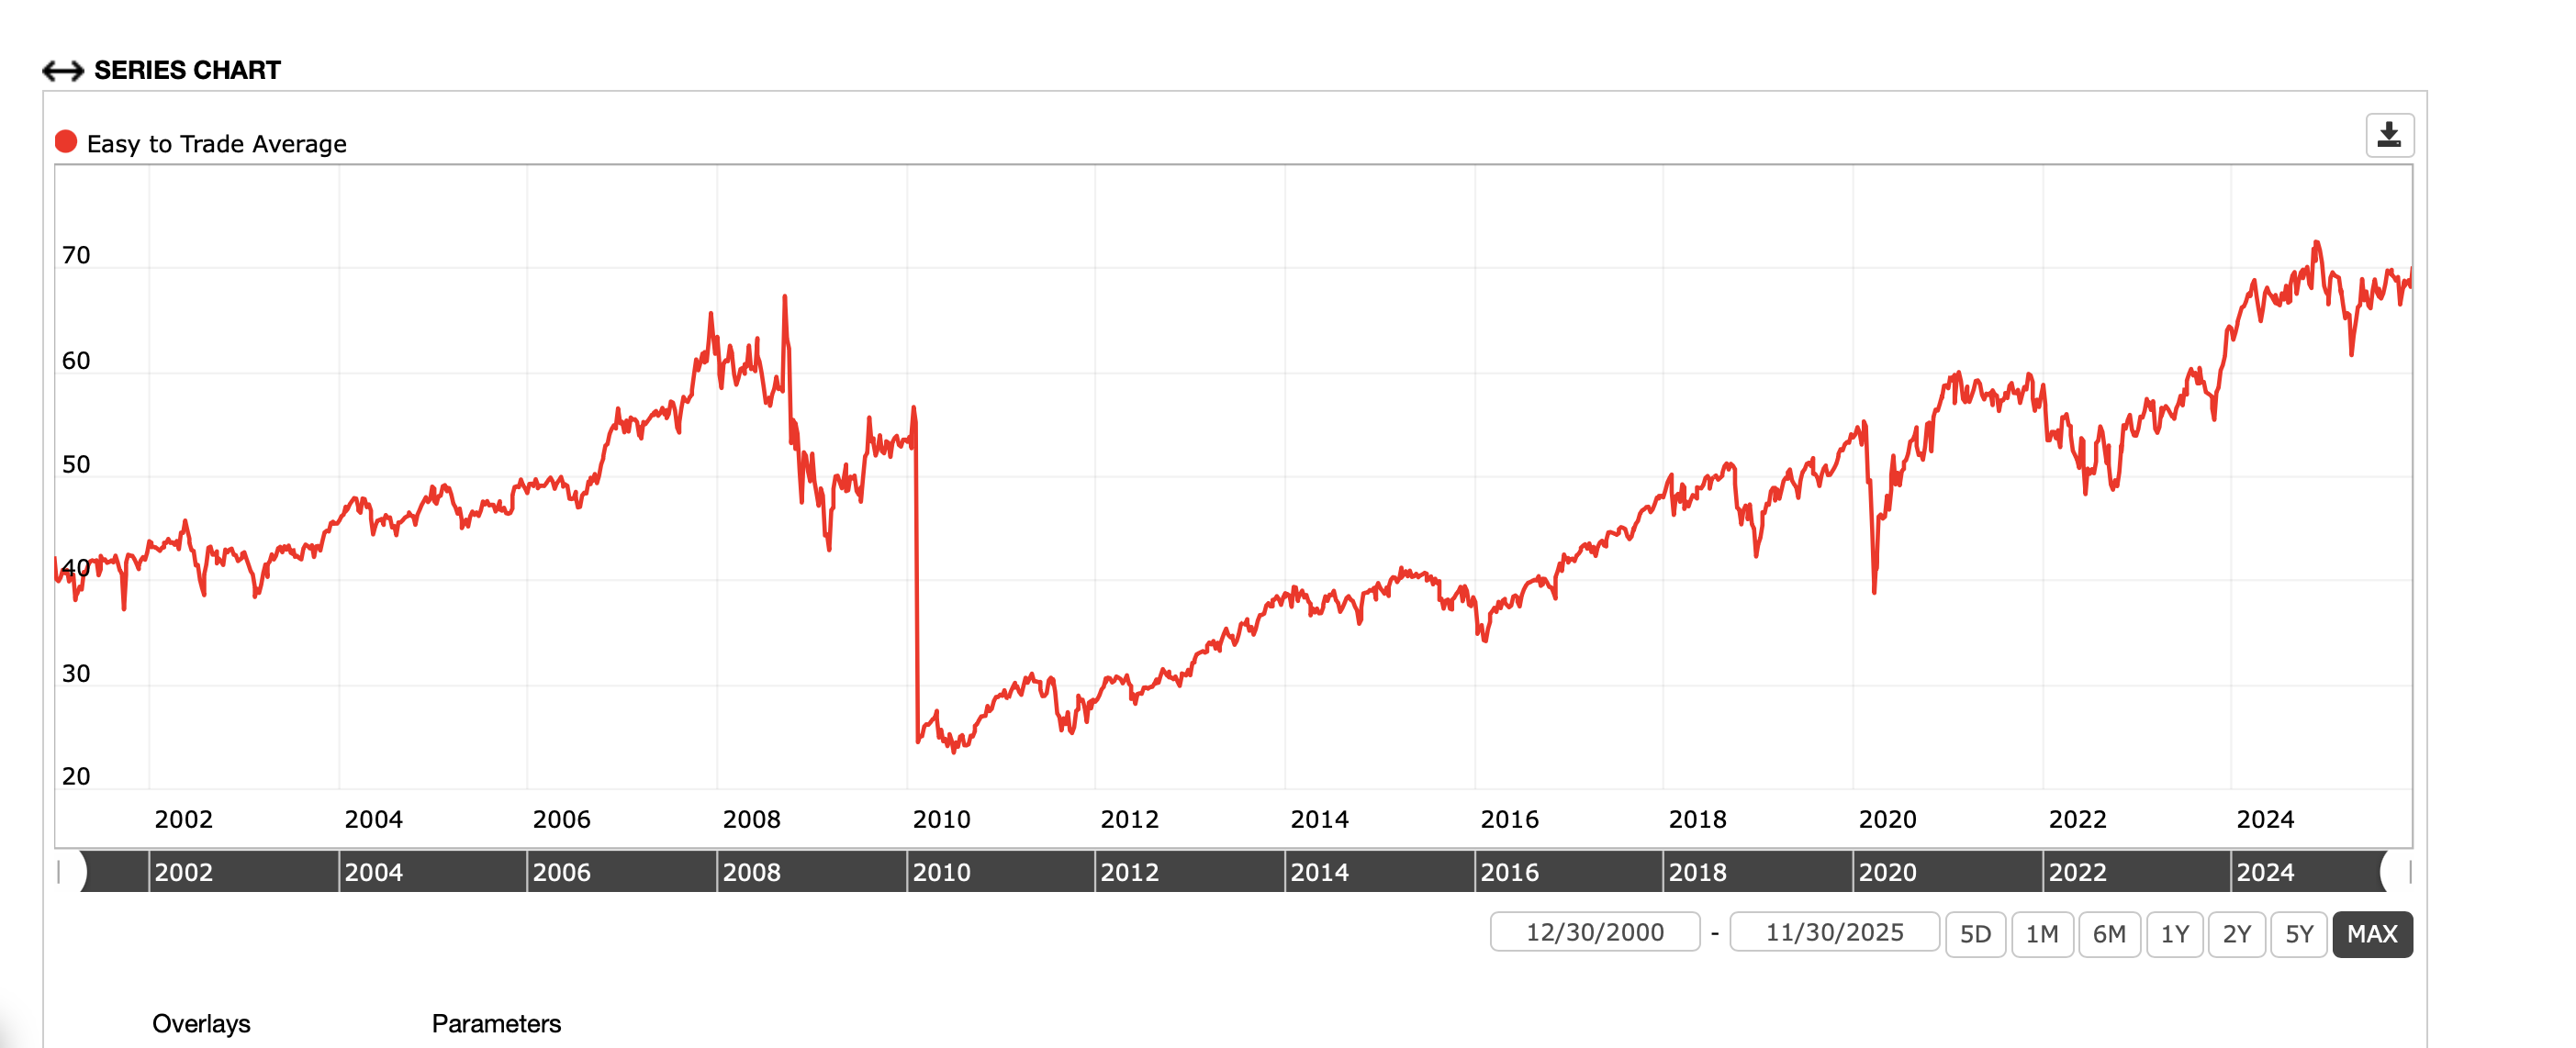
The Easy to trade universe gives you this with UnivAvg(). It seems to have some sort of algorithm error or data problem at the beginning of 2010::
So your excess returns (if you are using excess returns) at the beginning of 2010 will be extreme. Probably to the point that it will affect many AI model’s training results. It’s not just that you will get a false impression of how your model is doing but your model may not be able to make reliable predictions going forward after training on this data...
I cannot seem to run a screen on P123 now (possibly related to some technical issues), but I do not remember seeing the issue around the beginning of 2010 on a screen of the entire Easy to Trade Universe. I don’t see this with the universe in the rank performance test after just checking either.
Edit: Not there in a screen with all stocks from the Easy to Trade Universe.
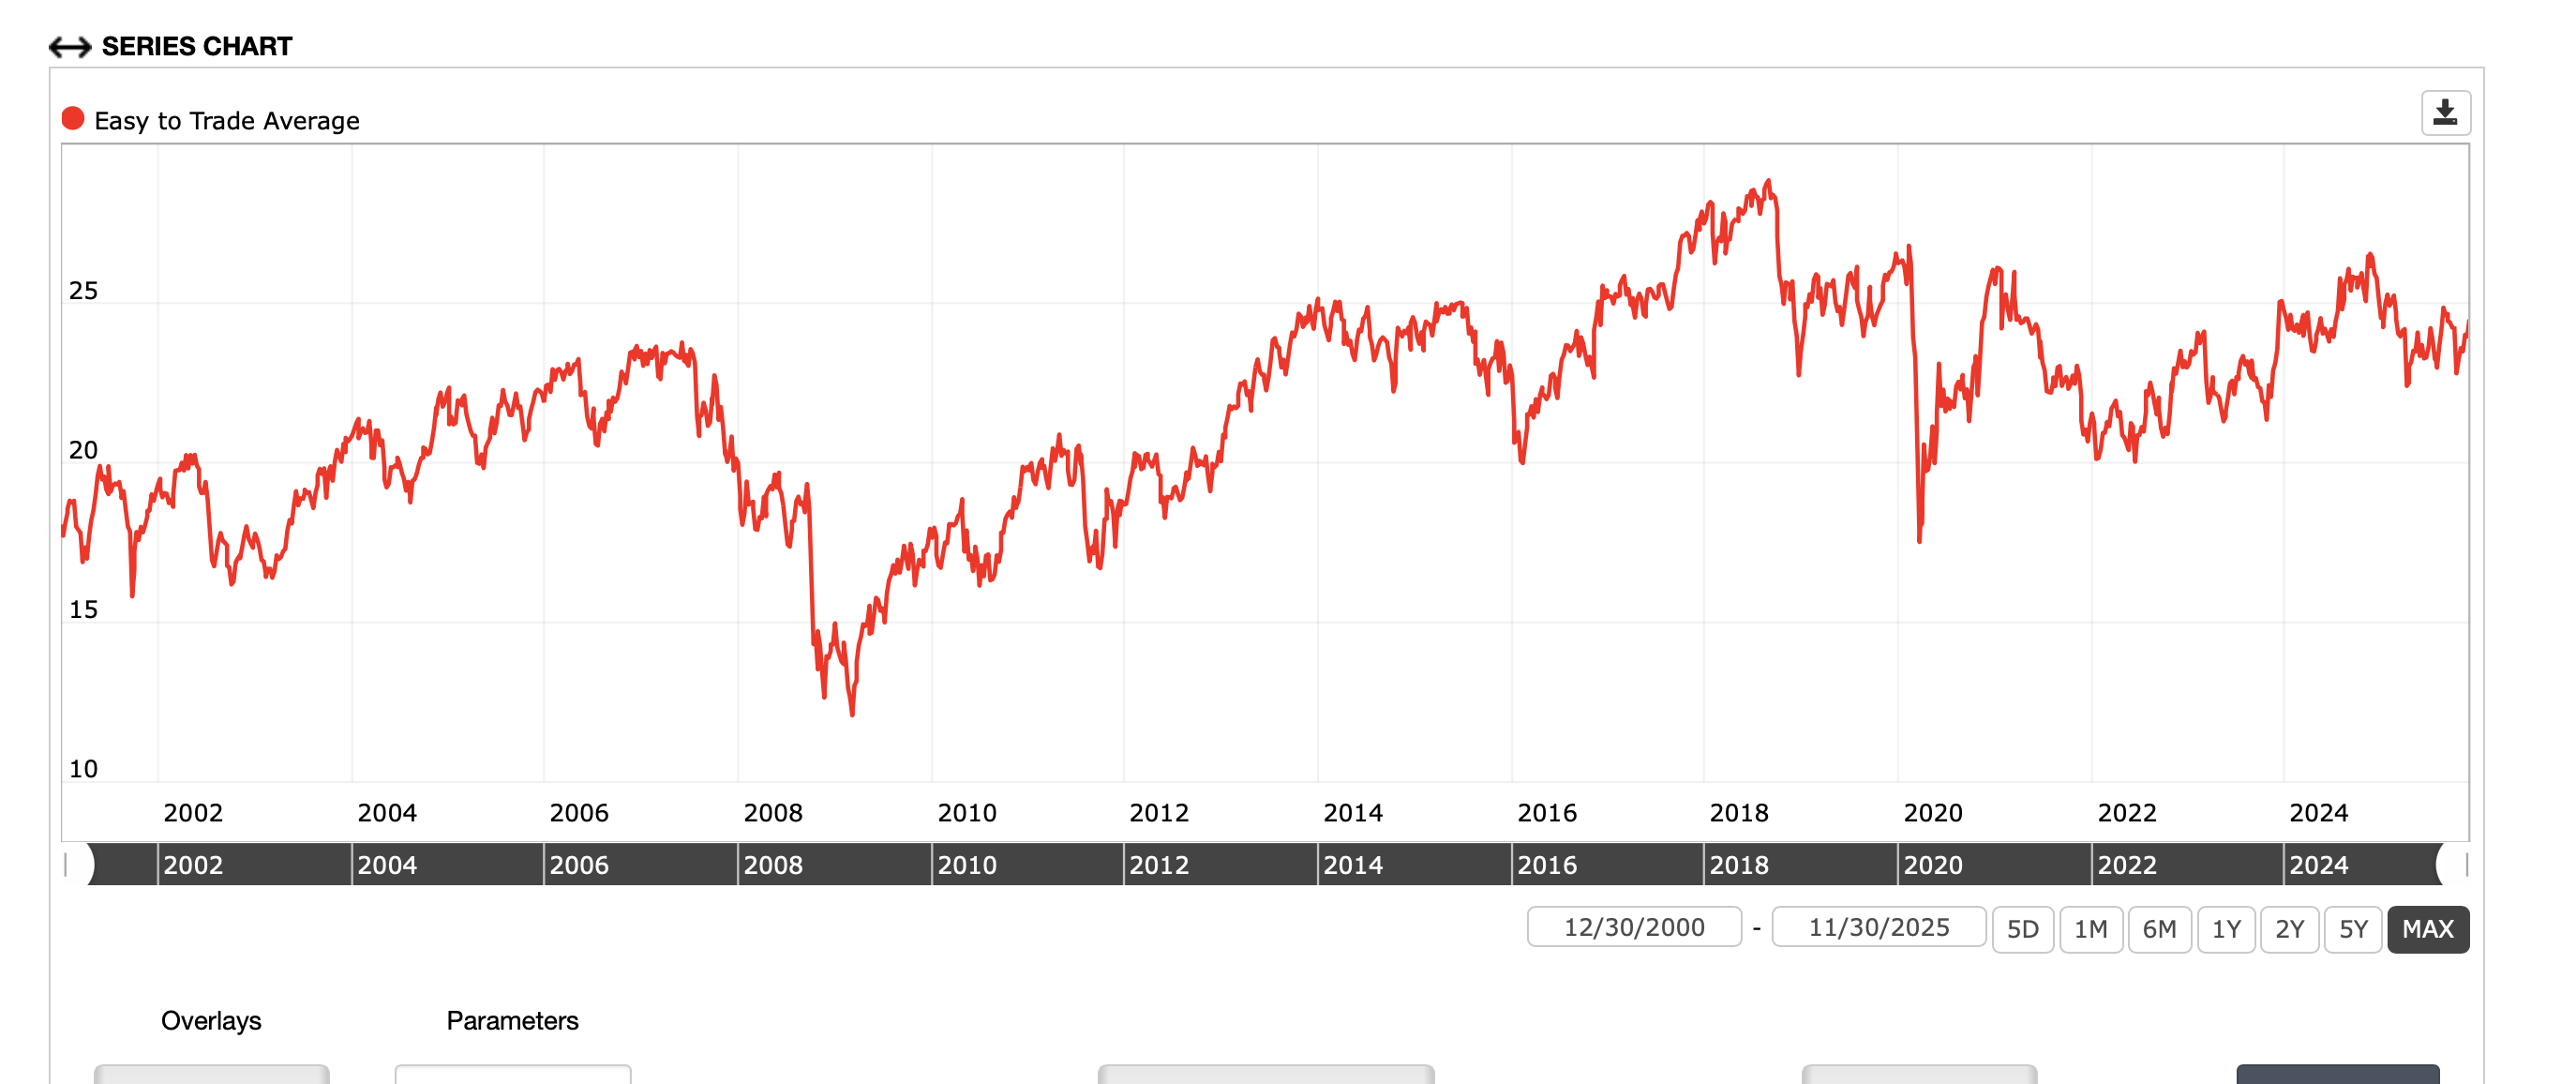
Most ML models using MSE as a metric assume you are using excess returns relative to the mean. If stock data is not too skewed the mean and median may be similar (the same in non-financial data with a normal distribution). Maybe UnivMedian() will give you better results than UnivAvg(). Here is the result of UnivMedian() which does not seem to have the same issue around the beginning of 2010 :
So this does not look like the screen still. It is different. This is the average price of all stocks that day. Which is sort of what you want. But you really you want the average return over a period. The math of using average COULD work in certain situations–like no stocks entering or leaving the universe and Price taking into account dividends. I question whether or not it is working here, however.