Has anyone else tried to recreate AI Factor predictions in the special case of using a Linear Model? I have attempted this but get differences that I am unable to reconcile. Here is my workflow
Download the Importance Weightings From a Linear Prediction Model
Download the Factors DataSet for that Prediction Model (w/ same Normalization, NA Handling, and Outlier settings)
Import both into a spreadsheet and perform a simple SUMPRODUCT to recreate the AI Factor Prediction.
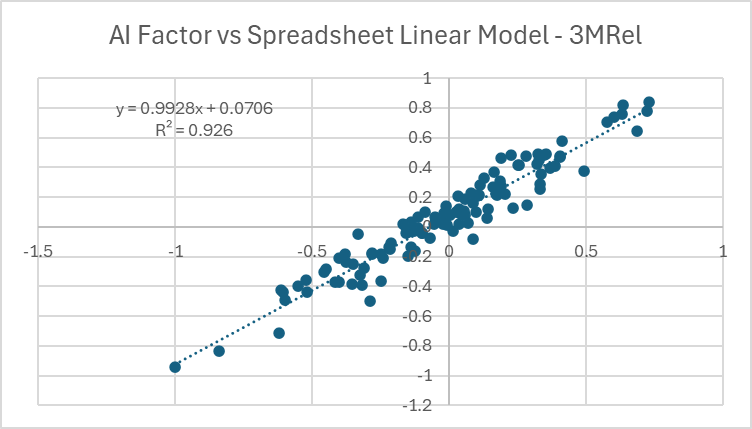
I can't think of any reason I shouldn't get exactly the same results, but I do not. Here is a scatterplot of the AI Factor Predictions vs my Spreadsheet Linear Model Predictions for a given date.
Clearly, the calculation is "close" to correct, but why isn't it exactly correct?
My gut tells me it has something to do with NA Handling or Normalization, but this should not be the case as the Factor DataSet being used should be the same in both cases.
Hopefully there is something simple I am overlooking. Would really appreciate some help!
The one line "answer" is that you are multiplying pairs of numbers with large precision to the right of the decimal point which loses precision and then summing them.
I've encountered and investigated these situations multiple times since 1977. It starts with the bit which can be either 0 or 1. Bits are grouped together into larger aggregates with a maximum amount of information storable in each one determined by the encoding scheme with binary, integer, decimal, and floating point being the numeric ones. For our example, let us have two numbers with 10 digits to the right of the decimal point (nnn.1234567890). When the two numbers are multiplied together, 20 digits (nnnnnn.12345678901234567890) are required for a complete answer but are not available which means the software/hardware needs to approximate the best it can. It gets even more complicates when mixed formats are involved.
The experiment you have undertaken involves two different machines running two different software suites against sets of numbers with a high degree of precision that are multiplied together and then summed. Getting a difference is to be expected.
We have seen handling of ties in ranks make a huge difference in the past. Ties are broken differently (randomly) each time P123 ranks. Sector data can have a huge number of ties—essentially all stocks in that sector being a tie.
That having been said I don’t know your factors or how bad the problem is with the particular factors you used.
Not a bad thought, but the differences here seem much too large for floating point error. For the dataset in the chart above the average absolute difference in predicted 3M Rel Performance is ~10%. For reference, the average absolute predicted 3M Rel Performance in that dataset is ~27%. So we talking about a average percent difference on the order of 30%. I have a hard time chalking that up solely to floating point error.
Convinced there must be something wrong in my workflow, but haven't been able to track it down yet. Just was able to get to the computer today, so I'm going to keep working on it.
Agree with your point, but in this case I'm not looking at ranks. I'm comparing the Predicted 3M Relative Performance (as that is the target my AI Factor Optimization is using), not passing it through the additional step of ranking the stocks.
I'm downloading the Z-Score normalized dataset from AI Factor and simply multiplying it by the linear weights also downloaded from AI Factor. Can't figure out why the results wouldn't be identical (or it least identical within some allowance for floating point precision.)
So I think I have found the source of the discrepancy. It appears that there is not any consistency in the Normalized Factors values that are returned. To illustrate my point I have chosen a simple toy dataset
Feature Set - P123 Core Combination Ranking System
Universe - S&P500 Large Cap (IVV)
Date - 2023-05-13
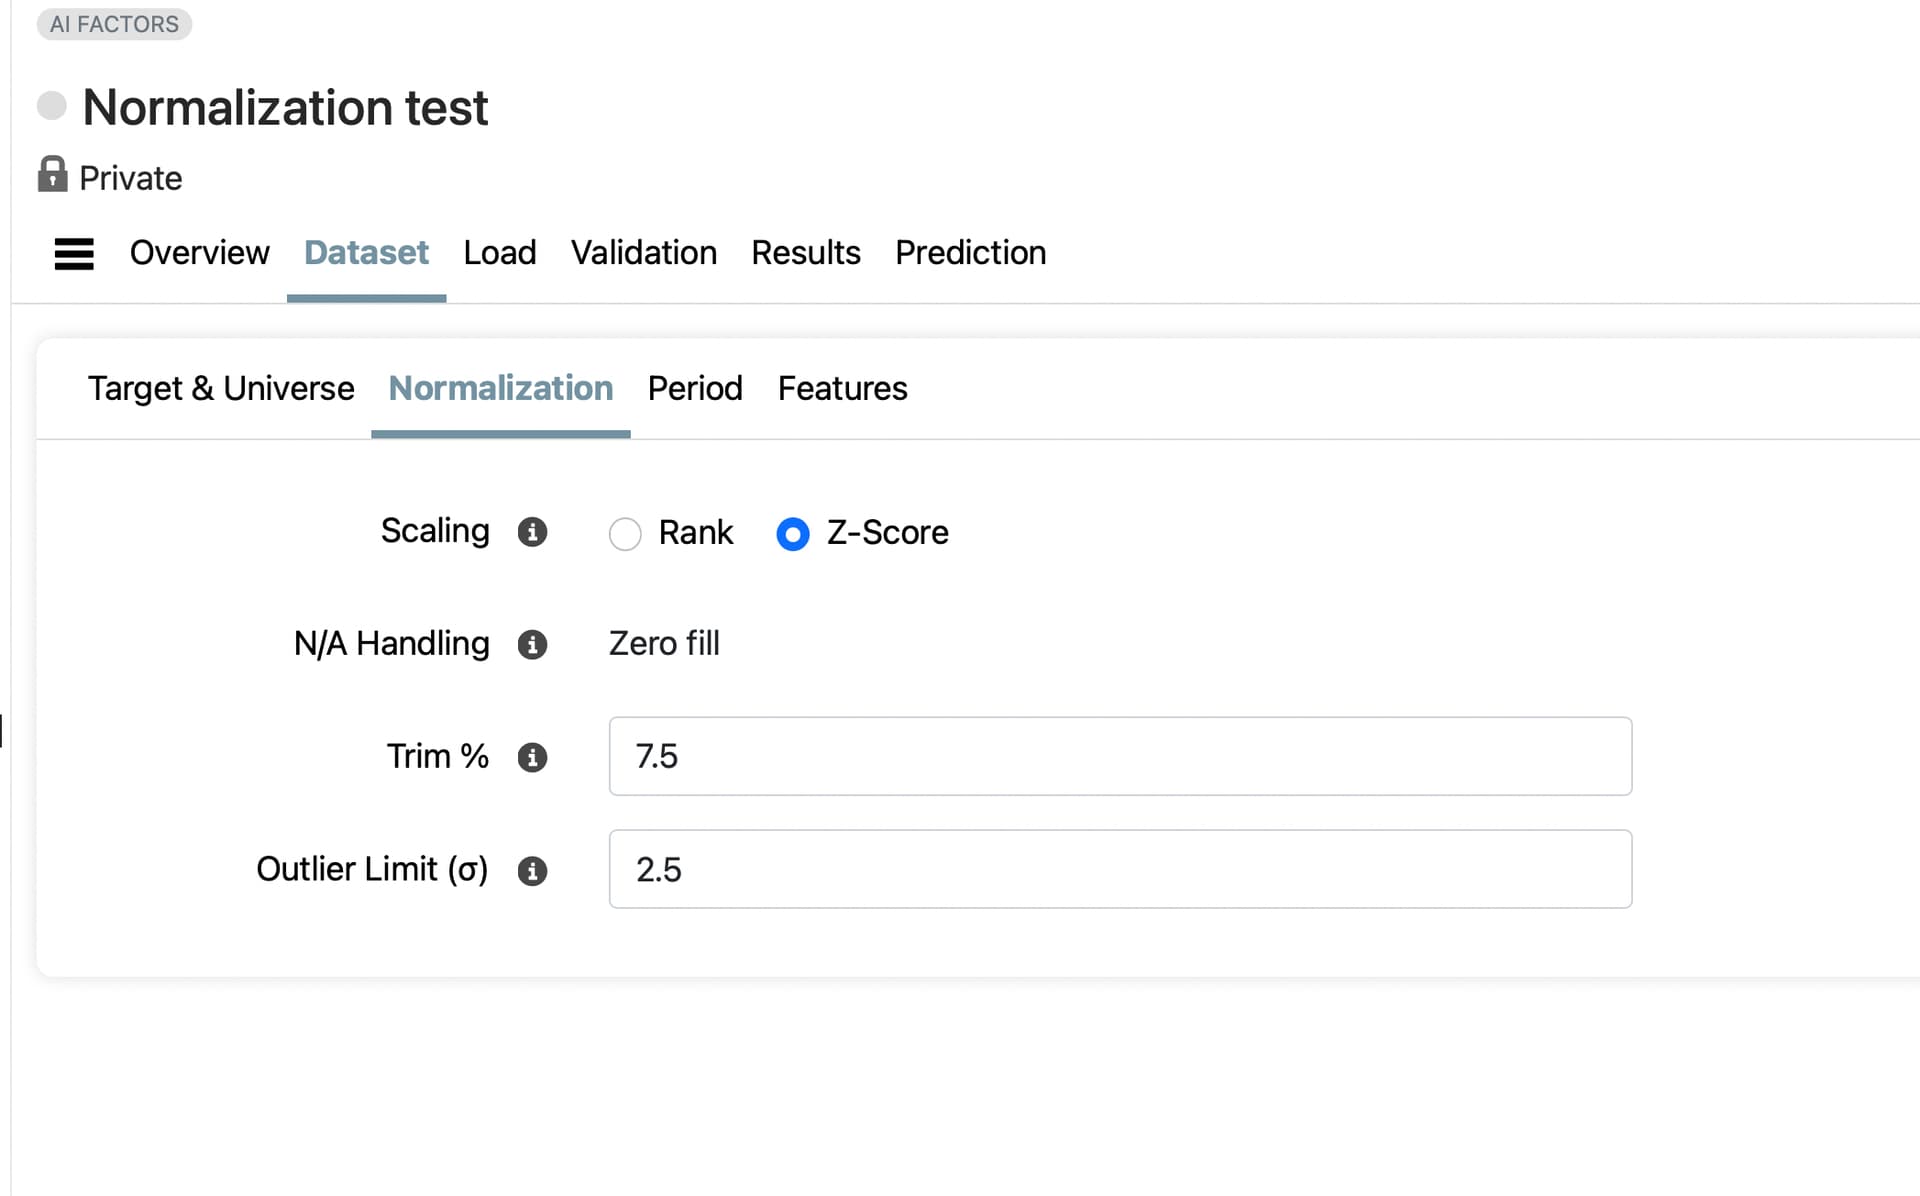
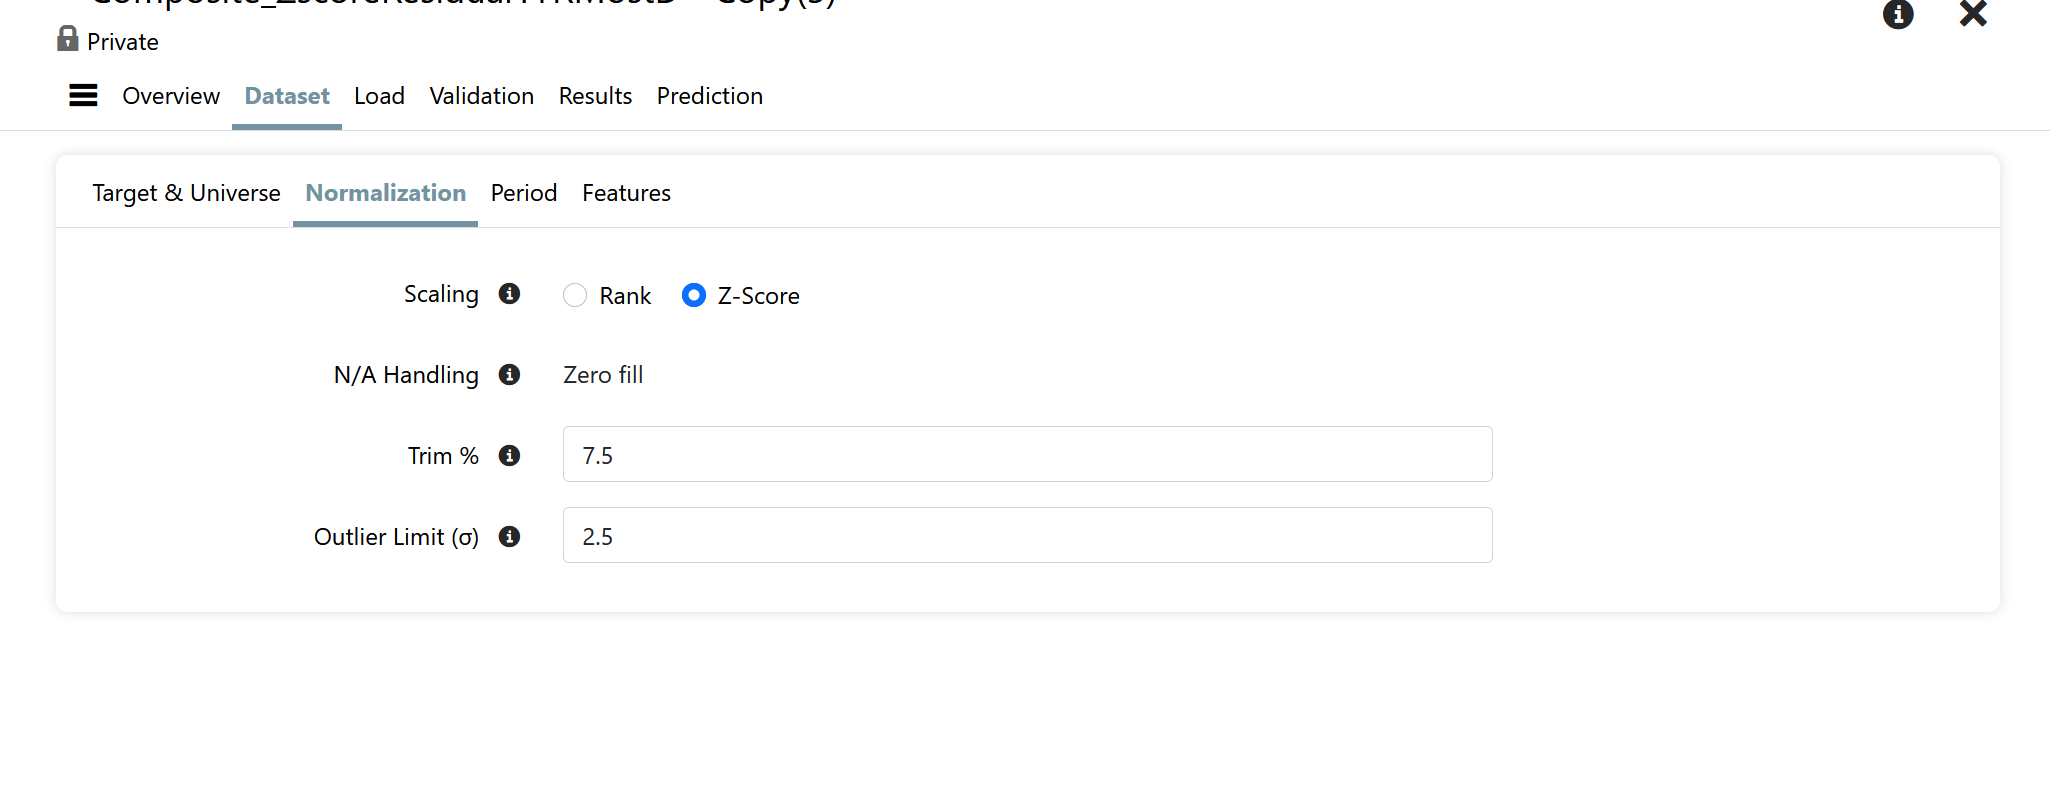
The normalization parameters were as follows
Target Normalization: Date
Scaling: Z-Score
NA Handling: Zero Fill
Trim %: 7.5
Outlier Limit: 2.5
3.) Download Factor Tool (Use Prelims) - Single Date (2023-05-13)
4.) Download Factor Tool (Exclude Prelims) - Single Date (2023-5-13)
Note that the normalization factors were identical between the four methods. However, the feature values returned are different for each case. I have attached my Excel file containing the data to this note. Just to illustrate though, the average normalized score across all 65 Factors for Ticker AOS is the following for each of the download methods, respectively
1.) 0.0628
2.) 0.1856
3.) 0.2221
4.) 0.2194
For options 3&4 the result is quite close because the only differences are in the Factors that are effected by the use of Preliminary values. However, the differences between 1, 2, and 3/4 are quite significant.
I could understand the differences if for options 1 & 2 I was normalizing across the Dataset instead for each Date, but given my current settings I can't come up with any reasonable explanation for the large differences I am seeing.
Side note: Normalizing over the entire period causes some data leakage which may be minor in practice while normalizing by date has no such theoretical problem.
Thank you Daniel for highlighting this issue! I think it may point to something most of us were not aware of, or had not thought about.
Excellent spreadsheet and well-written post. And your logic is correct as far as I can tell. If you are normalizing the features by date there should be few discrepancies.
But maybe a definition problem or maybe something more fundamental about what we think we are getting and what we are actually getting from P123's normalization. With the latter possibility in mind:
You have been able to define the target normalization here.
While you note there is a discrepancy in the features. Where did you define the feature normalization (if you were able to)?
How do we know that P123 is normalizing the features by date? I could not find where I can control that for features (date vs entire period). And I note you are having your biggest problem with feature discrepancy when you use different periods: the situation where normailiztoin would change if you are normalizing over the entire data set.
A candidate for the cause of your problem—based on a very superficial assessment. But unless you can show me where we control whether the features can be normalized by the date or the entire period (or it defaults to normalization by date), I think it is a good candidate for the cause of the discrepancy.
Addendum (cannot see how to set the date vs entire period normalization for features here). But I may be missing something:
I think you found the source of the discrepancy. I was misunderstanding the inputs to AI Factor. On DataSet > Target & Universe page there is an option to set Target Normalization to either Date or Dataset. I was reading that as "what will normalization target? date or entire dataset" and assuming that applied to Features as well. In fact it should be read as, "How should the Optimization Target be Normalized?", and this setting apparently has no impact on how the Features are normalized.
It seems you are correct that there is no way in AI Factor to control whether Features are Normalized by Date or by Dataset, and they are in fact always Normalized over the entire Dataset. Therefore, two AI Factors with different Dataset Periods will always have different Normalized values for its Features even if all the other values are the same.
This explains why my results are different for each of the 4 Download Factor methods I tried above. Options 1 & 2 have different Dataset Periods over which they are normalized, and Options 3 & 4 are normalized just over a single day.
A few thoughts on this
1.) Why isn't this a parameter we can adjust?
2.) Does it makes sense to normalize the Optimization Target by Date while normalizing the Features over the entire Dataset Period?
3.) Of critical interest to me... what is the difference in how normalization is handled between the AI Factor Validation step, the AI Factor Prediction step, and then most importantly when a AIFactor is being used in a Live Strategy.
The last point is one that needs some explanation. I assume that AI Factor Validation normalizes the data just over its respective training period, and AI Factor Prediction normalizes the data over its (presumably larger) training period. Is that correct, and if so what happens when I call AIFactor("AIFactorName","PredictorName") in a Ranking System? Is the data normalized based on the full dataset that is used when the AI Factor Predictor is created, or is it normalized based on some other arbitrary data period?
Rank, obviously, normalizes the features by date. Some members using z-score normalization might be interested in whether z-score normalization by date would outperform rank normalization by date. That would likely require a feature request—as Daniel points out.
It is not good practice to normalize over both the training and test data, since that causes data leakage. I’m not sure what P123 is doing in this regard, but it should not be very compute-intensive to do two separate normalizations—one for the training set and one for the test set. It’s just two means and two standard deviations instead of one per split. For example, 10 instead of 5 in a 5-fold validation.
Finally, if you are normalizing the target by date, you cannot convert z-score predictions back into raw return predictions, because you don’t know the mean and standard deviation of the unseen data you’re predicting on. Those values can only be calculated once the period has passed.
What the market will do — including direction and magnitude — is unknowable in advance, and often the most important piece of information for predicting returns for an individual stock. Using future means and standard deviations to recover raw values is not prediction, it’s hindsight.
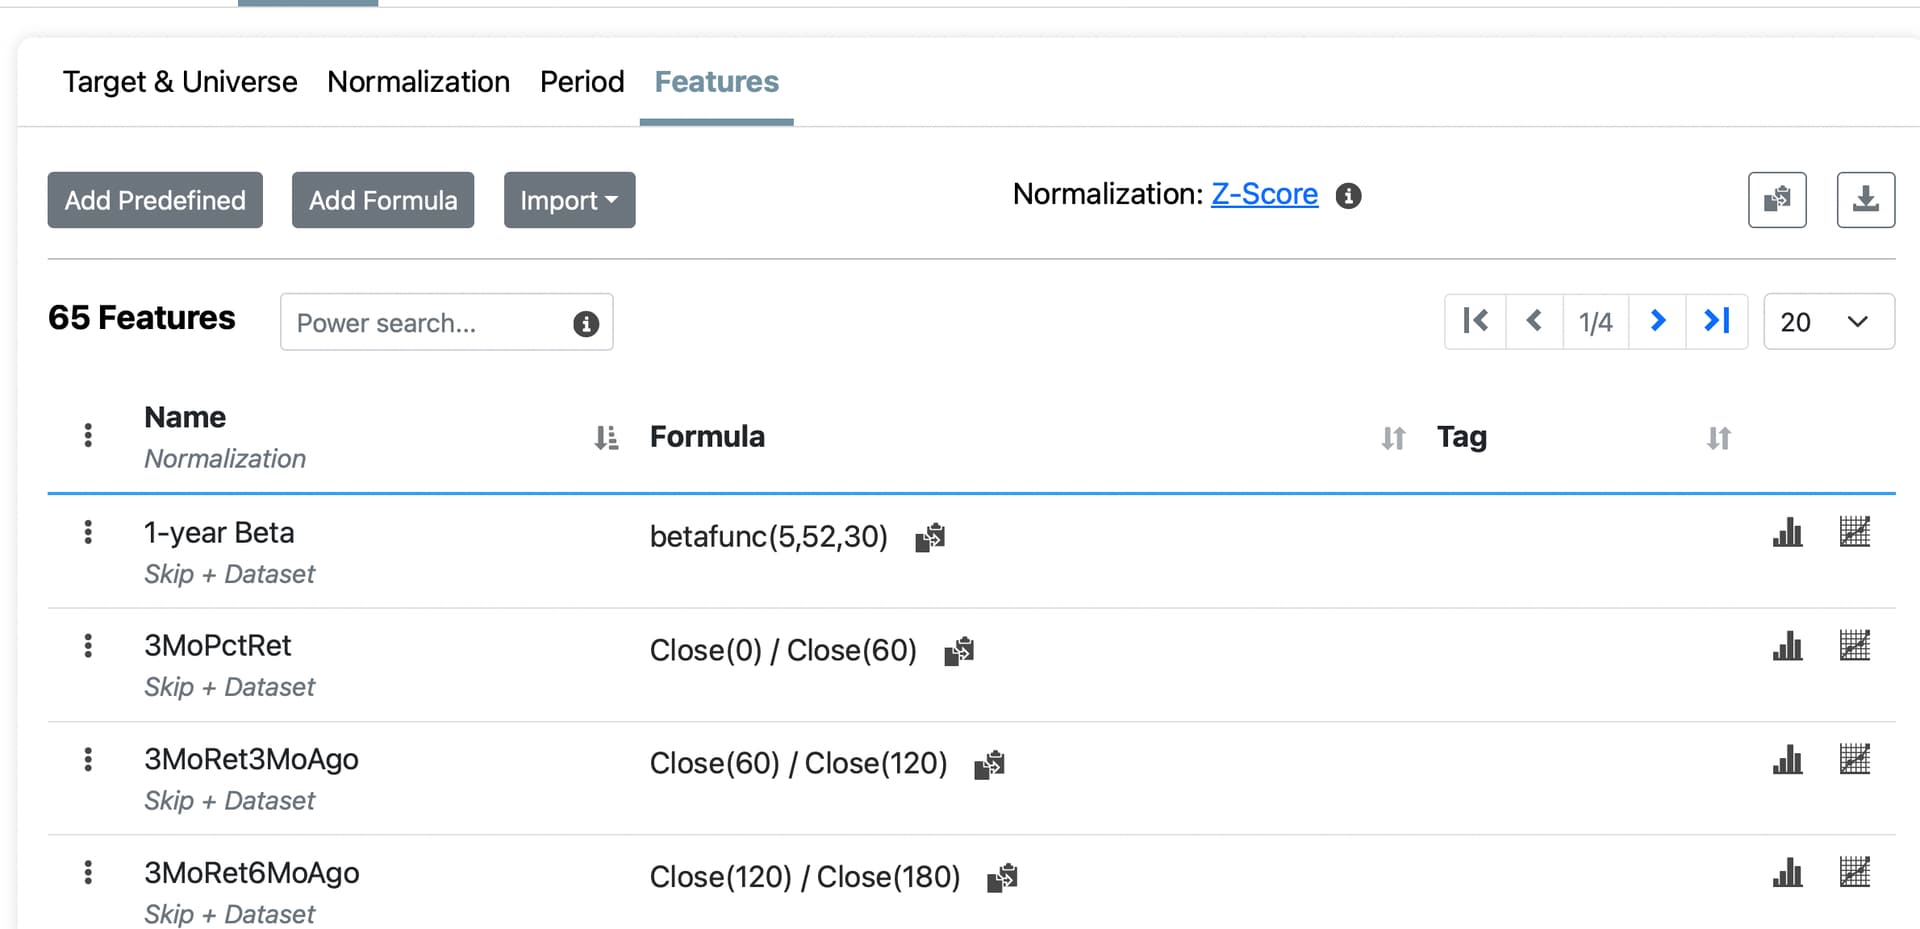
Thanks to P123 Staff discovered that it is possible to Normalize Features by Date. It can be set for each Feature individually on the DataSet>Features tab by editing the Feature and then setting the Step 2 Normalization to Date from the drop-down menu. Alternatively, you can download the Feature Set to a csv and change the entire Step 2 Normalization column to Date. Then simply delete the Feature Set on the DataSet>Features tab and reupload from the csv file.
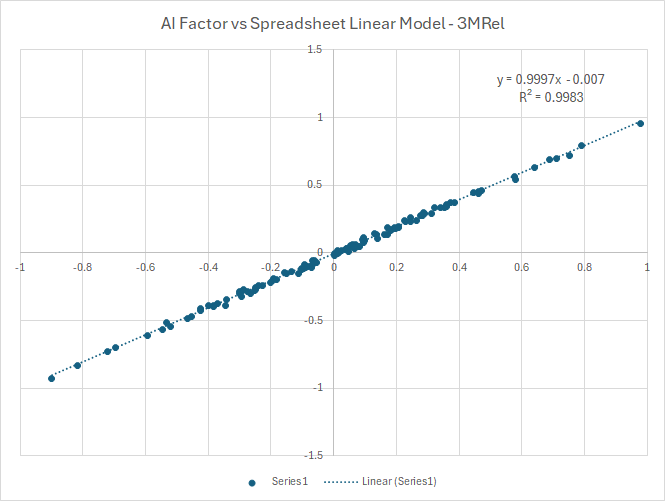
Having done this step I am able to recreate Linear Model predictions in a spreadsheet and then compare them against the results of an AIFactor function call with satisfactory results.
This only leaves me with question 3 from above that I am hoping P123 Staff can clarify. Specifically,
If I Normalize a Feature by DataSet instead of by Date are the same normalization factors used for Validation Data, Test Period Data, and New Live Strategy Data?
That is my current assumption. If you normalize by DataSet (which is the default) the Feature will be normalized by the mean and standard deviation of the entire DataSet, which by definition seems to imply that future data is being used to adjust past data. (Some clarification from P123 is needed on this.)
I haven't decided how big of a deal this is for training the model. In the particular model I am working on at the moment, I get slightly better out-of-sample results when I normalize my Features by DataSet instead of by Date.
The other question that all of this raises for me is how does data outside of the Training Data get normalized before getting sent to the Model when normalizing by DataSet? Is it normalized based on the Training Data mean and standard deviation, or is it handled in some other fashion? If normalizing by DataSet does the mean and standard deviation used for normalization ever adjust when a model is being used for a Live Strategy, or is the Training DataSet mean and standard deviation always used?
I don't see a post giving the final decision on some of the questions.
I do think it is clear that the ML predictions for the target will be z-score predictions as long as the target normalization is set to z-score (whether normalized for data or entire dataset).The ML is only able to predict a target that it is trained on. When using entire dataset normalization, those predictions could be transformed into raw returns (based on the mean and standard deviation of the training data) but P123 does not do that automatically now. And it cannot do it for some target data as P123 is not allowed to give us raw data for much of FactSet's data. P123 could do it for returns (and some other pricing data).
The only real question, that I can see, is whether for live ports the predictions are online. Meaning whether they are restrained on new data that comes in after each rebalance. Marco gives a clear discussion of this option in his post—including the cost involved.
I am pretty sure that if there were retraining of the models going on after each rebalance we would see it in our AI/ML charges. We might be able to make a feature request for automatic retraining after a set period. Say every X number of weeks, months or quarters (retaining would probably have a charge).
Maybe that could be considered as a feature request after some discussion. Feature request: option of automatic online training of AI/ML models.
Maybe P123 can clarify, expand upon or verify some of this for me and other members. And correct me where I am wrong.
P123 is working on integrating an advanced LLM that may have full access to the code. Even members with a rich understanding of machine learning can miss things in the menus (like the option of normalizing features by date), if nothing else. There is also the potential that the LLM could calculate things like predicted raw returns when asked (whether there is a menu option for that or not).
Of course P123 cannot train on (or even validate with) future data. As far information leakage from validation data in the past, P123 is excellent about providing gaps for times series validation and for the k-fold validation. Including an embargo period after the validation data.
Providing an embargo is a fine point that is often missed.
Doing validation correctly is hard and P123 makes it easy. You almost can't do it wrong even if you want to,
P123 may normalize both the training data and the validation data at the same time. Before proceeding with the training and testing steps. Marco considers the pros and cons of this here:
@AlgoMan had the same consideration—presumably for his downloads or API.
Both Marco Algoman are considering the pros and cons of normalizing the entire data set at once (training and validation sets together) vs normalizing just the training data and using the same mean and standard deviation to normalize the validation set.
Its both thorough and advanced on their parts to consider this. They both argue that it probably does not make any meaningful difference which way it is done.
James is correct. Normalization is determined once over the entire dataset at load time. Earlier versions were more careful about restricting normalization to the date range in use, but we simplified that behavior to make the process more consistent and user-friendly.
Since Z-score normalization is a linear transformation, algorithms are generally insensitive to whether it’s applied over the training period or the entire dataset. However, Trim % and Outlier Limit do alter the distribution, so if outlier activity is strongly time-correlated, those settings could introduce some differences.
Thanks for the clarification. Can you provide any details on how data is normalized when using AIFactor in a Live Strategy? I assume that it is normalized using the parameters derived from the training data, but I wanted to make sure that was the case.
For dataset normalization, feature data from live AIFactor usages are normalized using the coefficients computed at dataset load time. For date normalization, coefficients are computed on the fly as one might expect.