Hedge with TLT or Short on Index

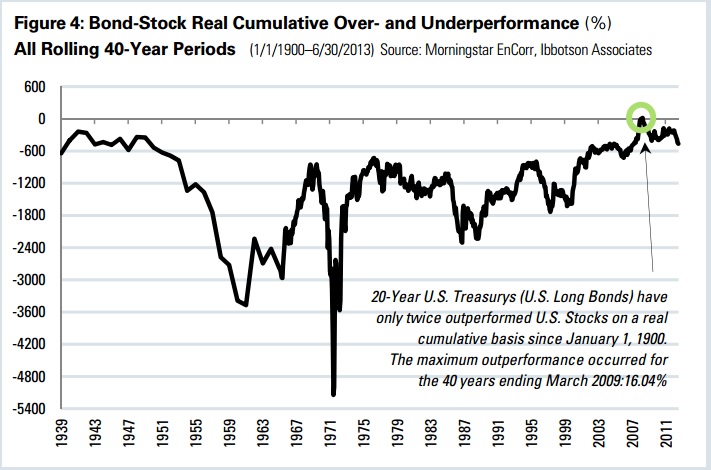
The fact that you brought 2006 into the discussion is reason enough for me to tell you to avoid TLT. The rate was 4.65% in 2006. Now it’s 2.55%. That’s a heck of a lot closer to zero than it was in 2006 so no matter what happens in terms of inflation or disinflation, there is only so much more room it can run.

Only so much more room is, of course, not the same as zero room. So if you had presented an argument for stability or flattening based on an analysis of the economy and solid reasons why you believe there will be enough additional news on the inflation/economic activity front to justify another nudge down, to 1% perhaps, or even to keep it at or near 2.55% and that you’d done the math and balanced the potential reward if you’re right versus the potential hit if you’re wrong, and assessed the relative probabilities of each, I’d say that if you were comfortable with your analysis, then by all means, go for TLT.

But that’s not what you’re doing. By pulling a completely irrelevant datapoint from 2006 into the discussion, I get a sense that you’re straining for ways to justify use of an asset that worked so wonderfully in simulations. That’s the kind of approach that can hurt you very badly. Please don’t do that to yourself.

And by the way, nobody has followed up on the point I made that TLT is even more dangerous than the 20-year treasury. The latter has a maturity date and every day between now and the, the bond will be priced with reference to that anchor of value. TL:T is an ETF that is obligated to roll its portfolio over such that the time to maturity id always 20 years. In other words, there is no maturity date.

That means TLT can’t trade like a 20-year bond. It will actually trade like a British Consul securities that are perpetual (Anyone here from the UK? Do they still have those?) This was a great feature when TLT and other fixed income funds debuted and got popular. It allowed the funds to outperform the bonds. But if rates rise, you don;t want to touch these funds with a ten foot pole since they’ll be much worse than the bonds.

If you want fixed income vehicles, consider target maturity ETFs, or surf around on Treasury Direct, through which it’s pretty easy for individuals to get direct ownership of treasury securities. At least that way, you have maturity dates. And, of course, bank CDs are fair game. We can’t really simulate it on p123. But simulation is a tool, it;snot the be all and end all of life. My recommendation is to simulate with cash as the hedge vehicle, and then do your fixed income things with short-data-history and not-to-testable target maturity ETFs, CDs or Treasury direct.

Hi,

I can only support Marc Gerstein’s view.
20yr Treasuries are a generational selling opportunity.

http://www.osfunds.com/Pdf/OSFunds_GenerationalSellingOpportunity_Aug-2013.pdf

This newsletter form O’Shaughnessy has great charts dating back to 1926 showing the return of 20yr Treasuries compared to the SP500.

Showing what a bad investment they have always been over various holding periods (10, 20, 40 years). You would have lost money 50% of the time on a real inflation adjusted basis.
Over 20, 30,40 year holding period stocks are a less risky investment than bonds.

The outperformance of the last few years is an extreme event based on QE, which will revert back to the historical mean badly for anyone who holds them.

P.S. Yes I do read authors besides O’Shaughnessy.


Here is a link to stock and bond returns going back to 1929. The treasury featured here is the 10 year not the 20 year. Putting inflation aside for the moment, regardless of the interest rates in the period viewed, bonds have done theur job when the market went south. There are very few years of negative returns. Bonds did not always have huge gains when the market tanked, but they certainly didn’t lose anywhere near what stocks did.

http://pages.stern.nyu.edu/~adamodar/New_Home_Page/datafile/histretSP.html

Stocks typically go down because weak economic activity causes profits to weaken. That same economic weakness causes interest rates to fall and it’s the fall in interest rates that causes bonds to rise.

Damodaran had those numbers in a spreadsheet used to help people compute historic risk premiums. Check instead, this Washington Post story based on some grunt work done by the Bank of England’s Chief Economist:

"This is the best time to borrow money in recorded history.

"That’s right: Interest rates are lower today than they were when FDR or Napoleon or Henry VIII or Genghis Khan or Charlemagne or Julius Caesar or Alexander the Great or even Hammurabi were around. Or, if you want to put a year on it, lower than at any time since the ancient Sumerians made the first loans, payable in either silver or grain, back in 3000 B.C.

"That, at least, is what Bank of England chief economist Andy Haldane found when he went digging through the historical record. Now, it is true that rates almost got all the way down to zero during the Great Depression, but they have gotten all the way down there today. "

http://www.washingtonpost.com/news/wonkblog/wp/2015/09/24/this-is-the-best-time-to-borrow-money-in-all-of-history/

Look, if you want to burn your money, fine. I get it. I’m actually working on a novel about a Bernard Madoff-type protagonist who gets the case against him dismissed because as it turns out he described the Ponzi scheme in detail in a registration statement he filed with the SEC. This was inspired by my belief that the real-life Madoff’s only mistake was failure to disclose. He had such a great reputation, I believe he’d have still raised all the money he wanted even if he told them straight out it was a Ponzi scheme. In my novel, after my protagonist walks free following implosion of his fund, he raises money for a new one. And guess what: He succeeds . . . and then some. I often encounter readers who wonder if my portrayal of investor reaction is plausible. I think, perhaps, I may need to print out this thread to prove that yes, when people fall in love with something, they stay in love facts and reason be dammed. (Or I may wind up with a second novel.)

I don’t know what else to say about TLT. Drinking and driving, smoking, buying long-duration treasuries packaged into a perpetual (non-maturing) security when rates are at a 5,000 year low. People still are going to do what they do. No wonder behavioral finance is growing as a field.

Marc,

Don’t get me wrong. I am mostly in your camp. I like to predict gloom and doom but I never make any money doing it. And timing is everything (which I would not get right if I tried). But I wanted to mention Sweden’s negative interest rates: which, as you say, is not likely to occur on a large scale. From your referenced article:

“…in fact, if Sweden is any guide, rates move down into negative territory before they move back up.”

Marc,

What are your feelings on IEF (Intermediate Treasuries) or bonds in general for that matter and their place in an overall portfolio?

I’m working now on something along these lines for Forbes positing. Generally, my favorite things are target maturity funds (you can find a bunch of these in the ETF screener from Guggenheim and iShares) and general fixed-income funds.

The key is to do one of two things. If you have a fixed maturity fund, get one that will liquidate at maturity. That way, at least you’re getting genuine fixed income, rather than an artificially constructed perpetual Consul-like security. The other approach is to get a fund that’s more general in strategy, one that allows the portfolio manager to adjust maturities/durations based on perceived market conditions. Our mindset is to prefer rules to seat-of-the-pants decision making. But we’re doing so for equities, where we are able to make rules that work for us. We have to be careful transferring this mindset to fixed income. Aside from target maturities, we should be happy to have portfolio managers who’ll assess the market and react.

You may find yourselves looking more at corporates if you do this. So yes, you’re taking on credit risk (and getting paid to do so – via a yield that’s a bit higher). But realistically, nowadays, the investment grade market is limited to companies that are so strong financially, that we can afford to devote more energy to worrying about interest-rate risk. (Junk bonds are an entirely different matter which I’ll take up another time.)

Botom line – intermediate is fine, so long as you can actually get a fund that in effect matures in the intermediate terms or one that has the flexibility to adapt as needed.

Oh one more perhaps very important thing.

Don’t be too obsessed with ease of one-stop trading. If you want an intermediate thing like IEF, model for it but when it comes time to execute, don’;t buy the ETF with real money but go instead to Treasury Direct (a very consumer friendly venue) and buy the actual treasury securities. Or even bank CDs.

I’m not sure the ETF industry has done as well as they can (and eventually may) in adapting to fixed income – easy to understand considering that these things debuted when interest rates were falling, bonds were in a monster bull market, and even bad ideas produced great returns (a characteristic of any bull market). I thin they’ll get it right eventually, and I suspect sooner rather than later because there’s so much money on the line. So don;t force yourself to accept the first wave of product they pushed out the door. If I wanted to hedge anything, I’d just set the hedge vehicle to cash and implement via cash accounts, treasury direct or CDs unless I found a fixed income fund that genuinely matches what I want.

Just be an aggressive ETF customer. If you don’t find product you like, do your fixed income elsewhere.

I don’t consider myself a contrarian investor but maybe now I am. The only concern I have with using TLT as a hedge is the likelihood of long-term, persistent US inflation. However, I believe that has a low probability of happen anytime soon - say within 2 to 5 years. Why?

The long-term trend: US inflation has been declining for the last 35 years and the trend line on the attached plot shows that the trend is still in place. I don’t expect a long-term trend like this to change quickly.

The short-term trend: China, the Eurozone and the US have all shown declining inflation rates over the last three years. That could be a problem since each economic zone is capable of exporting it’s disinflation. If QE fails in Japan or the Eurozone, or if China has furthering economic weakening, a currency war could breakout w/ the $US getting even stronger. Even without a currency war, the Fed - in a accidentally release of an internal paper - reportedly doesn’t expect US inflation to reach it’s 2% target until 2020.

Again, my major concern with TLT is that of inflation. So where to look for signs of inflation? I like to keep an eye on what’s happening to US households.

So far, median household income growth is low at less than 1%. That looks non-threating.

Average earnings growth is stable at about 2%.

There’s been a slight increase in HH debt after a period of deleveraging. However, I don’t get the sense that households are really in a mood to accept more debt.

I’m not sure what to make of gross domestic income growth. It’s trend appears to be negative since 1980.

A slight surprise was the year-over-year growth in bank credit. That’s worthy of watching closely.

But I also want to be clear. Long duration treasuries are expensive. But equities are expensive, too. So is real estate. We’re a long way from the 1980s.

If inflation will be a problem soon, please tell me why. If there there are other threats to the TLT besides inflation, please let me what they are.

Constructive are always appreciated.

BTW, if anyone could tell me how to post images inline, i’ll edit the post accordingly.


I suspect you may be right about inflation.

My concern is with the other part of the equation; velocity of money, the pace at which money circulates. It doesn’t get much media chatter, but it’s out there is a bog way. When you read and hear all about income inequality, people not sharing in the economic growth, etc. ultimately, this is all about velocity of money. So it really is a pretty big, albeit not precisely named, issue.

As i look for economic excesses (the things that cause problems in the markets), the one I’m seeing is in velocity, which has been trending down for a ver long time and is now at really extreme low levels. An increase in V can push interest rates upward, and with rates so low, it only takes a small push to whack TLT hard.

(By the way, Velocity is among the series you can see and work with on p123 in our data>>macro area.)

Hi Marc,

Yes! The velocity of money and it’s long-term decline is a big deal. My own pet theory - completely unsubstantiated - that income inequality has removed a lot of money from consumption appears to agree with yours.

Best,

Walter

EDIT: the Fed’s money multiplier is worth look at too. Please ignore the html link.

EDIT: Only the long-term multiplier chart is important. I would delete the others if I knew how.


M1 Money Multiplier - FRED - St. Louis Fed.html (262 KB)


fredgraph.png


fredgraph (1).png


The question of where has the money gone and why isn’t it circulating is certainly an interesting one. With all the trillions unleashed by successive rounds of QE the trillions that evaporated during the Great Recession have probably been more than replaced, so we’re back to the same speculations as before. Where are the financial glaciers sucking up and storing all the money? Chinese savings glut? Global housing bubble? Corporate profits locked away sitting idle overseas waiting not to be taxed? Forex reserves? Income inequality fits neatly into the narrative.

There was an article posted on the St. Louis Fed website last year entitled “What Does Money Velocity Tell Us about Low Inflation in the U.S.?”. I didn’t find it as interesting as one of the comments posted;

What Does Money Velocity Tell Us about Low Inflation in the U.S.? - Comment

I’m trying to recreate the M2 velocity and 5-year yield chart just for verification.

Interesting topic.

Does anyone think that the Fed paying interest on reserve balances held on deposit at the Fed has anything to do with the money velocity? Is there less motivation for a bank to loan money when they can get interest with no risk? Or is this not a significant factor? Walter’s graph does show that the velocity of money was declining long before the Fed started this policy in response to the 2008 recession but there was also an abrupt change in 2008 that has not corrected.

Edit: so the first graph is M2 supply and not velocity. Sorry. The second confirms Walter’s suspicions about the M2 velocity, I think. There is a huge decline in 2008 in the M2 money velocity that has continued.

Thanks,

Jim


The that dip starting in the mid-1990s also coincides with a generational leap in IT and autonomation. The proliferation of the internet, client-server (and subsequently web) architecture replacing expensive proprietary mainframes, Moore’s Law making computing memory cheap and available, etc. The Y2K threat is generally now looked on as a nostalgic hoax in hindsight, but it did motivate people and entites to pour vast resources into system and software upgrades in the mid-late 90s. What were the ramifications this technological revolution had on global aggregate supply vastly outpacing the aggregate demand, the erosion of artificial scarcity and money becoming more sticky? Post scarcity economic theory often quickly devolves into hyperbole and science fiction territory, but I’m not sure there’s not something there.

Then again, maybe it’s just a meaningless correalation.

Here’s a link to my latest Forbes post, which illustrates a huge problem with TLT that makes more dangerous than many may expect in a rising interest rate environment:

http://www.forbes.com/sites/marcgerstein/2015/09/30/fixed-income-etfs-are-riskier-than-you-may-realize/

Sponsor claims that effective duration is about 17. So 0.25% increase in rates leads to approx 4.25% decrease in price neglecting convexity (by the way there is no convexity data in public sources?). 4% decline is not a disaster, 50% drop at market open for one stock in 5 ticker port that’s a disaster:)

In the chart you referenced on long term rates back 5000 years, the long term rate appeared bounded in a 4-6% range, with a big run up and down in the 60s, peaking in the 80s and down to today’s low levels. While everyone expects rates to rise, the path of the rise will encounter another recession and where will rates go then? Lower. Bonds will balance the loss of equities in that scenario. Based on debt accumulation and demographics, growth could be dampened and then contracted cash flows will have value. I do not intend to own TLT without regard to the rate environment. If by a miracle, growth roared back, it would be a noticeable laggard to equities.

With rates as low as they are, I would suggest that every present value of discounted cash flows are at or near a peak, unless there is a source of growth that has not been discounted by market participants: PV = 1/(r - g) * CF If equities have the 50 year duration that some academics suggest, unless g surprises us, ALL valuations will be pressured.

To your point however, I heard from an ultra-high net worth advisor that his very large Swiss bank employer asked him to have clients acknowledge by signature that government bonds were not considered in the “low risk” category of assets.

Marc,

You have made some great points about TLT but some points that are debatable.

First the valid points:
The vast majority of the backtest period is known not to represent the future. 1999-2012 saw falling long term rates. TLT will act different during rising rates. Therefore any R2G that includes TLT should justify it and explain the risks clearly.

Some debatable points:

[quote]
Please, please, please do yourselves a favor and implement the following universal Buy rule: Ticker (“TLT”)=false
[/quote]My bond hedge system is holding TLT right now and I am glad that it is. In a ETF rotation system the low yields don’t matter as much.

Furthermore, long term treasuries can be a better hedge than cash or most other alternatives. You can do worse for a hedging instrument than TLT. A lot worse.

The ideal hedge:

  1. Is negatively correlated with stocks.
  2. Has low volatility during the times that it is correlated to stocks.
  3. Is free or even makes money.

The blog “A Wealth of Common Sense” has a number of very informative articles on the subject of treasuries in a rising rate environment. These are highly recommended if you want to understand what is going on.

Despite the fact that TLT will make less over the next decade than it has over the past decade, TLT still satisfies all three conditions of an ideal hedge. It is negatively correlated to stocks during many crashes even with low starting interest rates. It also has lower volatility than stocks. And finally, people pay money–6% a year in some cases–for a hedge. TLT is free. Would you rather lose 6% a year in the hedge or gain 2% a year (2% or so is the expected return of TLT over the next decade or so in nominal numbers unadjusted for inflation). In fact because of the high prices in the US market, many are projecting US stocks to make < 3% over the next decade. TLT is projected to make about 2%. On a relative basis it’s okay.

Another thing. Marc did not mention the fact that TLT was not a great hedge during the recent market selloff. This seems to confirm the opinion of the naysayers that during rising rates TLT is not a good hedge. But this may not be a valid conclusion. The reason for the underwhelming performance of TLT during the recent selloff seems simple and has little to do with interest rates. It’s because the Chinese government sold Treasuries because of the Chinese crash. When a huge owner liquidates it pushes down the price. During many other crashes (such as 2011) TLT soared. There is no reason that TLT cannot soar again during the next crash despite the low starting yields.

In summary: The 1999-2015 backtest of TLT is misleading, but treasuries may be more useful than cash during a crash.

Chaim

How is that possible that TLT ETF was launched in July 2002 but it shows not zero return during 1999-2001 in P123?