I work on models that are 50% long (Book of 5 of my 5 Stock models) and 50% short position, e.g. net neutral.
I) BUT I want to be careful here, I have no experiance with bonds at all. Please assume, that I know almost
nothing about that asset class (I know they go up when interest falls and vise versa, but how will
TLT react to a 0,25% Rate Hike of the Fed, I do not know).
What are the specific risks of an ETF?: We saw some pretty huge price misallocations last week →
If you where short on the SPY that would not have blown up the account because the price misallocation
would have been in your favor, but what if the TLT gets price misallocations like this?
There is some talk that ETFs are getting mispriced even more and that the “maker” of the
ETF could get broke in a black swan event e.g. your money would be gone. Nonsense?
What are the risks of a long term Bond ETF like TLT?
II) Leverage for the hedge: I simulated a lot of long / short strategies and “on paper” they
work great, especially if you use leverage (super nice capital curve with an annual return
of 70%, mdd of 12% from 1999 - 2015)
Lets say: 100% Long Equities, 100% Long TLT or 100% Short SPY
Thoughts on that idea (my general believe is that leverage is always a bad Idea,
but the performance is compelling especially with the TLT hedge).
Sorry, a lot of questions (especially for a Sunday), but maybe it is
also an interesting discussion, thank you for your help very much in advance!
When interest rates go up, yes bonds decline mathematically - but so should the present value of all discounted cash flows, holding growth constant.
When US interest rates go up from 0-25 bps target, the USD should strengthen further. While China may be a Tsy seller to support their own market, most of the rest of the world would like to own US bonds for the yield they pay and the strengthening currency.
A stronger USD is going to put pressure on EM currencies with USD denominated debt. This has preceded crisis in the past. In a crisis, funds move to USD bonds.
Furthermore, the market has been contemplating a rise in rates since Bernanke whiffed it so the reaction has to be partially priced in. I do expect volatility to increase relative to the past few years (prior to two weeks ago).
Perhaps we are at “peak valuation” of all discounted cash flows. What works in that circumstance? Risk-parity funds which have leveraged positions in bonds are being challenged now because falling rates for 30 years have made this a well performing asset - Gary Shilling and Lacey Hunt has done a great job in calling that trade.
TLT is among the most traded ETFs and is far less likely to break than some ETFs did. Even then, the broken ETFs closed the NAV gap within 30 min.
Bonds are contracts backed by a source of cash-flow, in this case, US taxpayers with the strongest expected likelihood of being paid in the world. ETFs are pools of bonds and the provider matters - my view is that TLT is a convenient way to position in US long bonds. Your risk is not bankruptcy, it is volatility and being on the wrong side of a trend. The other risk of diversifying with TLT is the correlation to SPY may move around, and at time can be positive. So the future may have lower average correlation, higher volatility and potentially negative price trend to geov’s point. In a crisis moments, the correlation to SPY should be strongly negative though as US Tsy are the safest assets where large amounts of money can go.
Shaun, Thank you, I got the same view on the Dollar.
so my Position beeing short Emerging Stock Markets and beeing Long my stock picking models should be fine.
Geov, ok, thank you too, figured that too, even if not, offsetting my Long stocks with short EWM is the way to
go then…
Just do not want to be flat, since I think if a bear market Comes, it will take some months to form and
my modells usually outperform in that Environment…
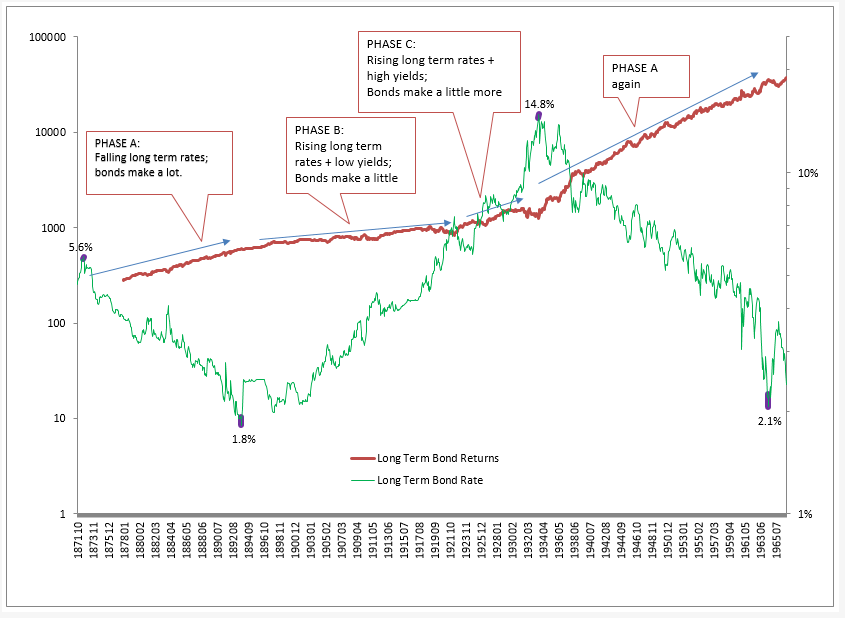
Take a look. We seem to be transitioning from PHASE A to PHASE B:
EDIT: There seems to be bug in Excel. In the first chart showing interest rates the x axis does not show up correctly. The chart actually shows from 1918 through 2014. The first interest rate low took place in 1941 and the second in 2012. The interest rate high took place in 1981. Sorry for the confusion.
RE-EDIT:
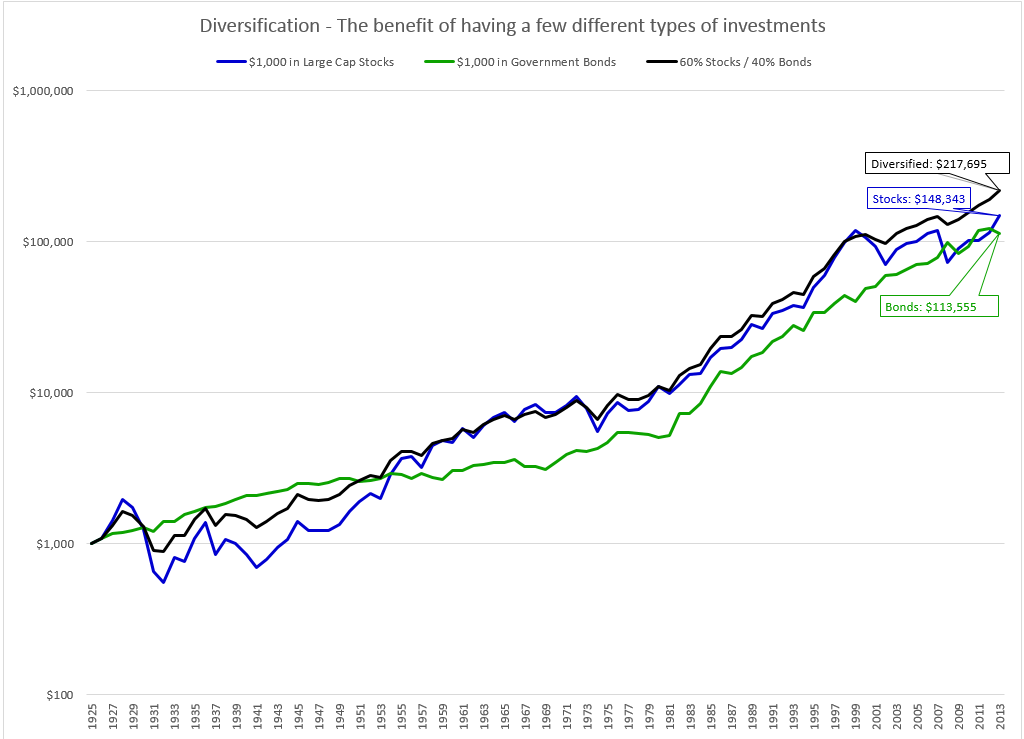
In the second chart notice how during the first phase of rising rates (from 1941 - 1959) when rates were low and there was no major drawdown in the stock market 100% stocks outperformed a diversified portfolio of 60% stocks / 40%. It is possible that we are entering such a period. This is contrast to the 1960-2000 period when diversifying did not hurt returns.
Notice also how since 2000 a diversified portfolio of stocks/bonds did best. This is the period that we backtest on so we can assume that our backtests overstate the benefits of diversification.
Comparing hedging using bonds to shorting stocks on the public Value & Mom $500K - NA neutral portfolio:
Option 1, 100% long 14%, -61% drawdown.
Option 2, 100% long and 100% short SPY. 6%, -33%.
Option 3 Leveraged bond hedge. 100% long, 100% TLT. 20%, -57%
Option 4 Low leverage bond hedge, 100% long, 35% TLT. 16%, -62%
Option 5, Conservative Allocation 60% stocks, 40% TLT. 11%, -35%.
Option 6, Aggressive allocation. 75% stocks, 25% TLT. 12%, -47%.
Shorting stocks removes the most risk but costs a lot of returns. Allocation reduced risk almost as much as shorting without sacrificing returns. Of course, this was using the past period of time that most favors bond allocations. It seems very likely that future bond allocations will not make as much, but bonds should still reduce drawdowns.
Consider a simple stock timing system – for instance, buy stocks when they’re above their 10-month average; sell when below. Such a system will be out of stocks about 25 to 30% of the time.
My backtesting, using CRSP Treasury returns from the 1940s on, shows that bonds perform better than their long-term average when stocks are on a sell signal. Some of the stock sell signals coincide with economic recessions. Bonds also perform well during recessions.
From a long-term perspective, U.S. bonds suffered a long bear market from 1946 to Sep. 1981; then entered a long bull market thereafter. The bond bull market might have ended in 2012, or it might yet set new record low yields. But in any case, the zero bound means that the bond bull market can’t have too much farther to go. At best, one is just hoping for a cyclical bounce in bonds when stocks are sold.
During 1946 to 1981, long-term bonds such as the 20 and 30-year issues owned by TLT were the worst performers as rates rose. T-bills did best. Intermediate-term bonds (5 to 10 years) were a compromise: not the best choice for buying and holding, but a good choice to serve as a hedge while out of stocks, since intermediate-term bonds can rise in price when interest rates fall during a stock market panic or a recession.
If you believe as I do that the years after 2015 will resemble 1946-1981 more than 1982-2012, then you would not want to use TLT as a hedge, despite the excellent results TLT gave during 1981-2012. Intermediate term bonds (such as IEF, the 7-10 year Treasury ETF) are serving as a decent hedge this month, after 10-month moving average models sold stocks at the end of August. If you compare TLT and IEF during the first half of 2009, both sold off badly, but IEF’s drawdown was about half as large as TLT’s. IEI is even shorter-term and less volatile than IEF, if you’re really risk averse.
This is something that has been bother me for awhile.
China has been struggling with disinflation for 3 years. Europe faces it too. Even the Feds internal studies don’t expect inflation to reach 2% until 2020.
So what happens to treasuries if real deflation appears? The US can’t just stop issuing new bonds. So what breaks?
TLT may be the single worst fixed income investment assuming rates move to a rising trend.
It’s the longest maturity/duration, so basis bond math tells us it must experience the worst declines.
But it should underperform bonds, as should bond ETFs in general. A 20 year bond becomes a 19 year bond after 1 year; a 15 year bond after 5 years, a 10 year bond after two years, and so on until it eventually becomes a sort term bond and then matures. So there is a floor that limits potential losses.
TLT starts with the (large) risk profile of a 20 year bond. by the end of 1 year, it’s portfolio will have been rolled over so it will still have the risk profile of a 20 year bond. At the end of year 20, it will have rolled over its portfolio many times and still have the risk profile of a 20 year bond. So unlike a bond, there is no floor under potential losses.
I recently discussed this with a quant i know who used to work on a trading desk. It took me what seemed like forever to get him to understand what was going on. He kept focusing on the perpetual modeling of 20 years to preserve the risk profile. He took it for granted this was a good thing. Not surprising. These ETFs were established when rates were falling and with the help of mathematicians who knew their calculus etc but had no idea that rates were allowed to go up. This is a ticking time bomb that will lead to all sorts of angst, outrage, finger pointing, etc, a gew years hence, when people figure out what happened.
If you want to hedge, don’t get cute picking among the big-name fixed income ETS. go to a short equity ETF or cash depending on how confident you are in your model.
In real life, go to CDs, Treasury Direct for direct ownership of treasury instruments, find a brokerage firm that can handle individual corporates, or target maturity fixed income ETFs (the most obscure under-appreciated segment of the market).
From all my research, treasuries appear to be the only hedge with a negative correlation to equities during times of market stress, while also having a positive expected return. The point of a hedge isn’t necessary to make money but to dampen volatility. To the point of bonds being dangerous at this point of impending rising rates, look at the intermediate or long term bond funds TLT or IEF during 2004 to 2007 when rates rose. Hardly a disaster.
Completely agree with you about the value of Treasuries’ (usually) negative correlation to stocks, positive expected return, and ability to damp volatility. No other asset class can perform this function so reliably in a portfolio context.
As for 2004-2007, that was a rather unusual business cycle in which, despite Fed funds being hiked from 1.00% to 5.25%, long Treasuries barely reacted. In retrospect, 2004-2007 was a kind of early warning about the even more disinflationary period which followed from 2008 till now.
By contrast, from 1946 through 1981, the dynamics were entirely different. Each succeeding business cycle produced a new higher yield in long Treasuries. According to CRSP (B20RET series), 20-year Treasuries delivered a feeble 1.97% annually compounded return during that 36-year bear market.
A return to rising inflation could be up to a decade away. But when it occurs, TLT likely will offer undesirably high volatility, coupled with low single-digit expected returns. In selecting a hedge, it’s a tradeoff between enough volatility to hedge equities, versus the risk of negative returns on long Treasuries if yields rise sharply. Fortunately, yields usually fall during recessions. That’s why Treasuries work particularly well in conjunction with stock timing models.
[quote]
From all my research, treasuries appear to be the only hedge with a negative correlation to equities during times of market stress, while also having a positive expected return.
[/quote]That’s been true since 1987. In the 1970’s up until 1987 gold seemed like it was a better hedge then treasuries.
Correlation is useful only in describing phenomenon within a static population/sample. Correlation observed in context A tells provides no information about context b.
So please, for you own financial well being, DO NOT even bother to calculate much less consider any correlations involving TLT at any point during the period covered by our database and then some. We know with 100% certainty (based on the the basics of bond math) that what was observed during a generation of epoch CANNOT and WILL NOT happen going forward, where sideways interest-rate movement is the best we can expect but upward movement the more probable scenario.
Please, please, please do yourselves a favor and implement the following universal Buy rule: Ticker (“TLT”)=false
If you are of a different opinion and you have anR2G model, I think you owe it to your subscribers to post a pdf white paper explaining (i) why you believe TLT, with its fixed 20-year maturity and best-case hedge vehicle in a falling interest rate environment is also the best-case hedge vehicle in stationary and potential rate environment and/or (ii) why you think interest rates can continue to aggressively fall in the future, even though we’re now starting from a base that’s within hailing distance of zero.
I’m sorry if I’m sounding a bit harsh or shrill here but with increasing rhetoric now calling out sham/data mined financial research, it’s important that I drive home this message and make it clear that the justifications I’m seeing for TLT are the worst examples of data mining I’ve seen anywhere.
TLT is part of the p123 interface as one of the available hedge vehicles. When we designed it, TLT was a legitimate choice (albeit nearing the end of its tenure as such), and at least speaking for myself, I have a strong aversion to acting on my own or encouraging p123 to act as a paternalistic overlord that tells you what you can or cannot do as opposed to giving you choices and hoping you will and giving you tools to support the making of good choices. But when I’m seeing conversation continuing to support use of TLT based on historical testing and correlations and failing to address the issues of a near-zero rate environment, I’m wondering if I need to talk to Marco about removing TLT from the hedging interface or banning it from R2G. Both choices would be very disturbing.
So PLEASE stop using TLT as a hedge vehicle or if you do so JUSTIFY it with reasoning that does NOT address historical experience (unless you go off site and support your views with research from an appropriate sample,m such as the 1970s) and that that speaks only to why you expect TLT to succeed going forward under the conditions we now face and are likely to face.
I don’t know the answer to this and I am interested in learning rather than trying to make a point.
My question(s) is (are): 1)what were people predicting about bonds in Japan 20 years ago? 2) how did bonds do in Japan over the last 20 years? 3) isn’t it Japan who invented QE (and are we doing the same thing)? 4) How do bonds do in a deflationary environment? 5) what are the chances of deflation? 6) Why is Ray Dalio predicting more QE from the Fed?
I think my questions may look like I’m making a point but there isn’t really much information in my questions and that is because I really don’t know much about Japan or deflation. Worse than the amount of my knowledge is my ability to predict. But I would know the answers to these questions and more before I bet either way on this one. Okay, as an average retail investor I know interest rates have to go up: which really makes me wonder. It is interesting!
In theory, deflation should favor bonds since it would reduce the discoubnt rate we’d have to use to value future cash flows. While the U.S. han’t had deflation lastely, we do know that dis-inflation (reductions in the rate of inflation) were powerfully bullish for bonds, as we should expect from the basic bond math.
The situation we have now, however, is different. Bonds aren’t like stocks. There is no ceiling to how far up a stock casn run. Bonds do have absolute ceilings based on the maturity terms and on the fact thast cost of capital can not go below zero. The latter condition is the one with which fixed income investors must now wrestle. The only way bods can continue to rise meaningfully is if we allow for negastive interest rates (i.e. if you own bonds, you receive no interest but pay a penalty, a liquidity tax).
Once when I was at Reuters, I remarked in print how rates can’t go below zero. I got an e-mail from a Federal Reserve researcher alerting me to and sharing with me an internal paper exploring just that – a liquidity tax that was designed to create negative interest rates. Not surprisingly, though, he shared with me that the Board had no plans of trying to go there, knowing full well it would be politically suicidal.
So now, regardless of what’s ahead re: inflation/deflation, pretty much the only argument you can make for TLT is to express your belief that this negative interest rate-liquidity tax idea will be implemented, and that there will be no political lynchings or assassinations that cause it to be immediately revoked.
So in the face of continuing disinflation, why can’t the current yield curve flatten with the 20 year yield dropping? The US treasury yield curve was very flat in 2006 albeit at around 4.65%.