Hierarchical ML Factor Ranking

I’ve been thinking about a concept for a Linear ML ranking architecture, and I’m sure many of that many of you have experimented with similar ideas in different forms. I’d love to get your feedback on my concept idea.

In my experience, standard Linear ML ranking systems often underperform expectations. My traditional, manually-crafted ranking systems usually perform just as well—if not better—while offering significantly more control. I believe the weakness of current ML tools lies in two areas:

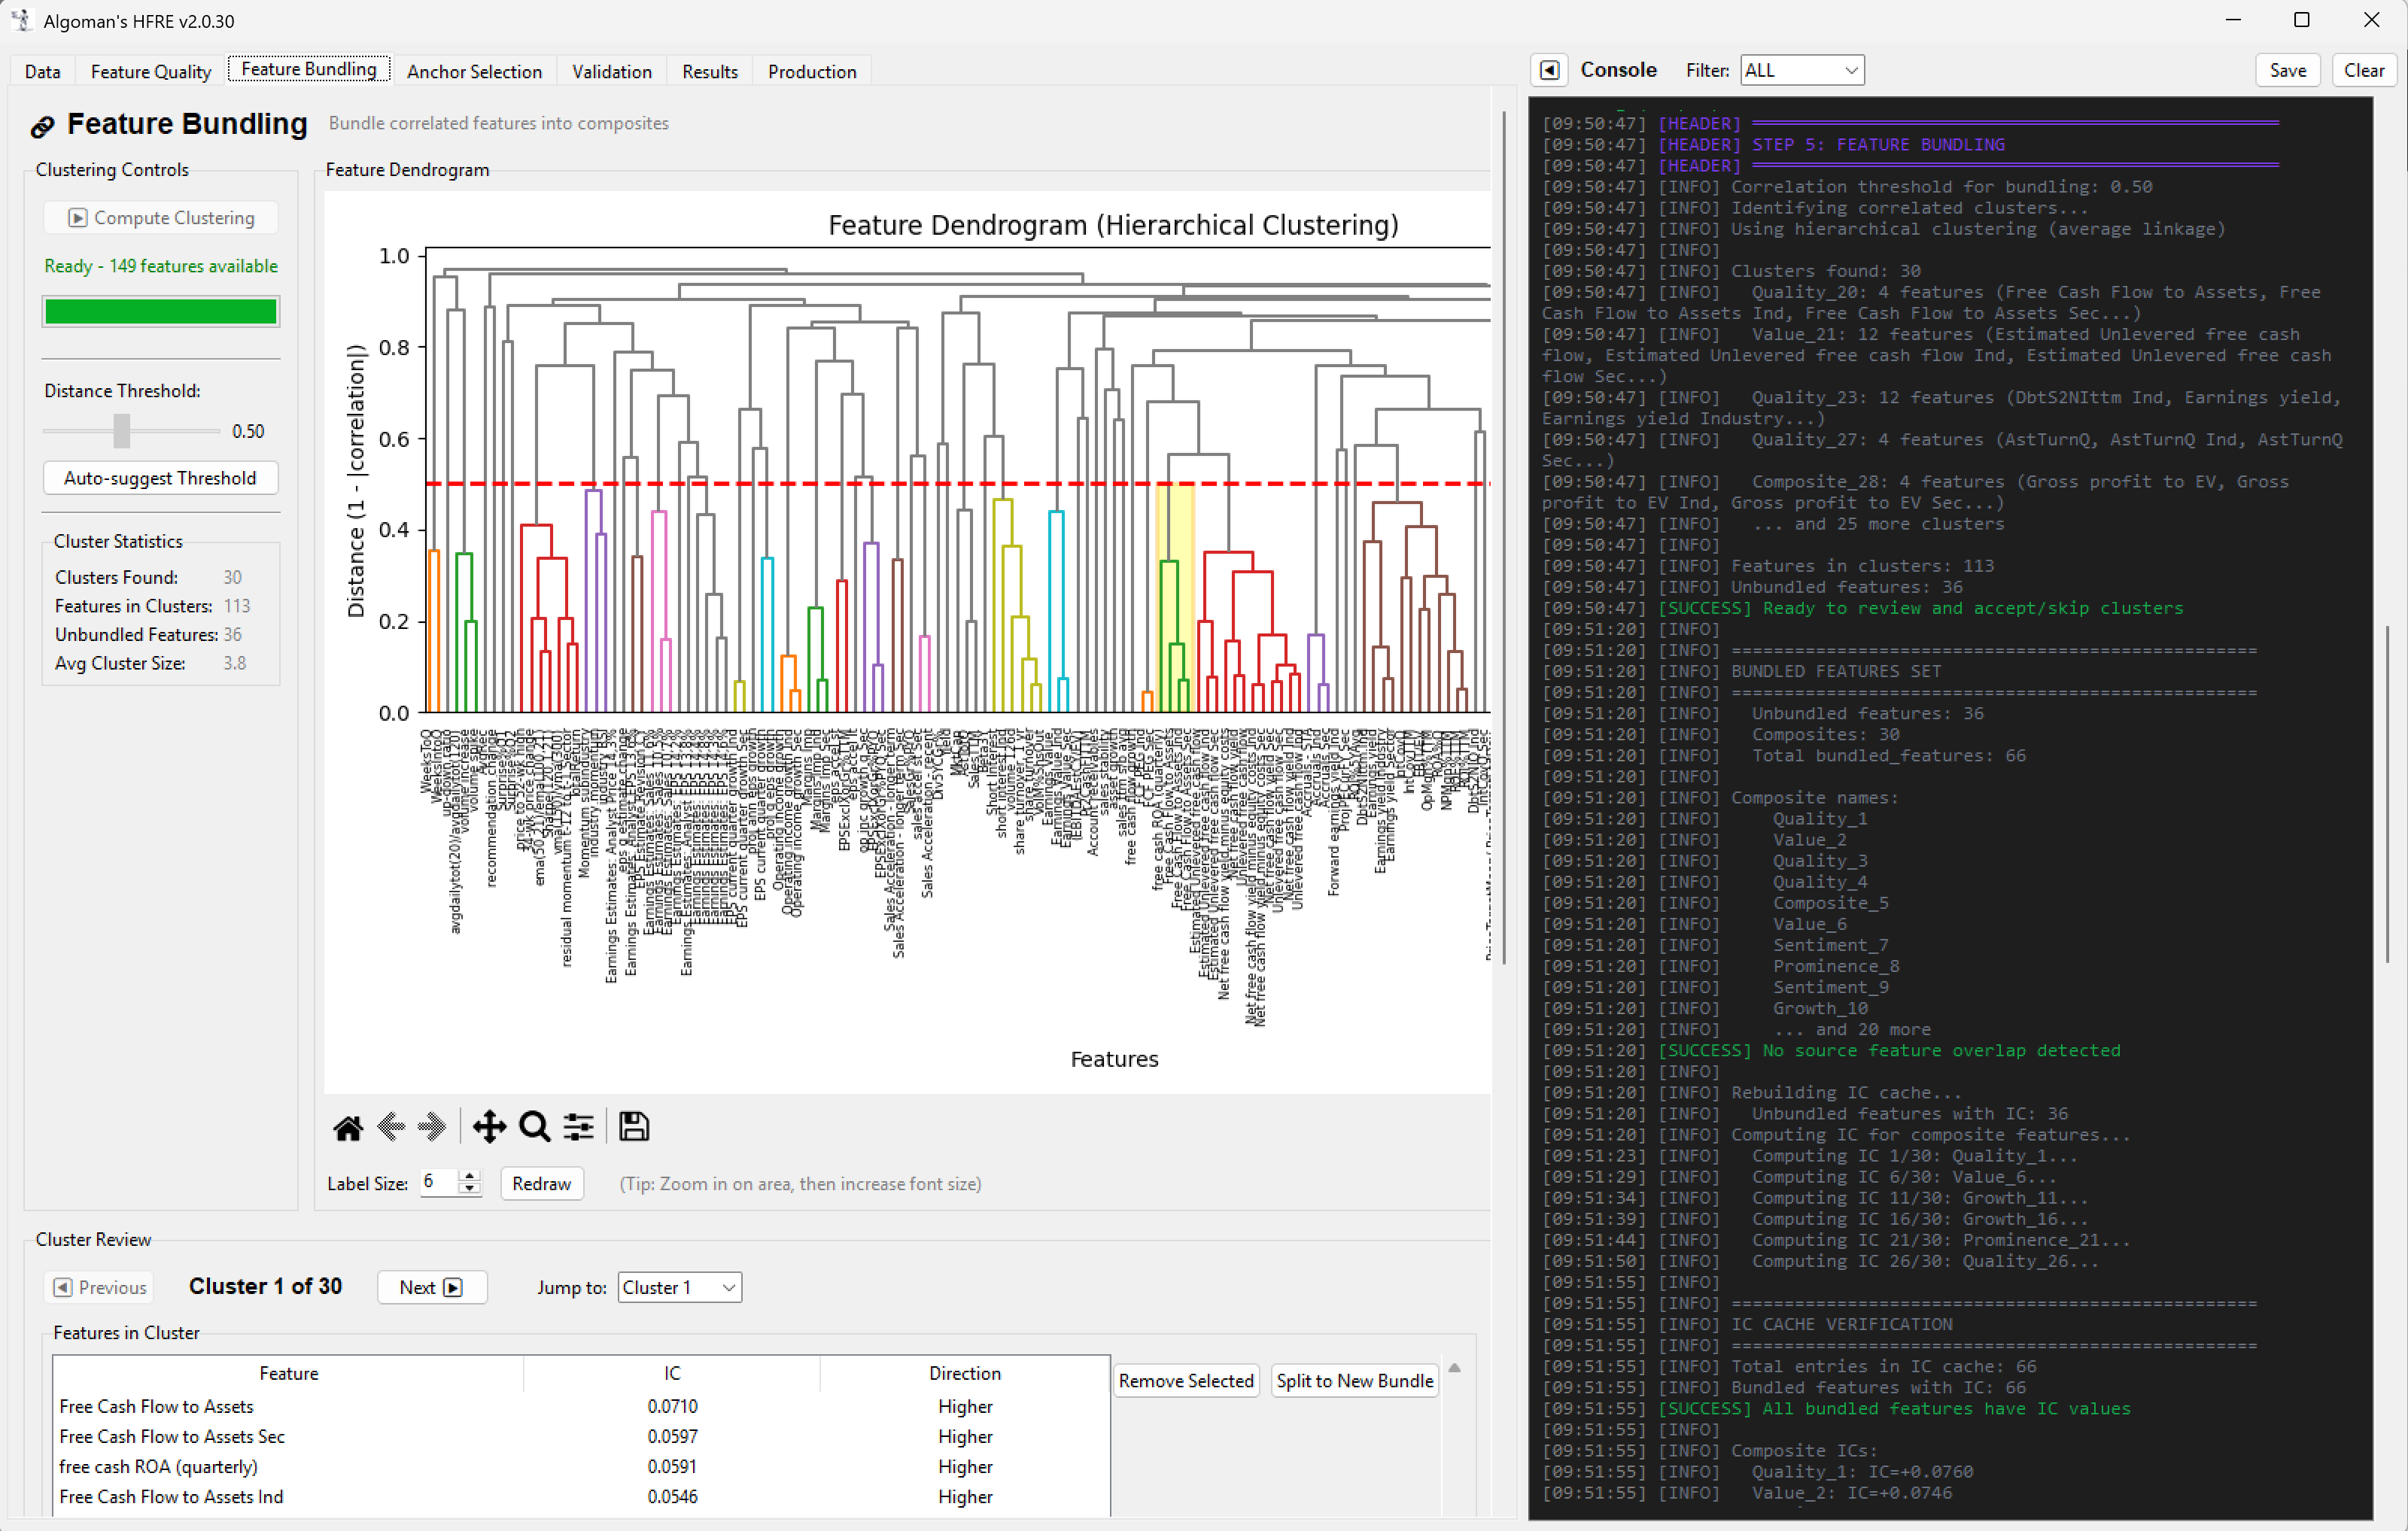
  1. Lack of Structure: We lose the ability to build "blocks" using Composite Nodes, which are for many the backbone of a robust traditional system.

  2. Factor Over-Concentration: Without constraints, an AI model often develops an extreme tilt toward a single factor, leading to high volatility or regime-dependency.

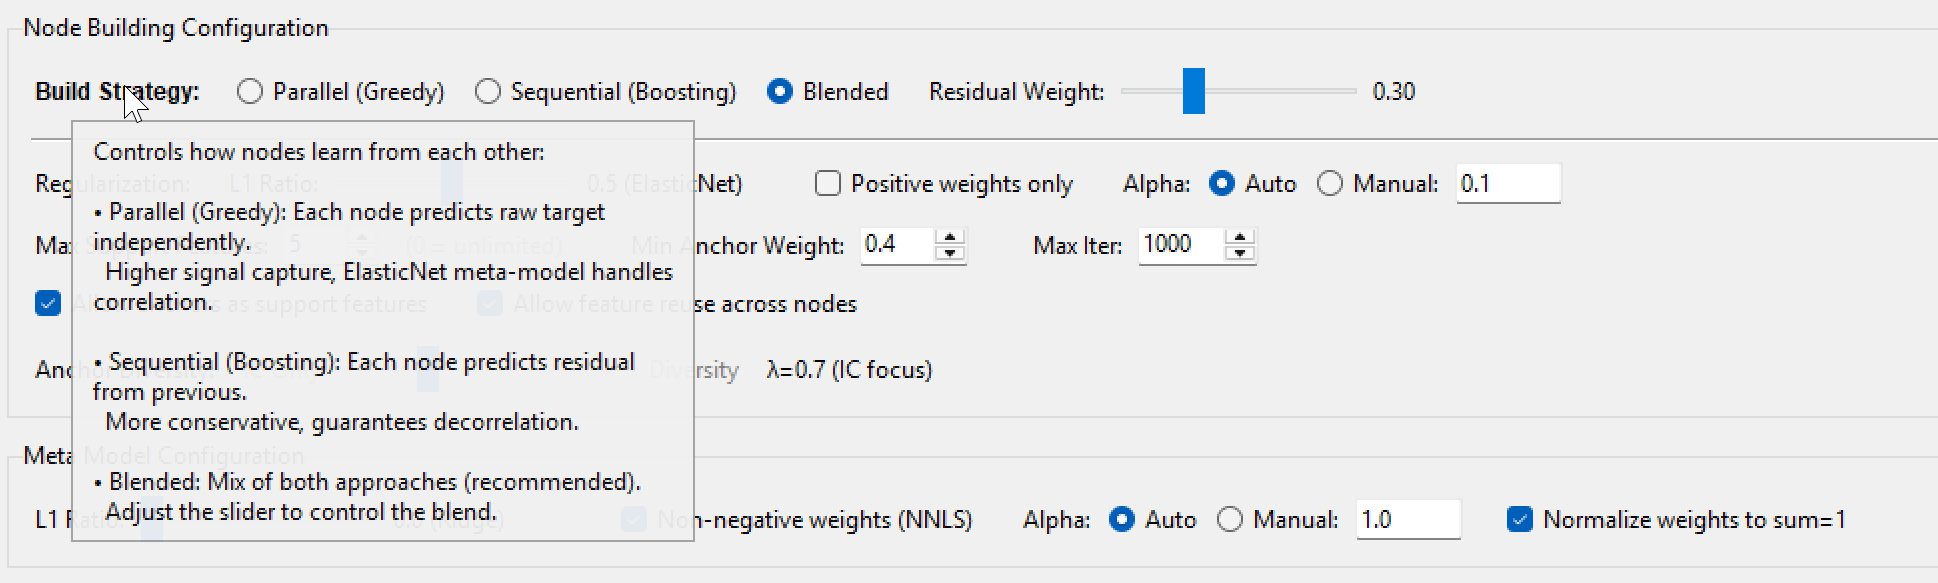
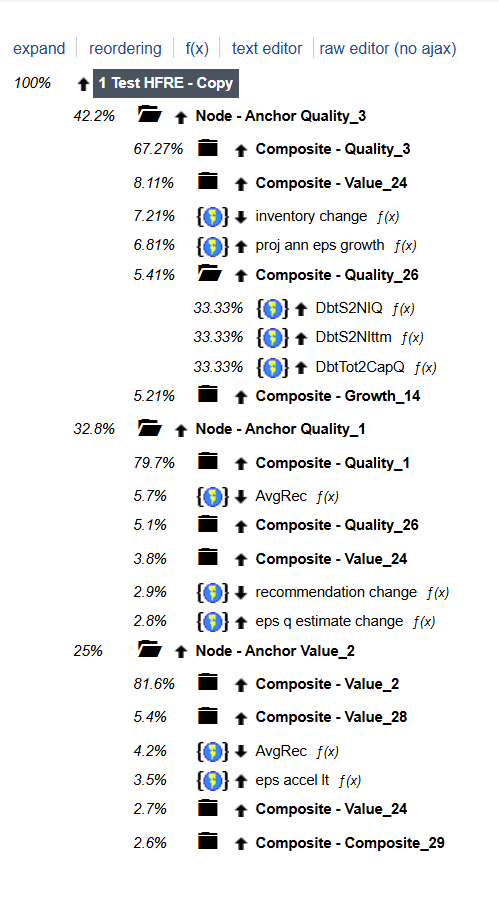
My plan is to build a two-step Linear ML system that bridges the gap between machine learning and traditional "expert-system" design. Instead of one giant model, I am building a hierarchy of "Micro-Strategy Nodes."

The simplified workflow will be something like the following:

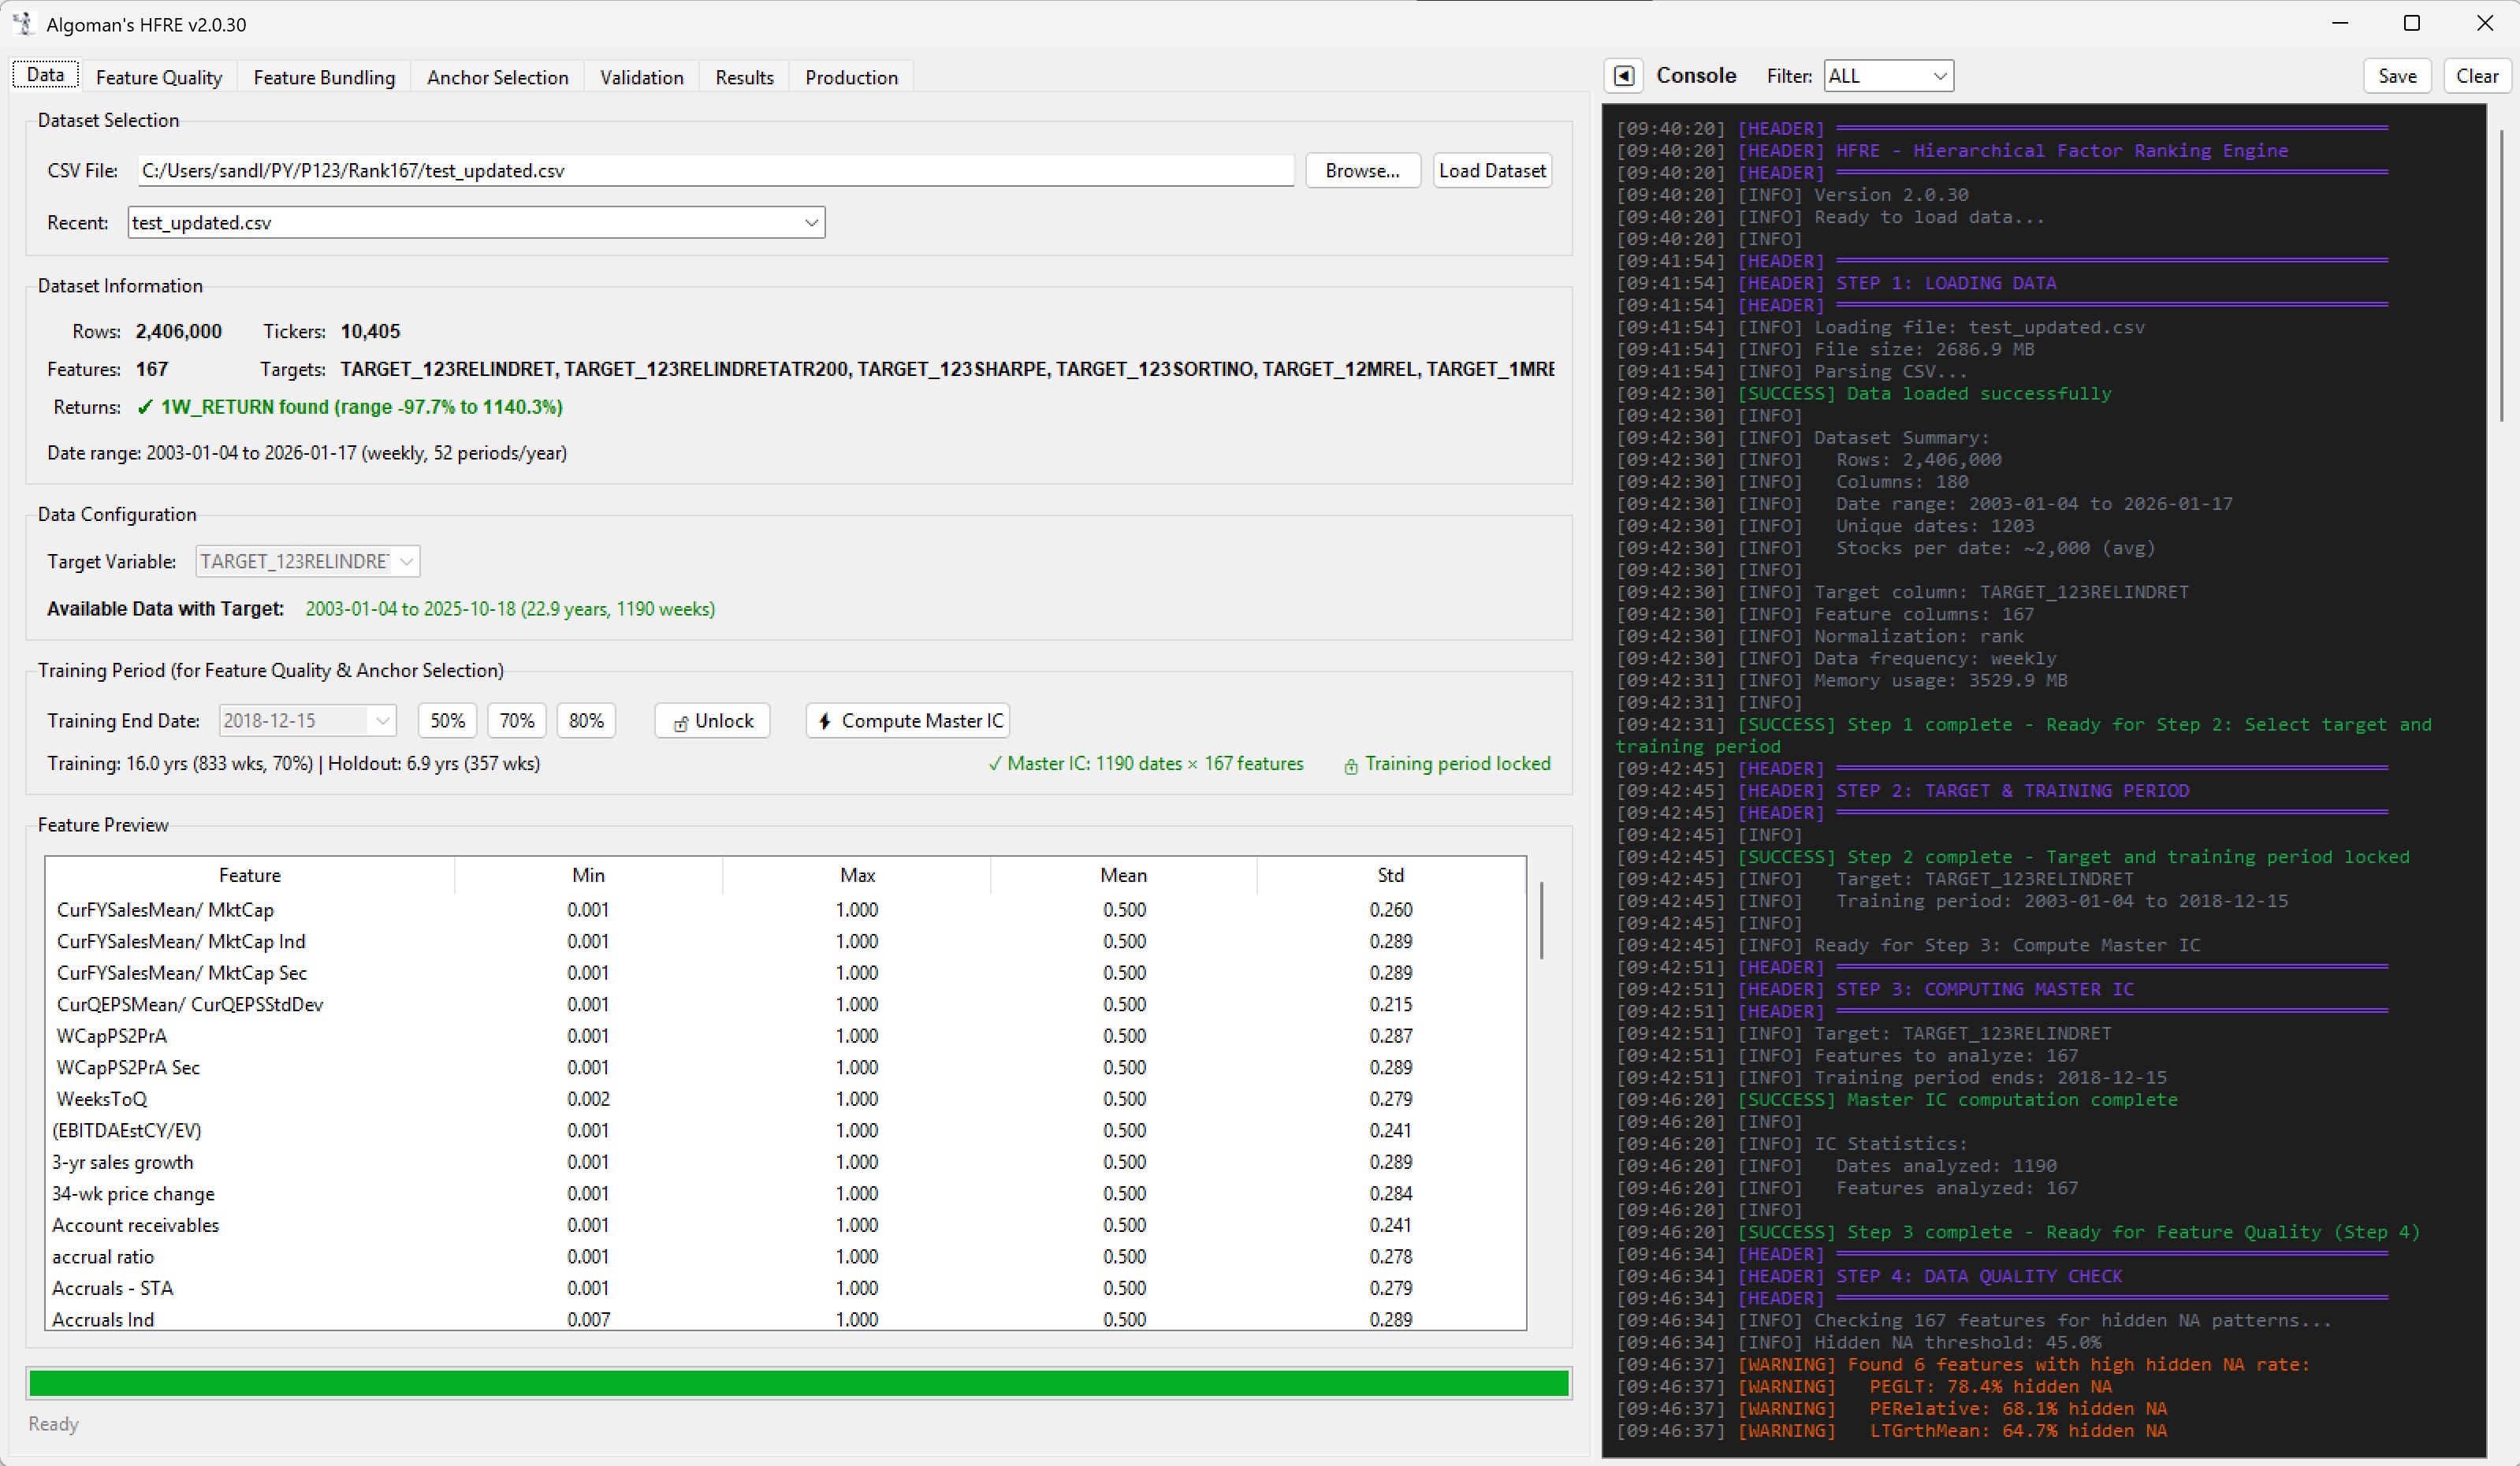
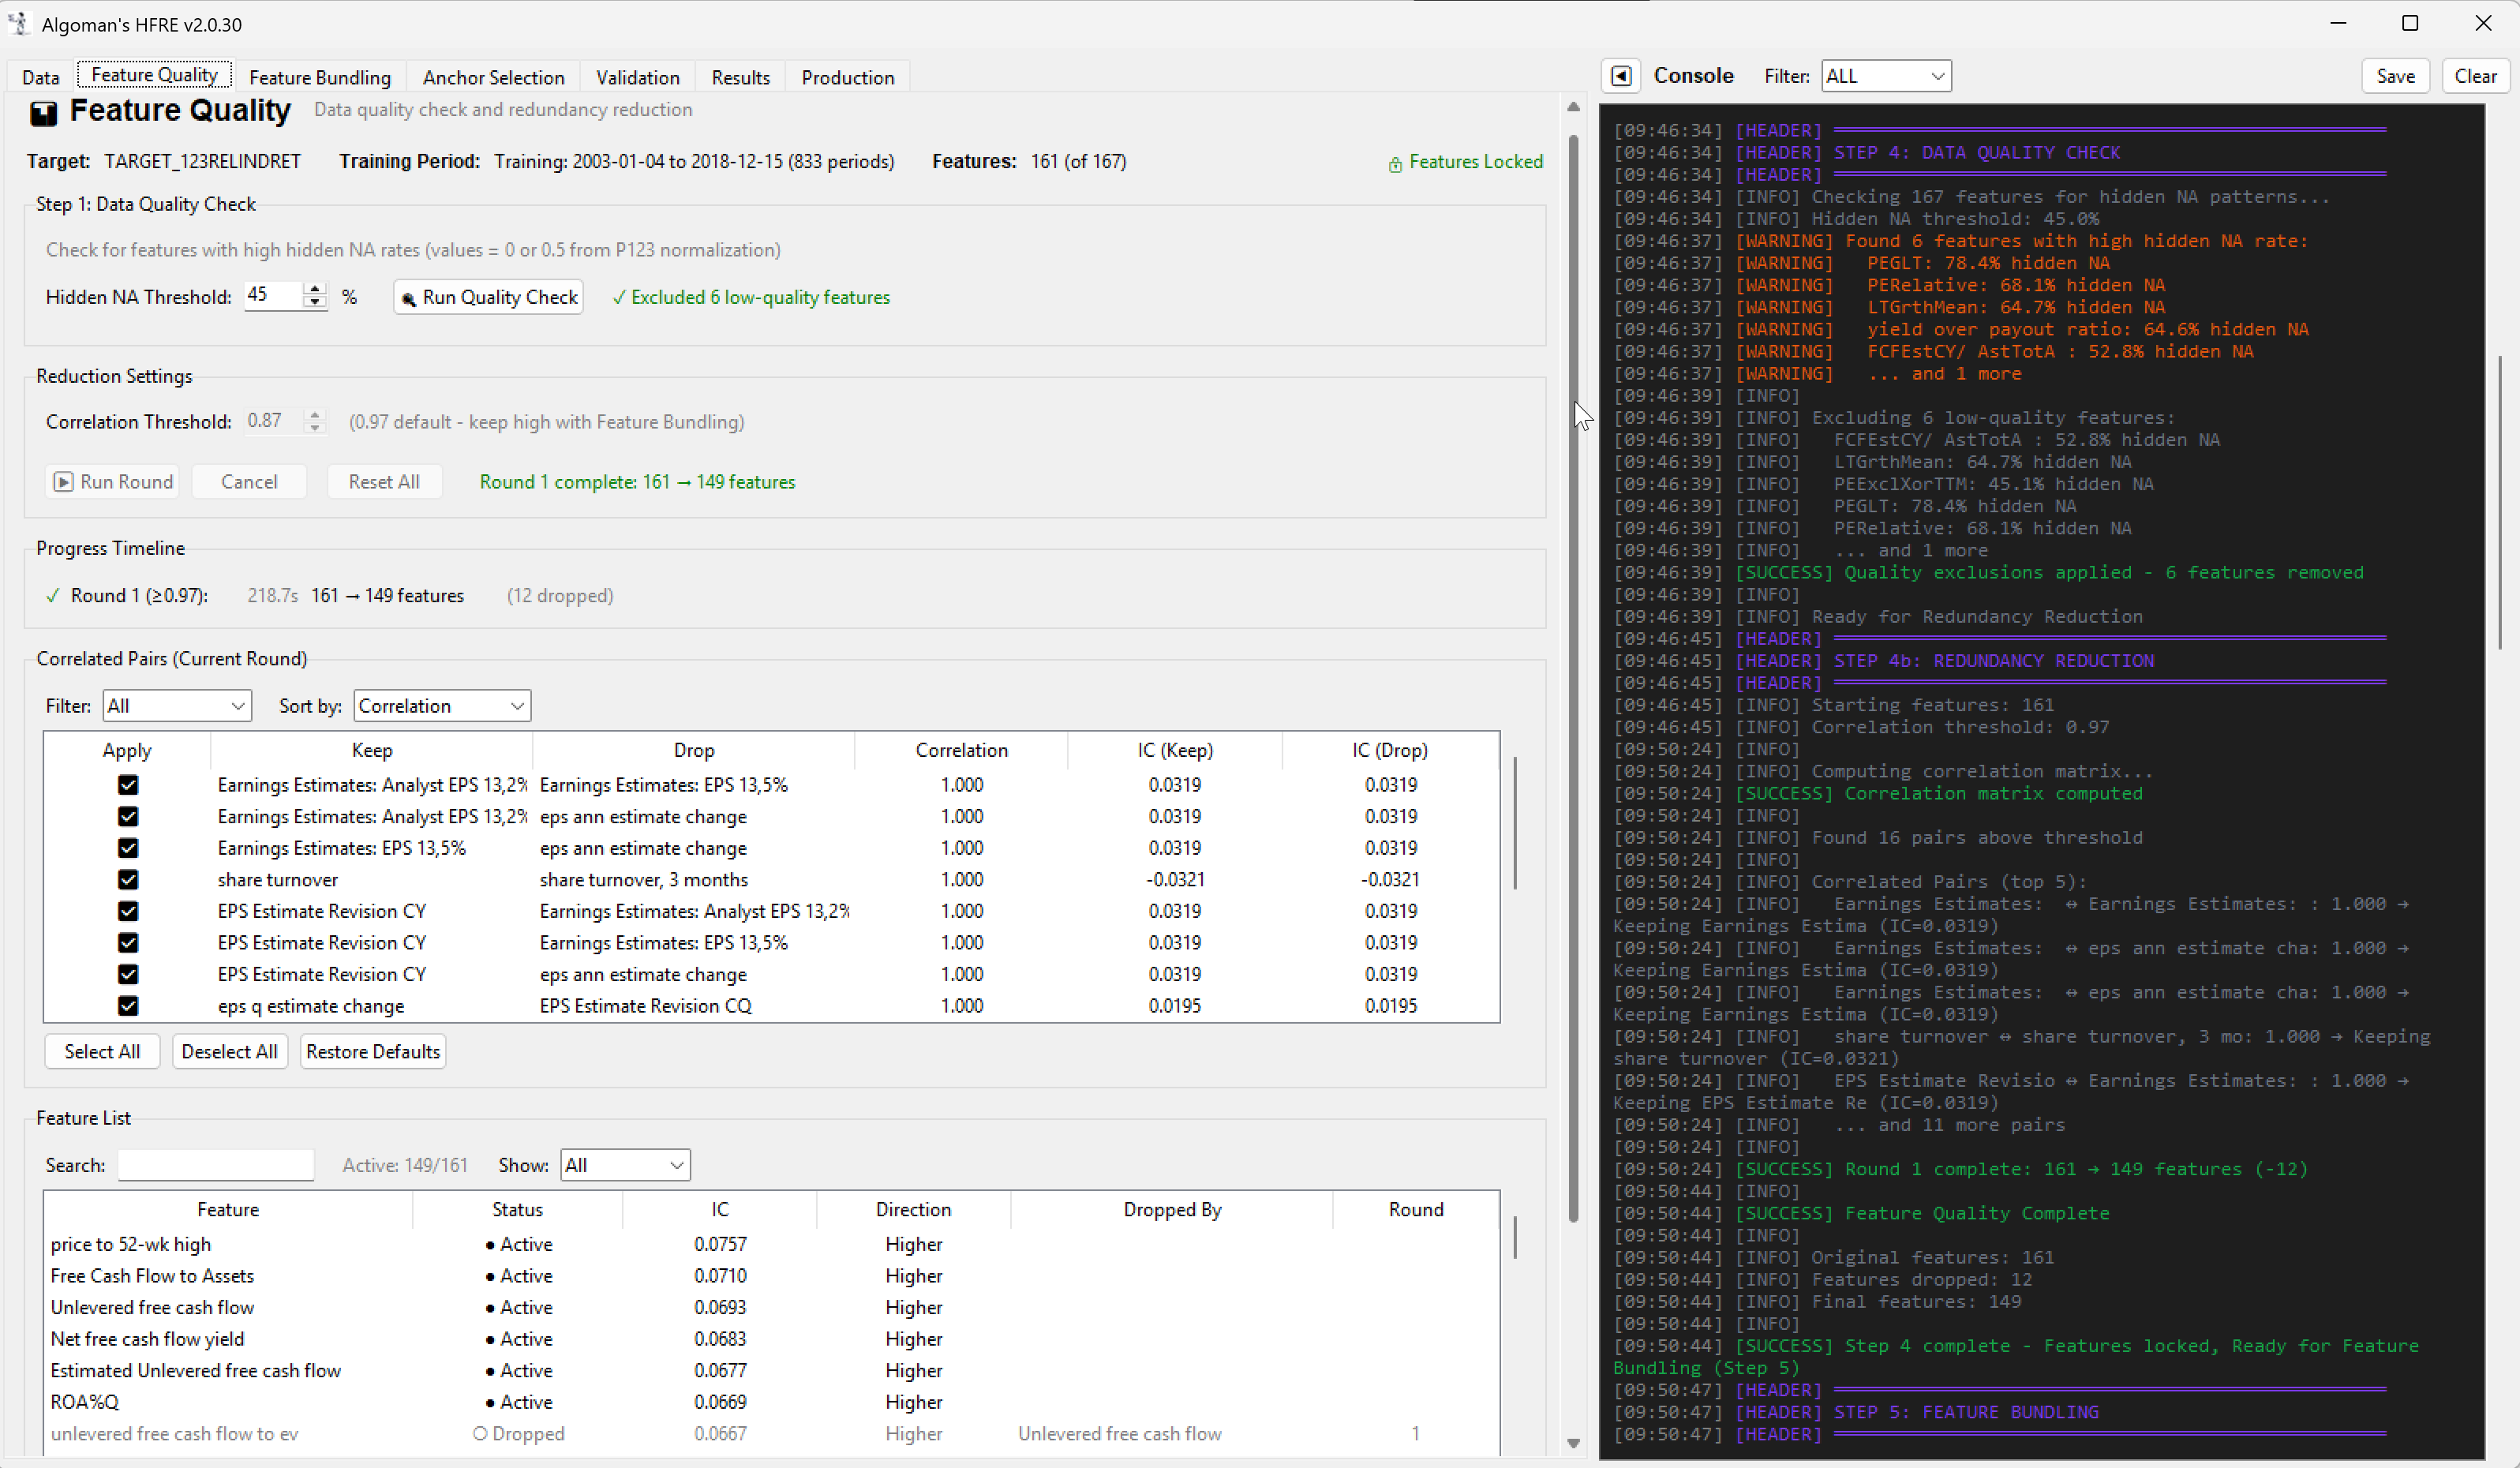
  1. Download pre-ranked factors and target data from Portfolio123.

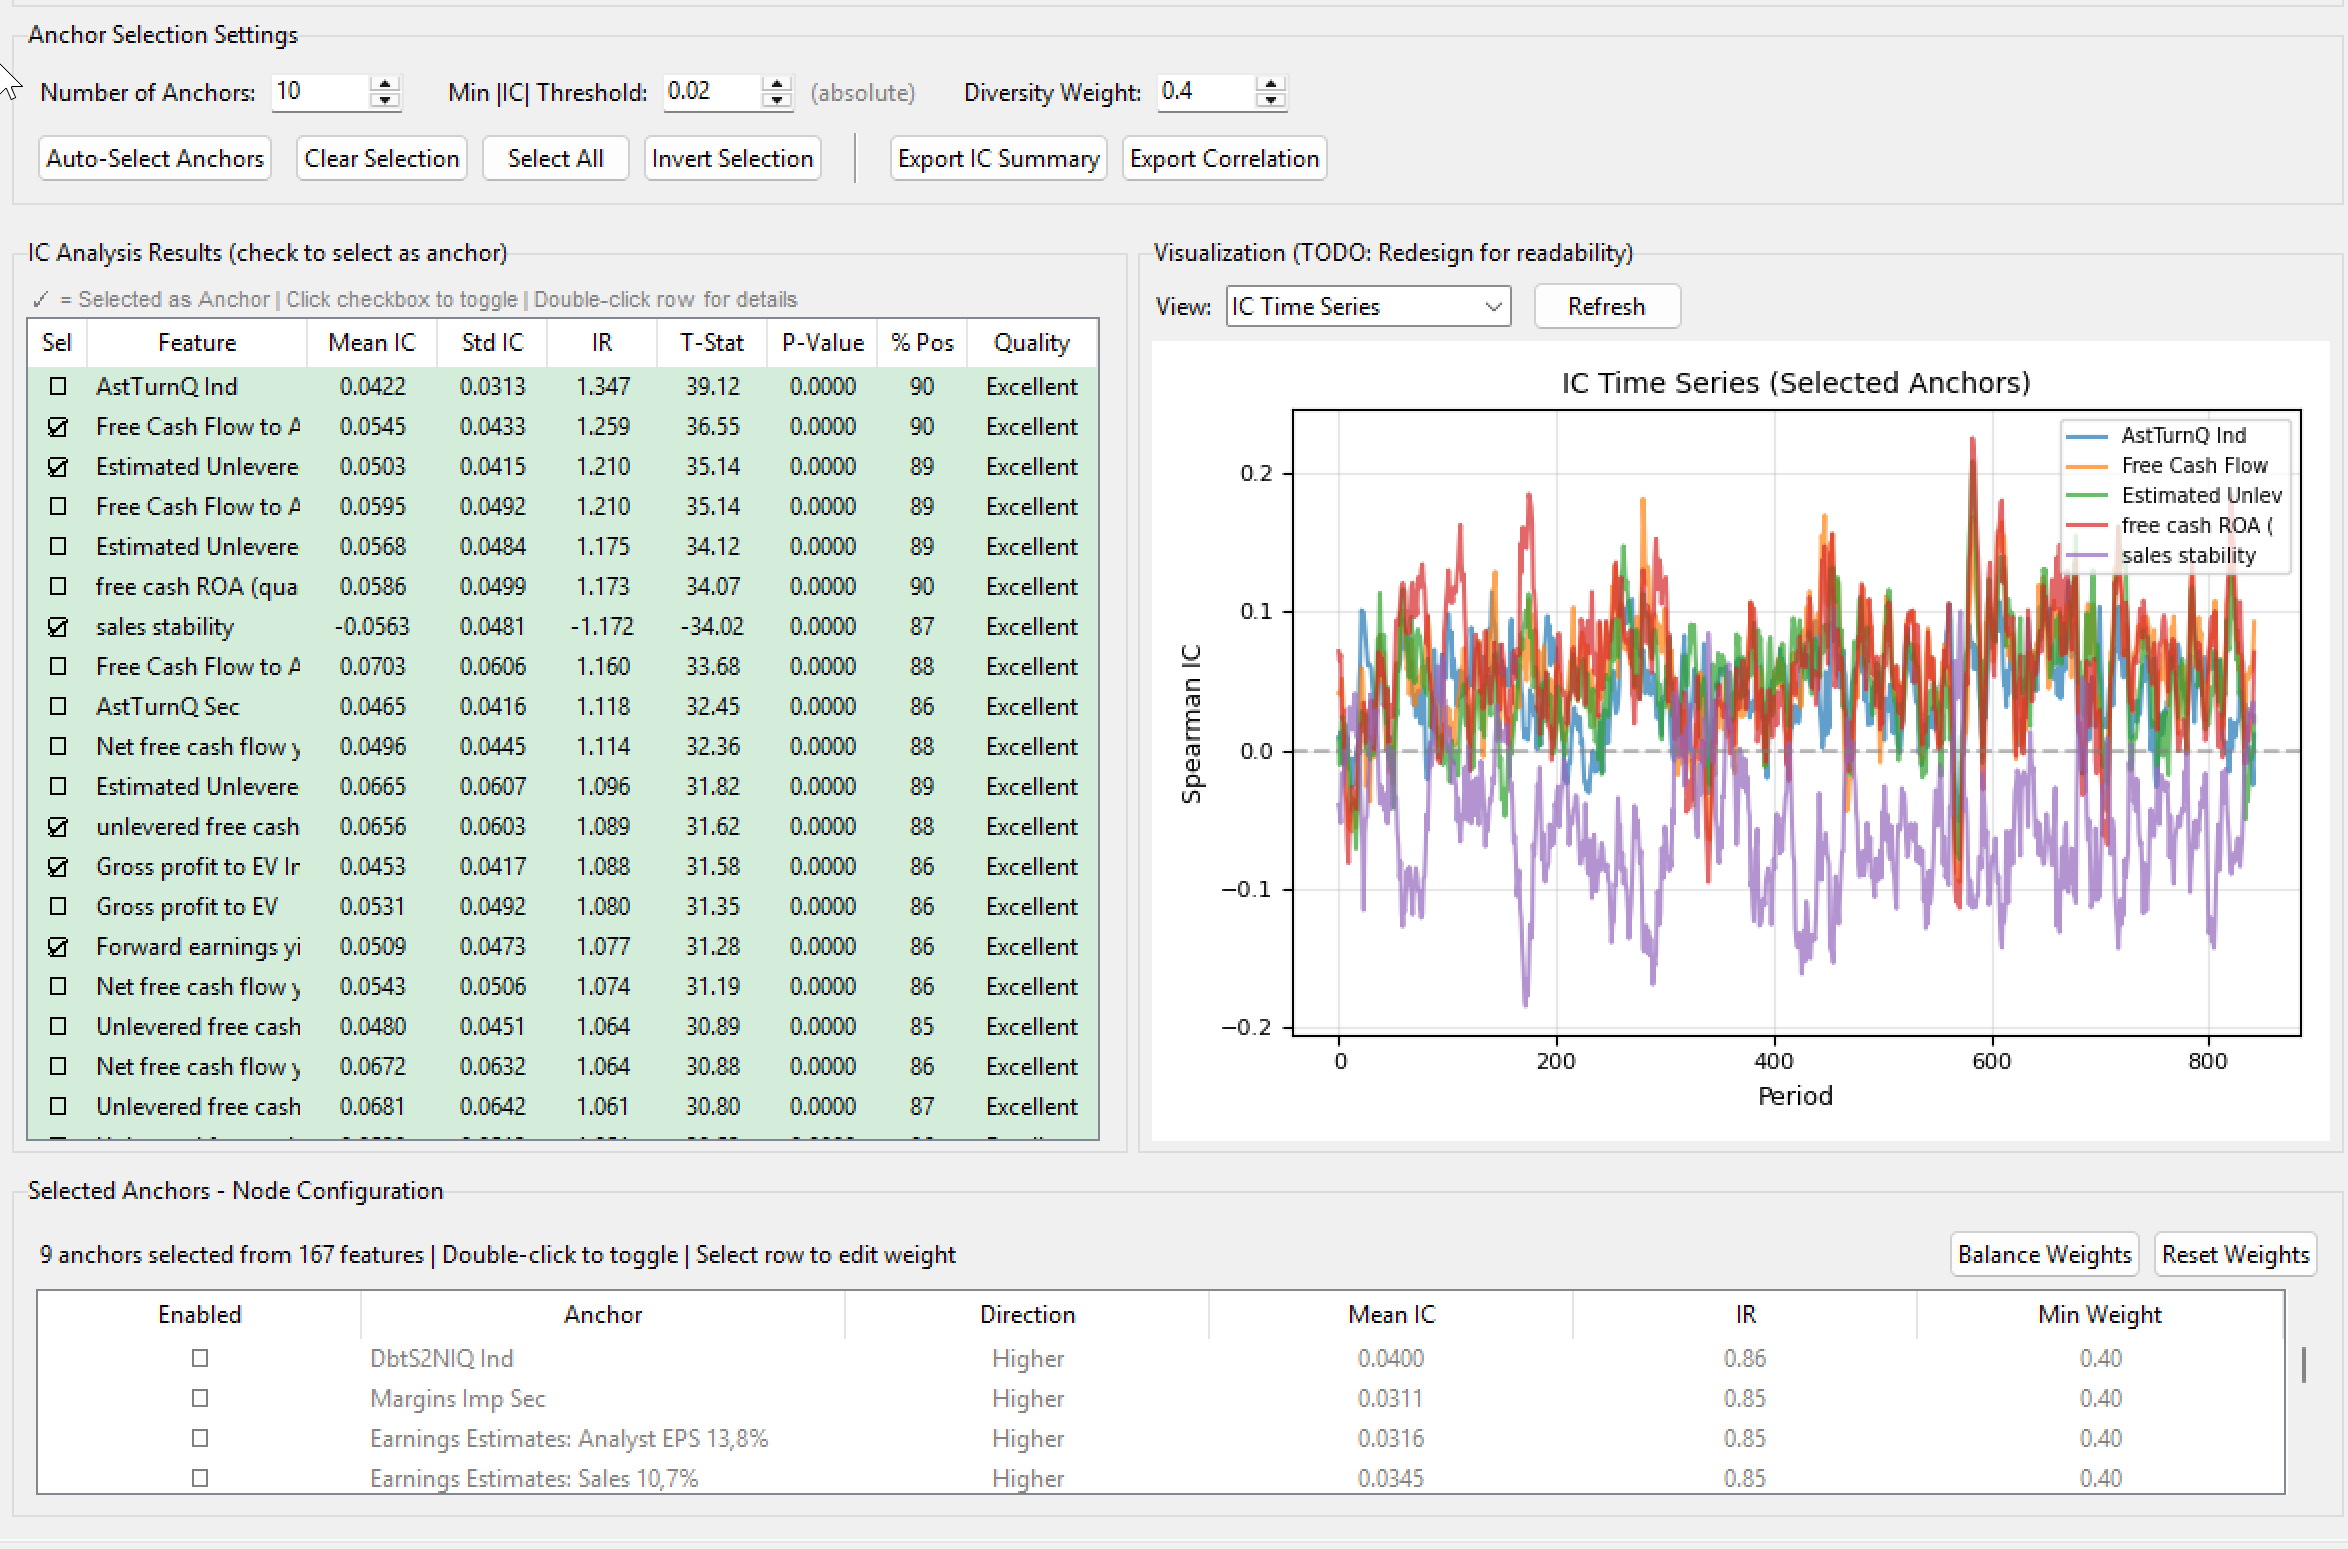
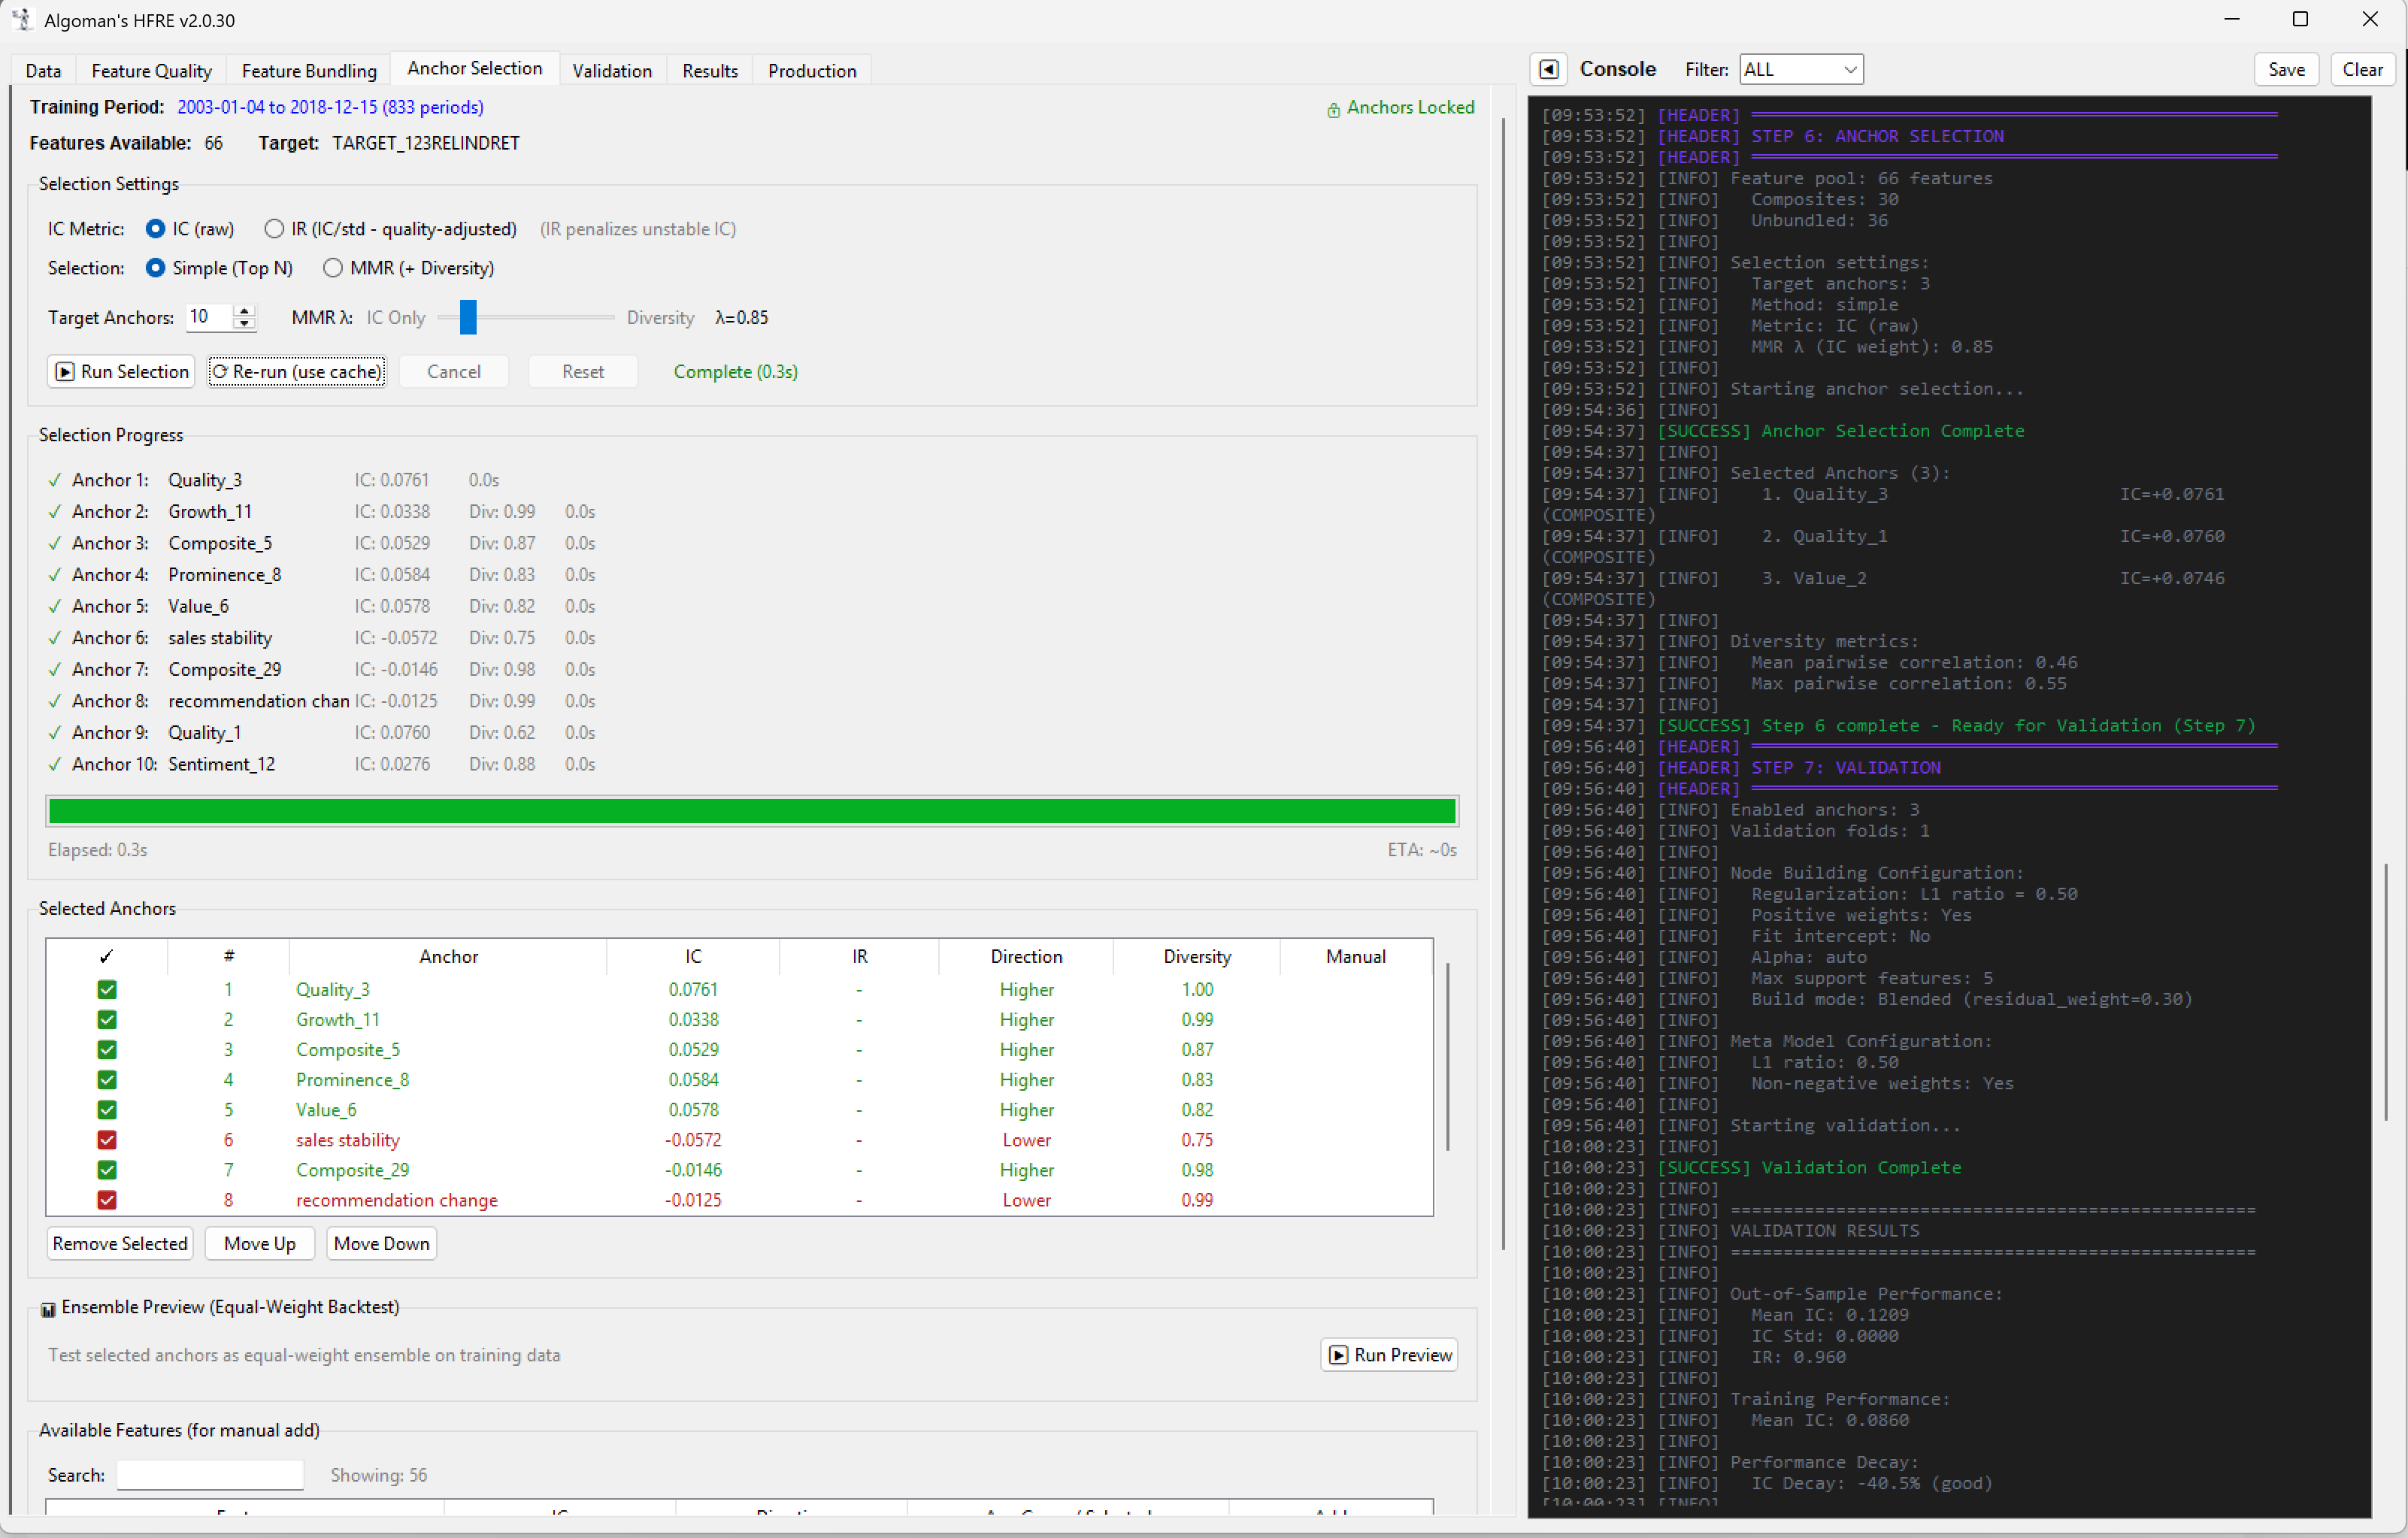
  2. Define a set of "Node Anchors." These are your core "Generals"—the statistically strong factors like specific Momentum, Value, or Growth metrics.

  3. Run a small, constrained Linear ML model for each node. The "Anchor" is prioritized with a pre-set weight, while the model selects a limited number of supporting factors to maximize the node's return (or whatever your target is set to).

    • Example: A "Sales Growth" anchor node might be paired with "P/S Ratio" and "Operating Margin" to ensure the growth is both high-quality and reasonably priced.
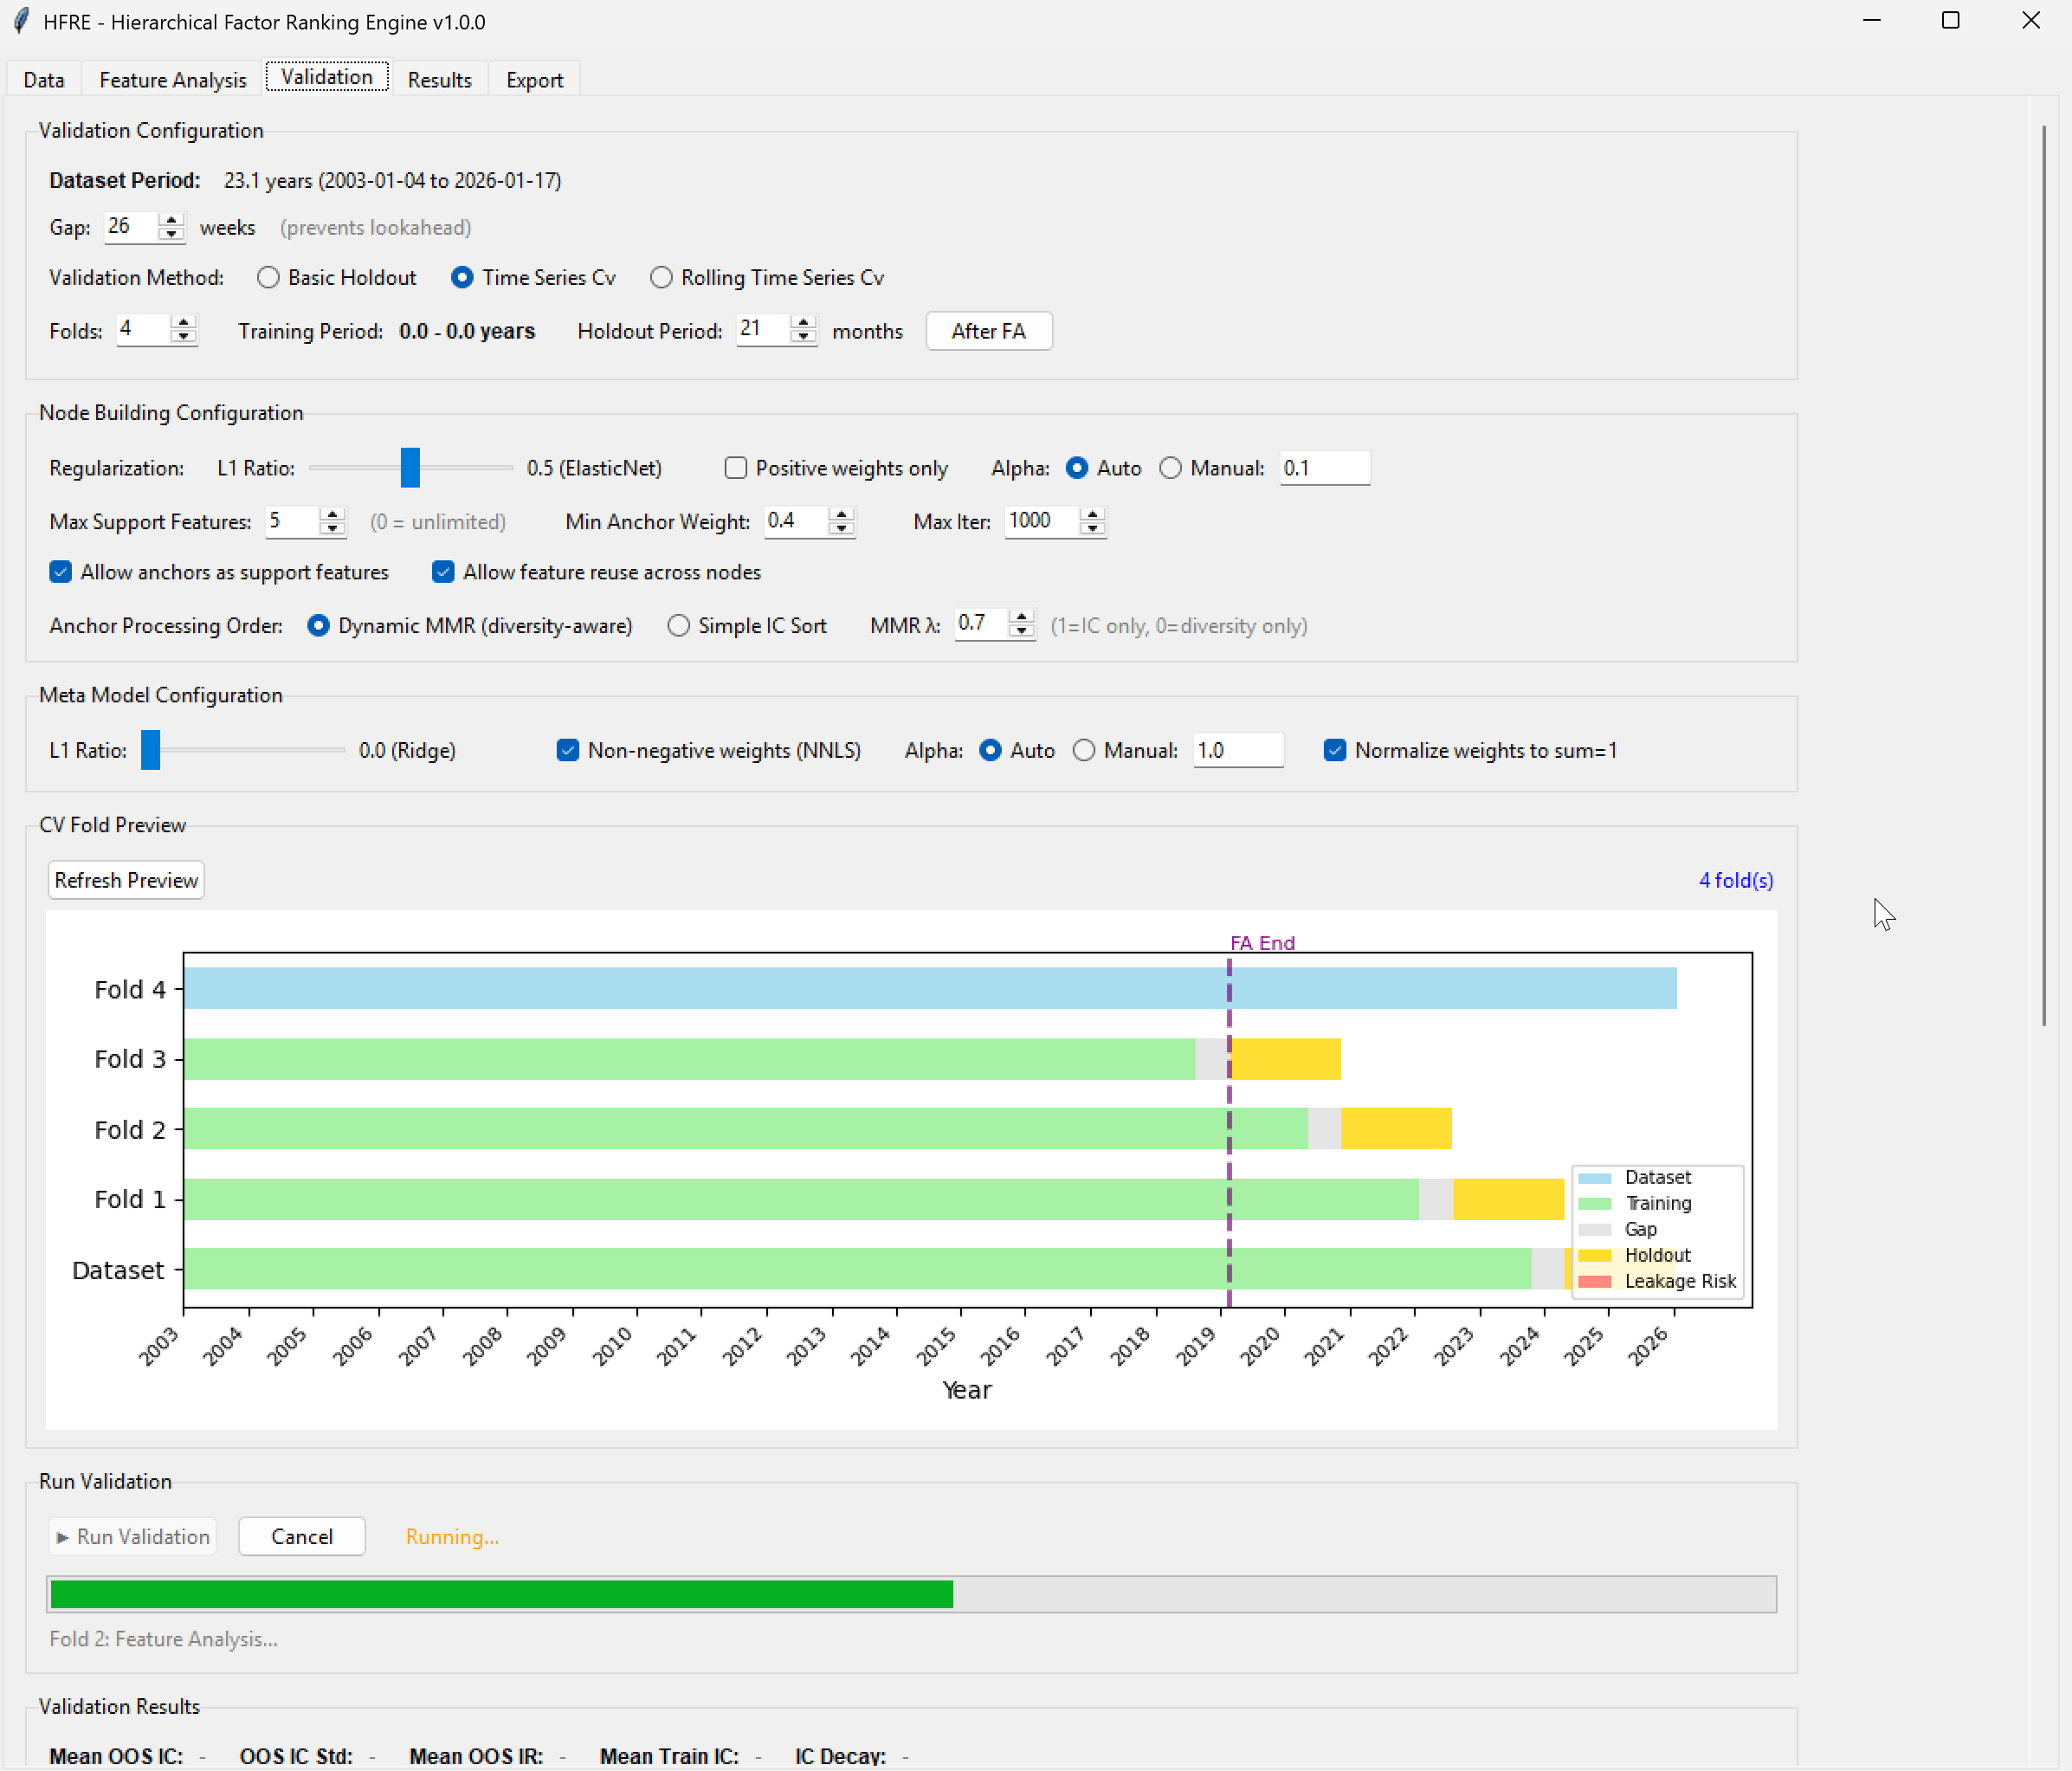
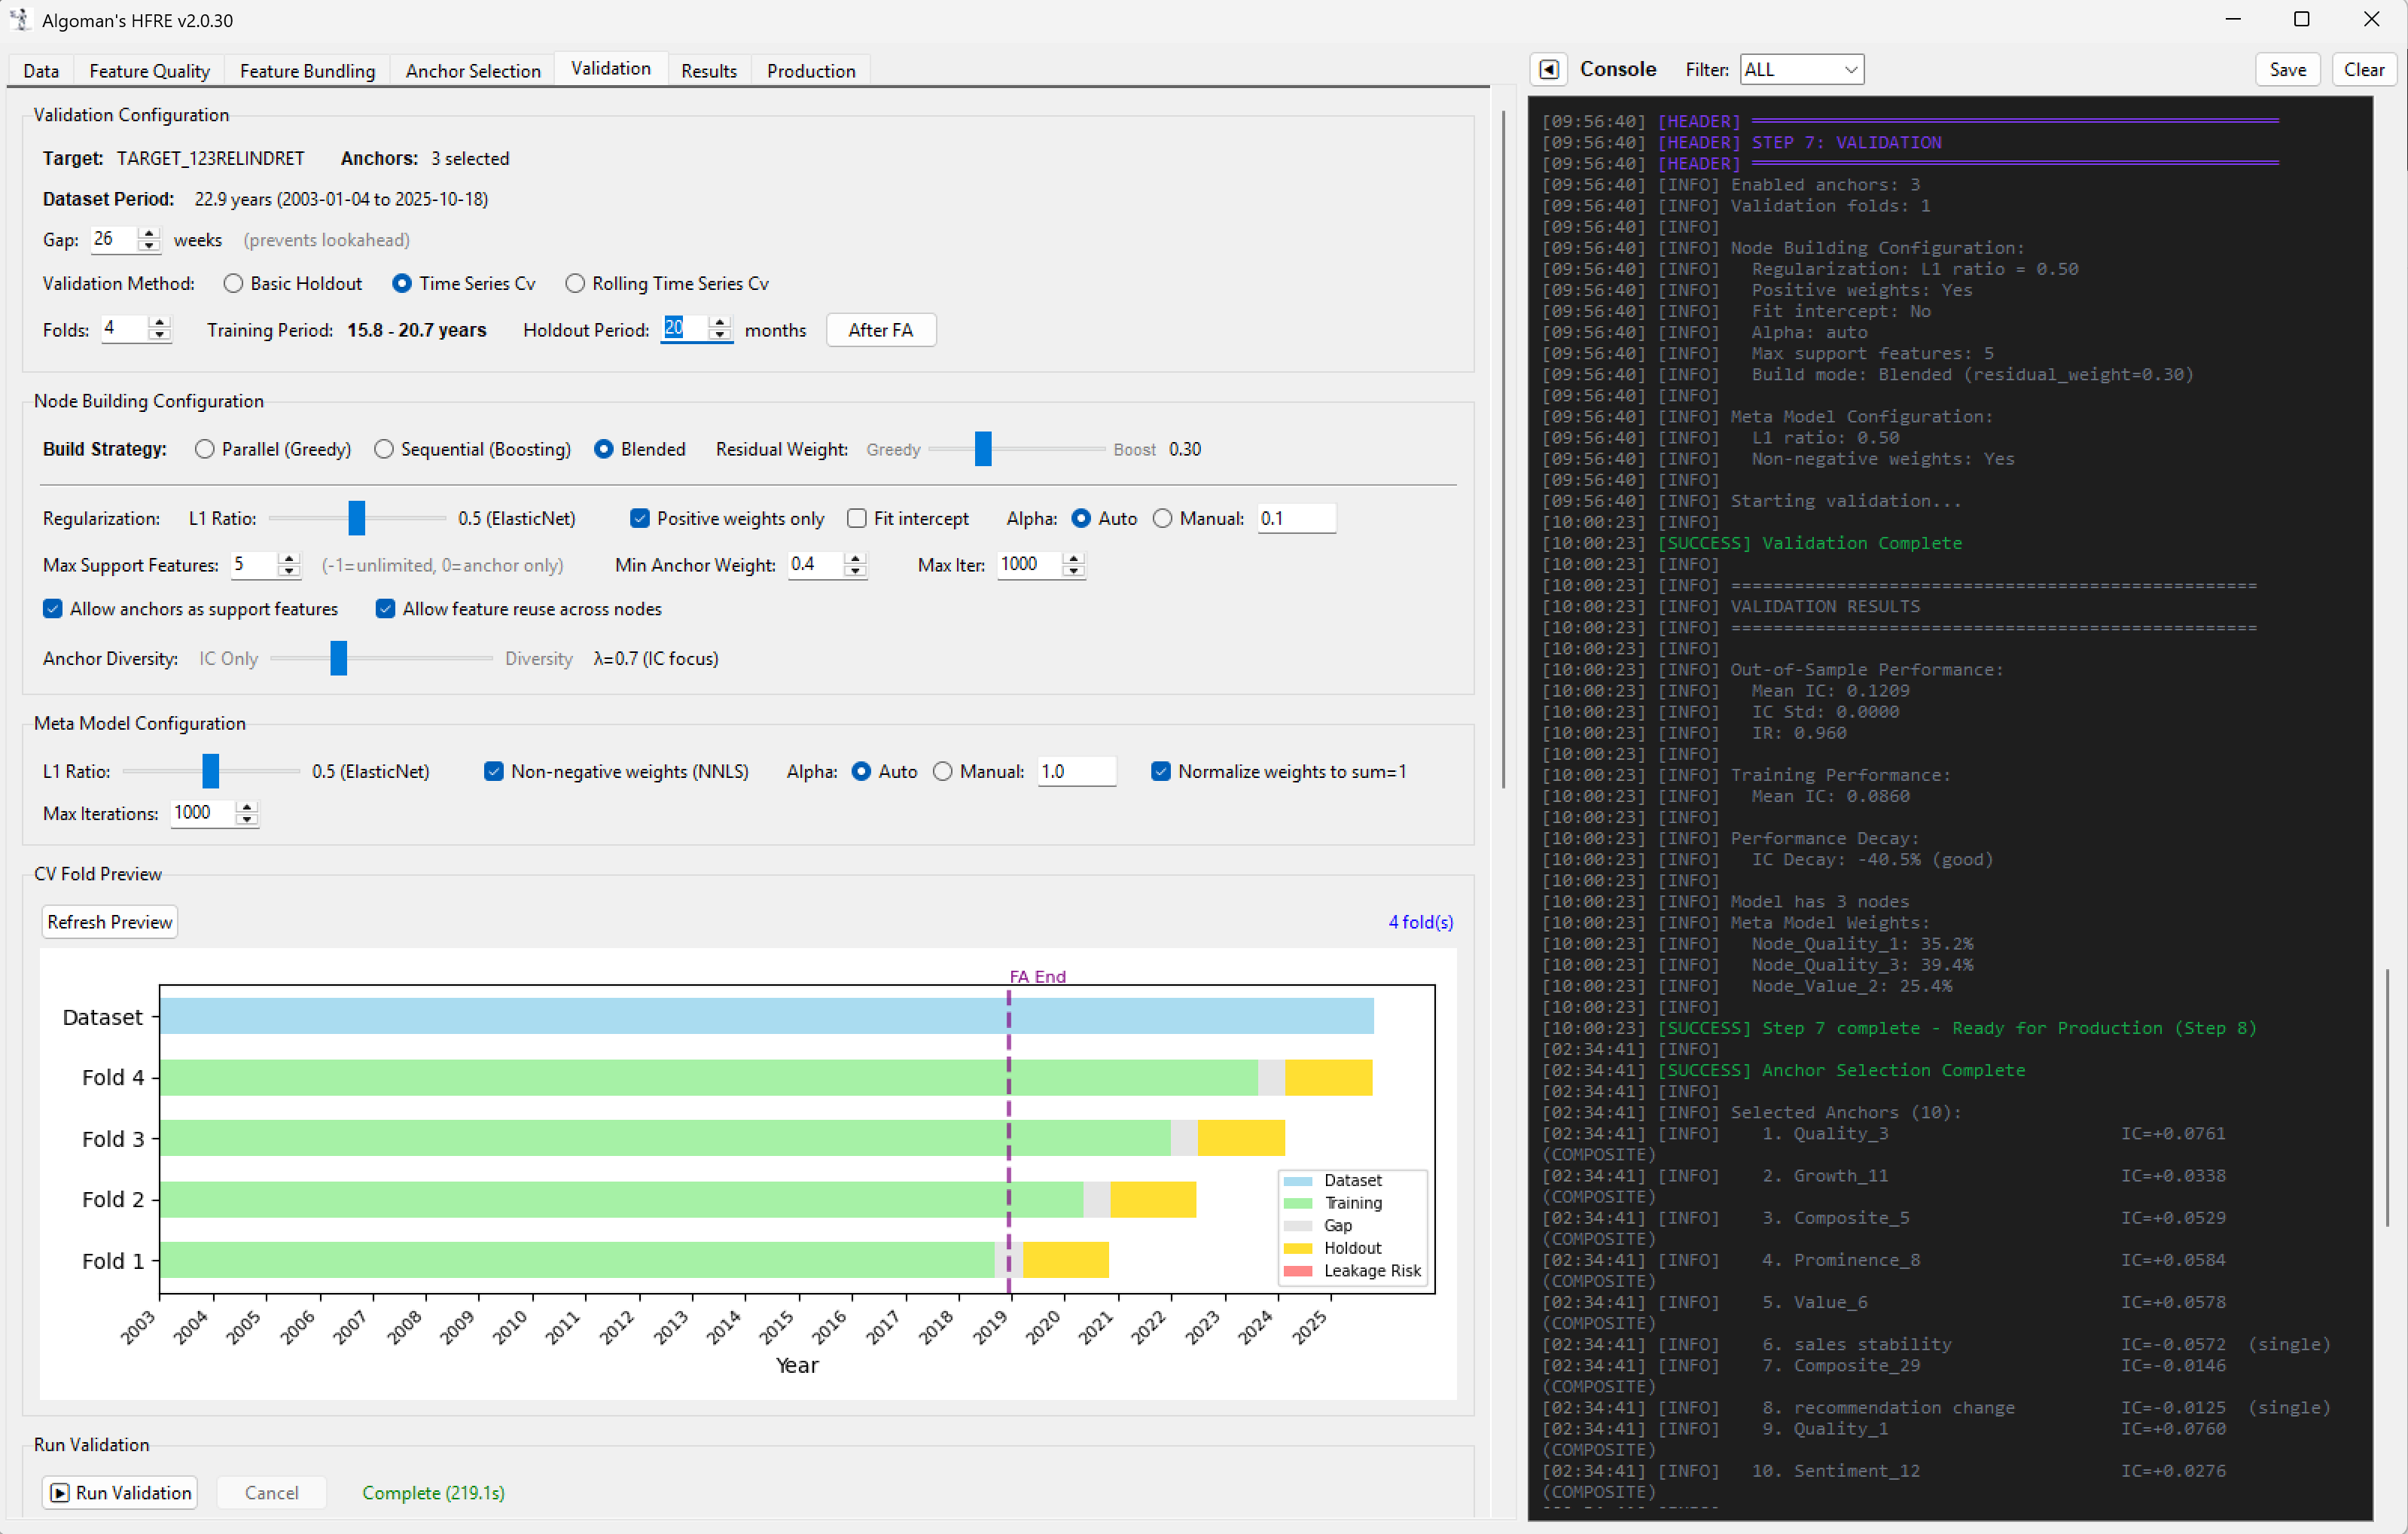
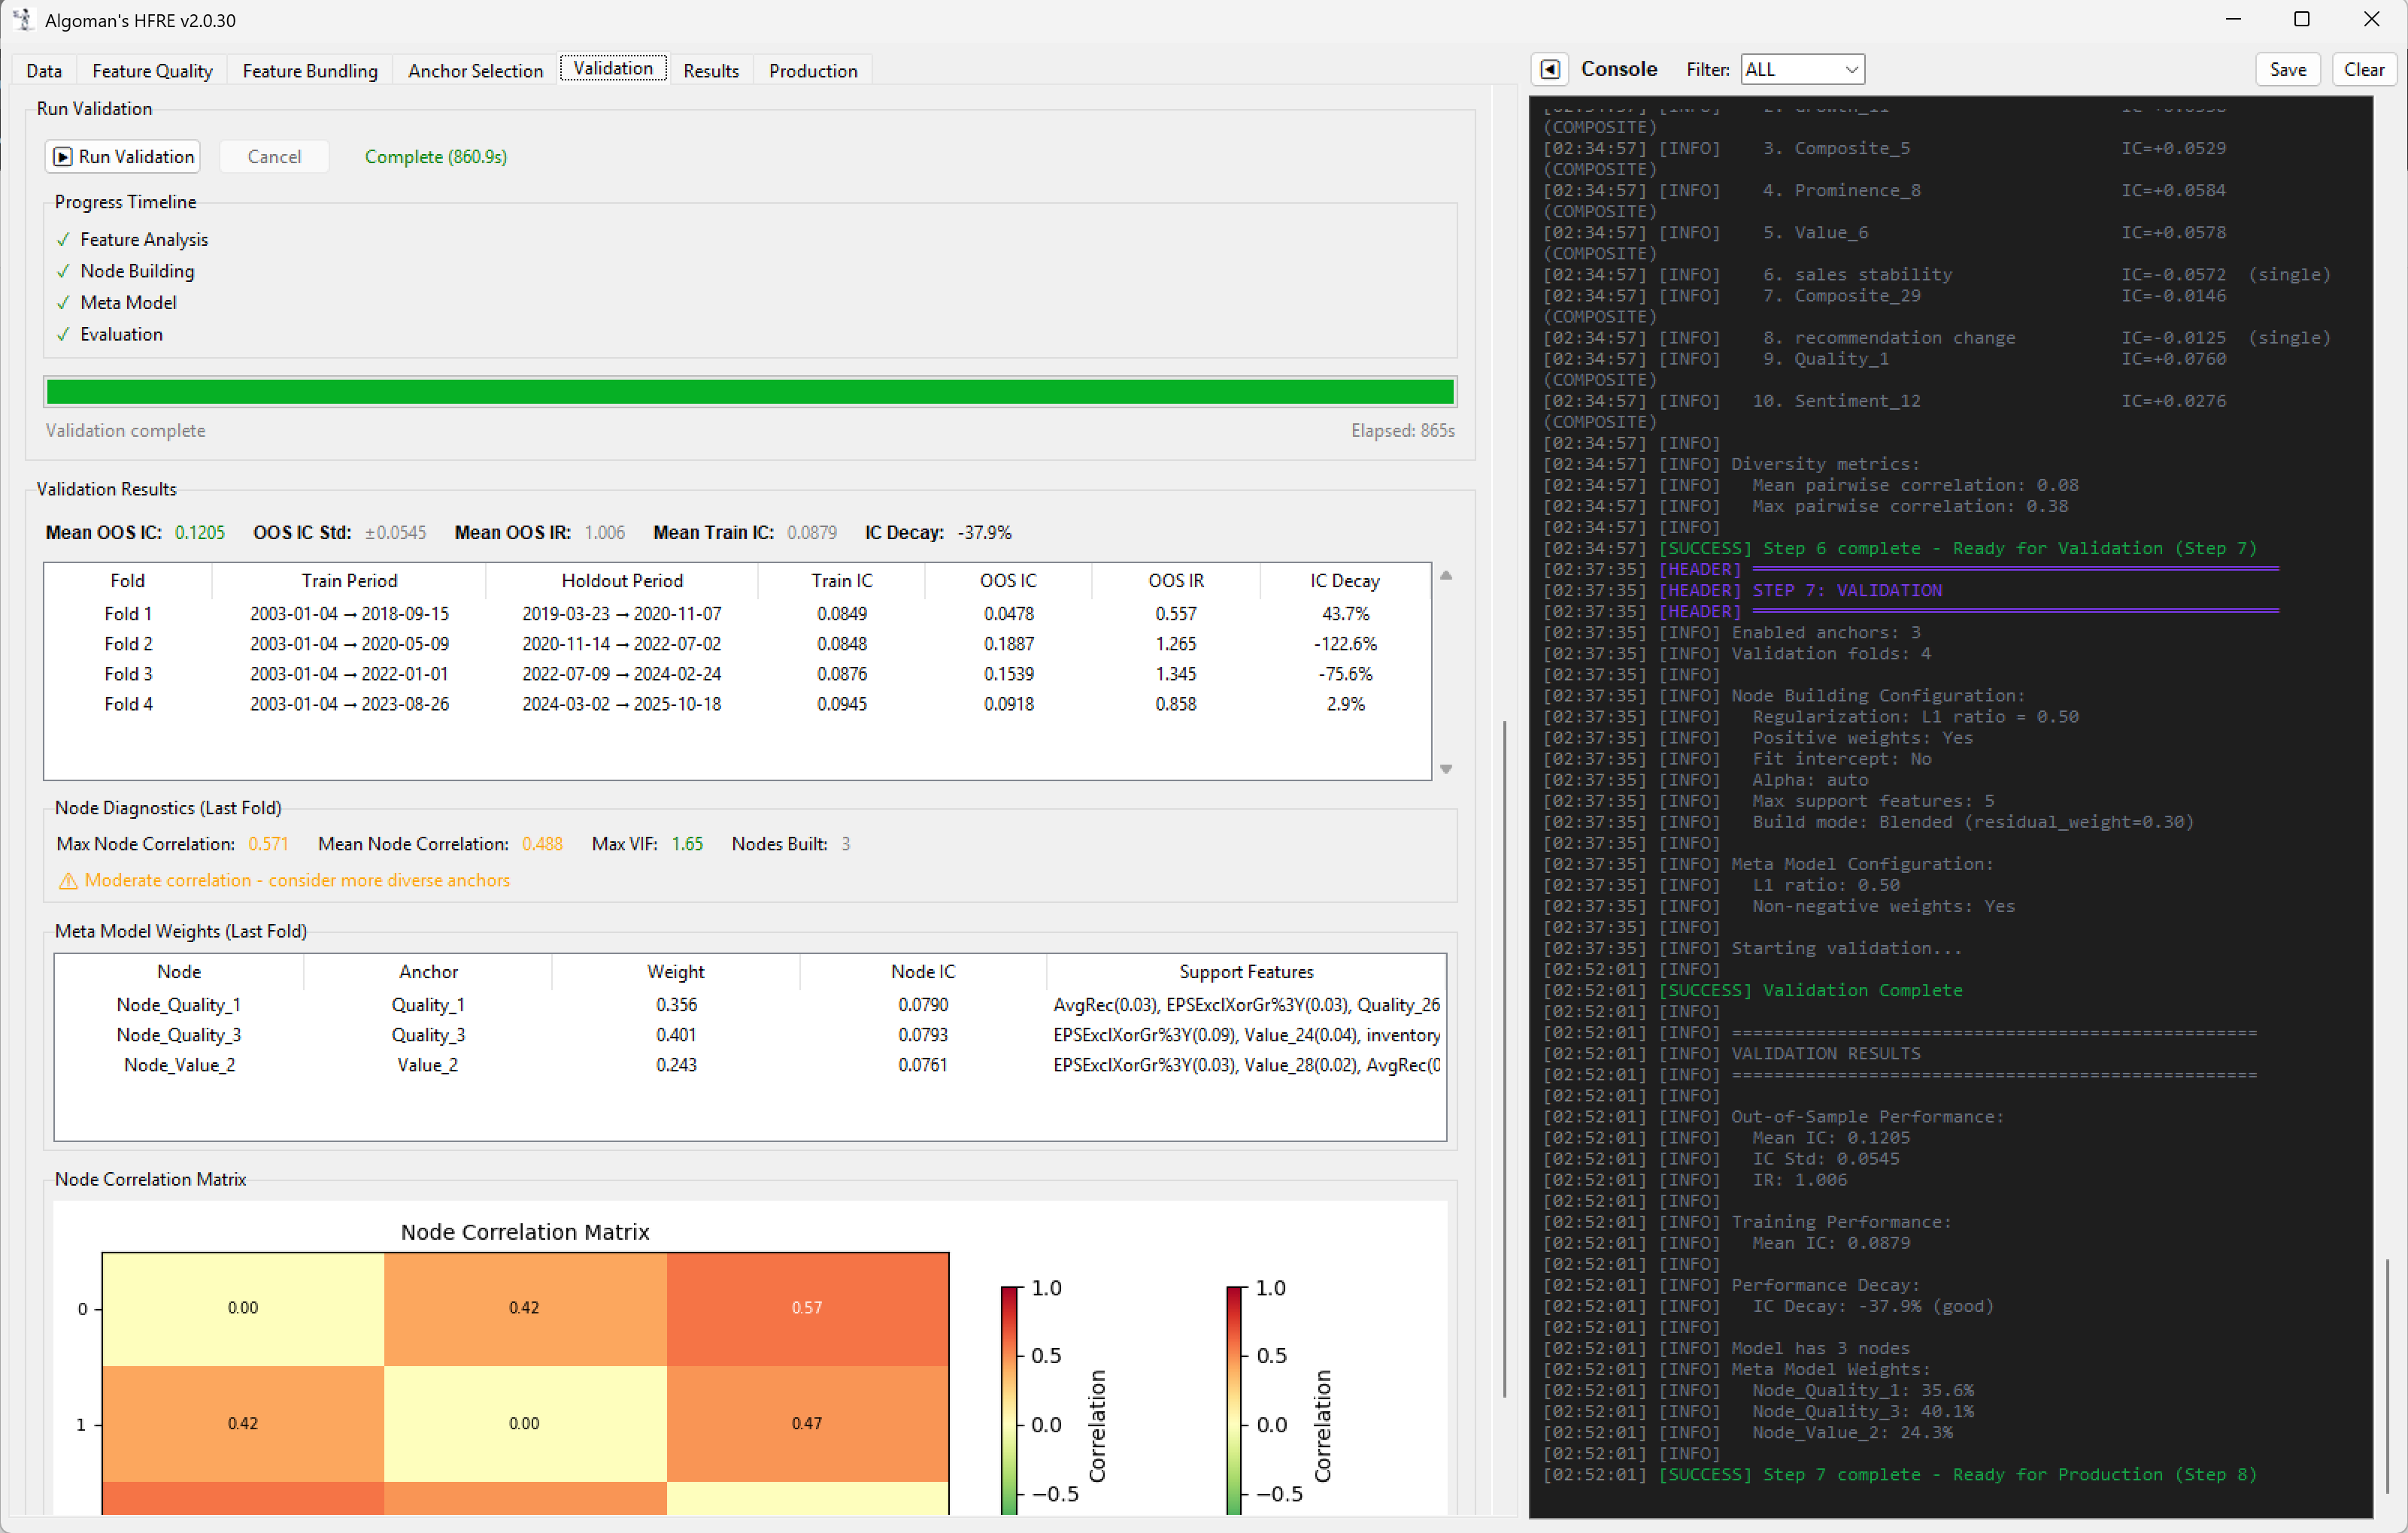
  4. Finally, run a meta-Linear ML (like ElasticNet) on the output of all nodes to determine the final system weights.

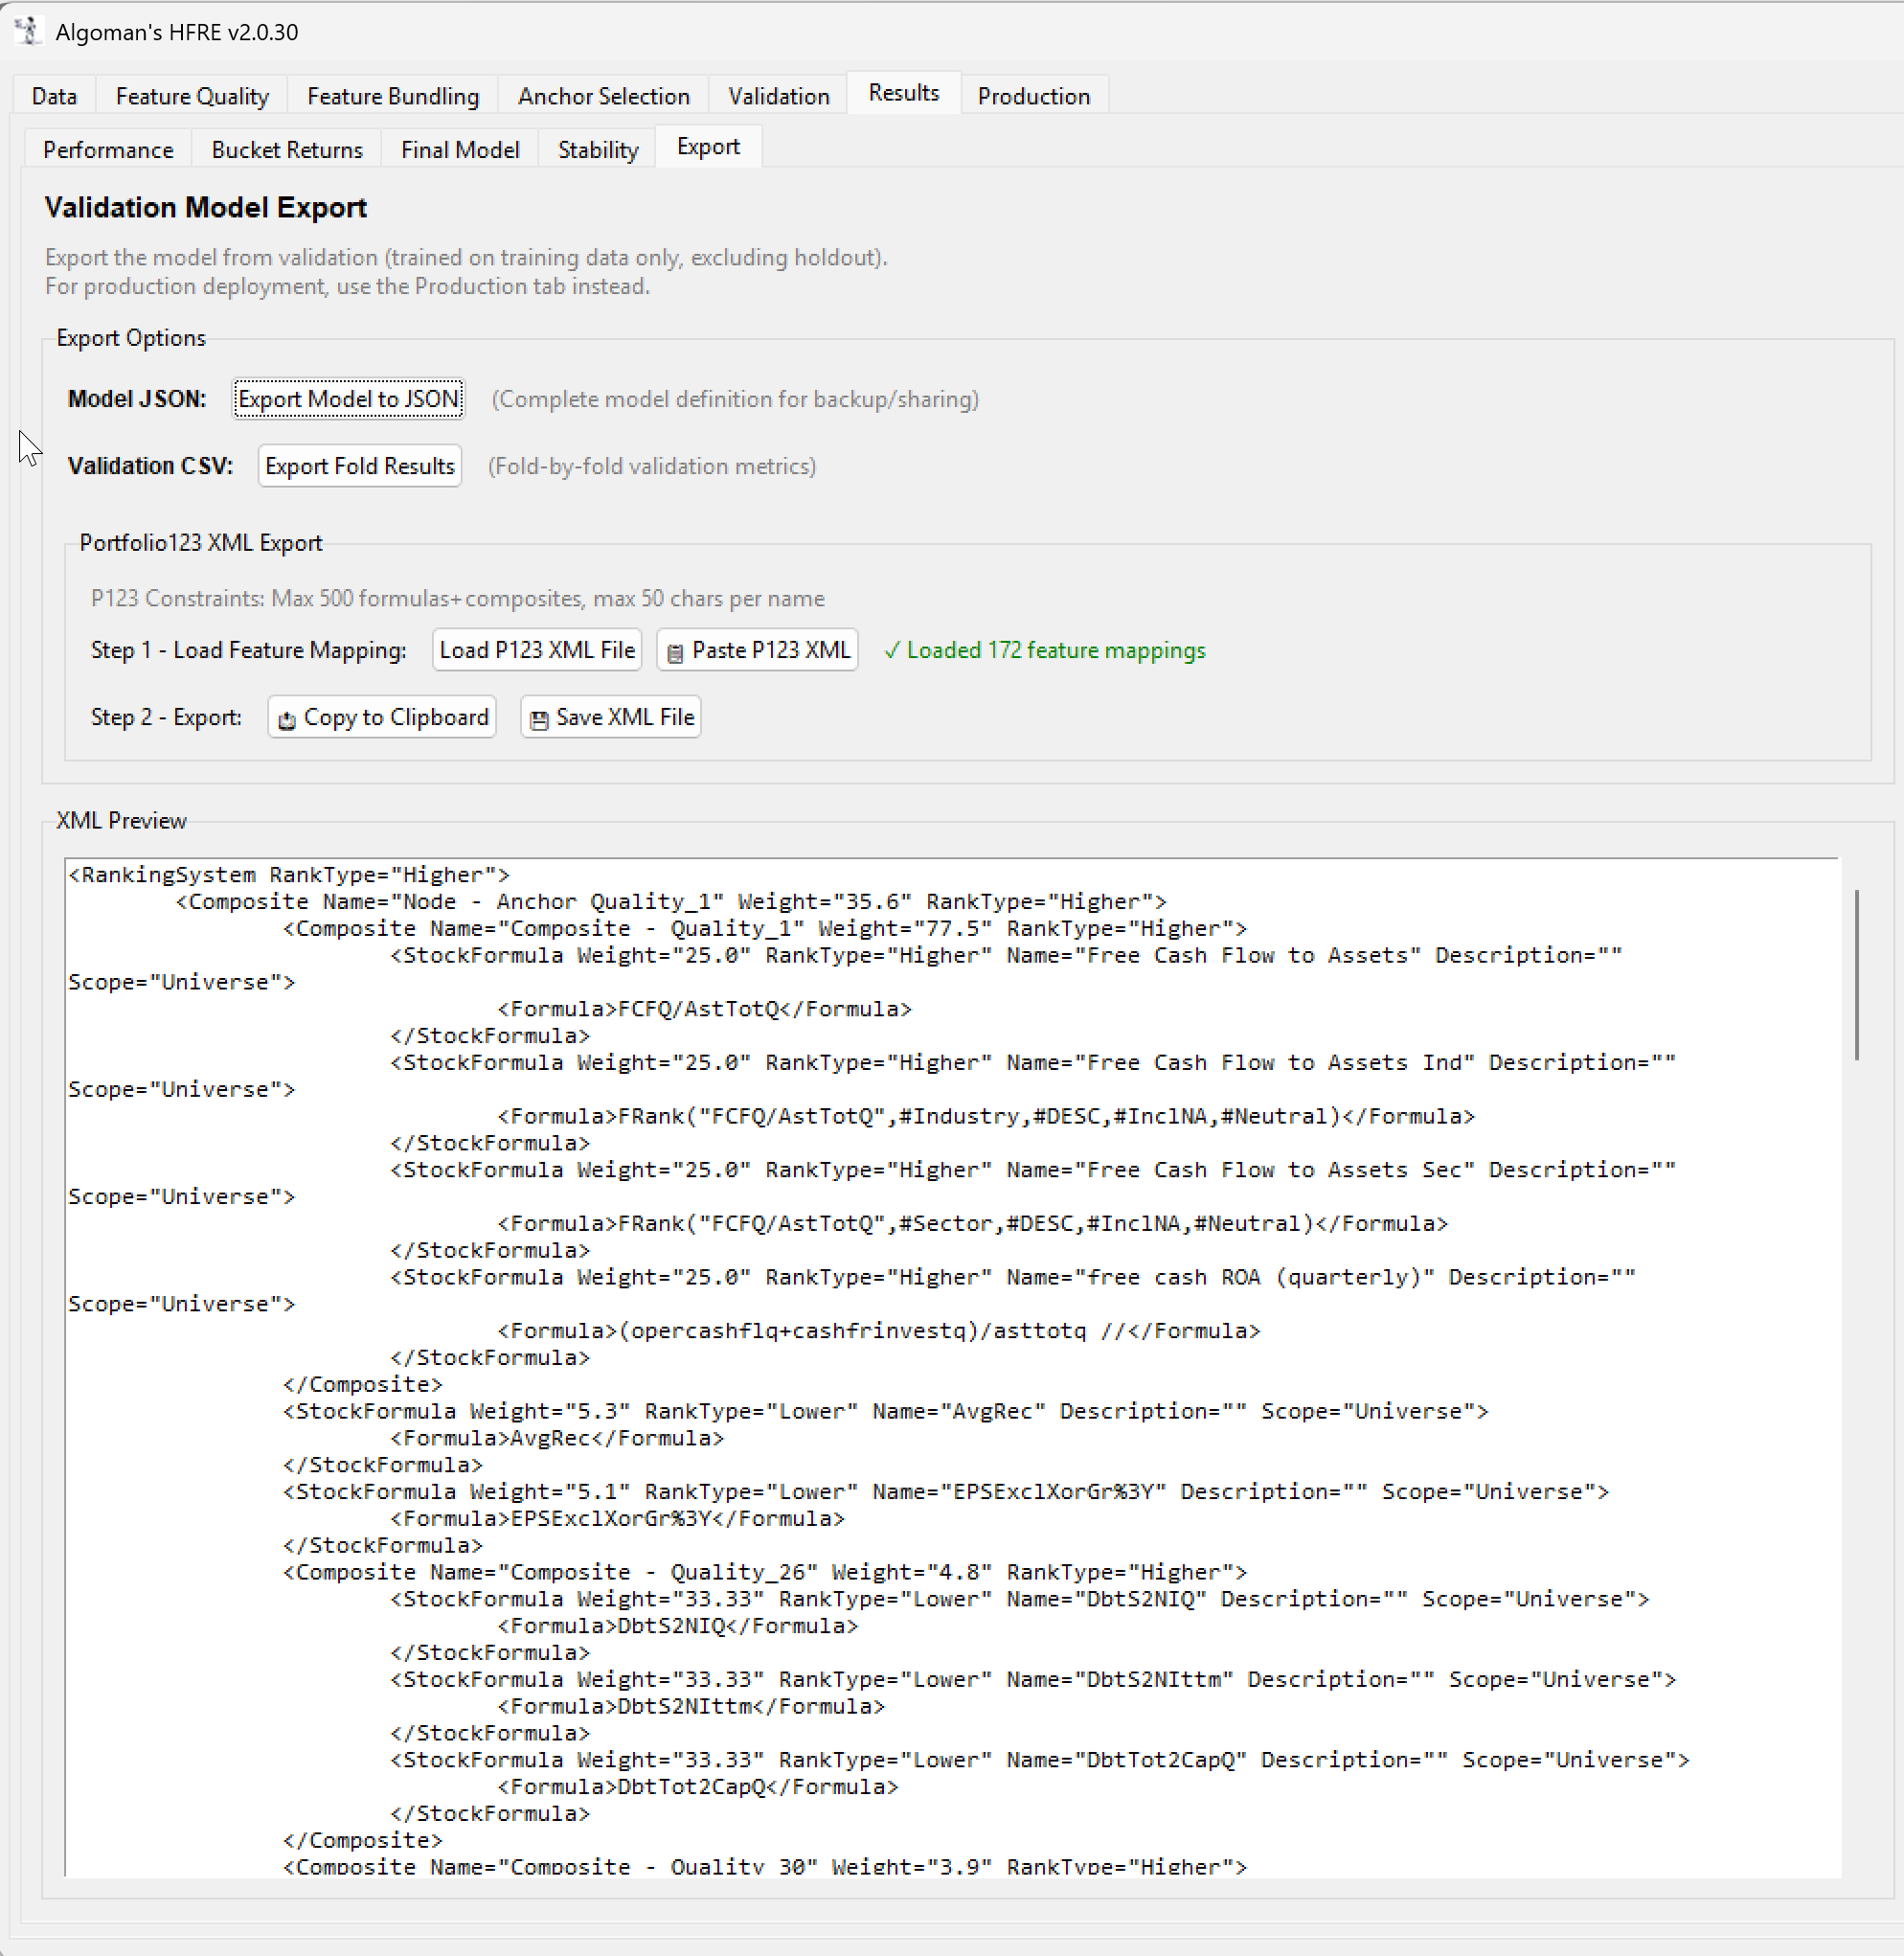
The beauty of this hierarchical approach is that the resulting model is fully transparent. Because both layers are linear, the entire tree can be "transpiled" directly into a traditional Portfolio123 Ranking System via XML. This allows for final backtesting, stress-testing, and manual "sanity-check" tweaks within the P123 environment we all know and trust.

Has anyone had similar ideas? I would love to get some inspiration from other methods to add dimensions and control of linear ML ranking systems before I dig my self to deep in to this concept.

3 Likes

This just a kind of clustering, it should work pretty nice, btw pca (unsupervised ML) works better in that kind of structures You are amaster @AlgoMan

2 Likes

How has your PCA method worked? I have used its cousin: factor analysis.

So my experience with factor analysis. Load of about 0.15 or 0.2, parallel analysis for latent factor selection, variance explained as you have used. Surprisingly, I don’t think you have to make the factors orthogonal and the features make more sense this way. For example you will be able to identify a value latent factor, a growth latent factor etc Even subcategories within value. Sales will cluster for example.

I discard negative loadings.

Like you, I think this underperforms slightly. But is it true underperformance or just that this has zero degrees of freedom and it cannot be overfit?

Either way you can be done in a morning.

Hierarchical clustering is pretty and nice too. Hierarchical clustering is a non-parametric way to do the same thing I believe.:

2 Likes

Hierarchical clustering is kind of the opposite of what I’m trying to achieve.

With Hierarchical clustering, you would put correlating features in to one branch, basically creating an unsupervised Core Combination type of ranking system. More of a "Bottom-Up" discovery process.

What I’m trying to achieve is a "Top-Down" process. If I chose a momentum factor in one node as the anchor, which other factors should be match with momentum to maximize the return of that node? Probably a low volatility factor, low sales deviation etc. Each node becomes a Micro Strategy with a theme.

If I would use a Hierarchical clustering, I would probably face the same issue where the ML will tilt towards the extreme of one factor style (or a cluster of factors).

In the Toolkit I made, one of the analysis is a cluster tree. It’s very useful to detect and avoid multicollinearity, which Linear ML algorithms is extremely sensitive to.

I’m planning to create an auto-selection of anchors, one of the setting for this will be to have a minimum correlation distance between the anchors.

2 Likes

I’ve been experimenting a bit with this concept.

For Step 2 (Defining Node Anchors), you could use the predefined P123 Style Ranking Systems as archetypes, and then find a set of factors that strongly correlate with them while also generating high returns.

For Step 3 (Finding supporting factors), one approach is to apply the 'Boosting' concept found in algorithms like LightGBM. The idea is to calculate the Residuals — the difference between the Anchor's predicted return and the actual stock return. The model then scans for complementary factors that specifically predict these residuals to 'boost' the node (e.g., adding a Quality factor to fix the errors in a Value node). In this scenario, the residuals become your target for Step 3.

However, so far, I have not found this framework to produce higher returns compared to standard methods (more greedy methods).

Below is a part of output from my script:

2 Likes

Excellent. This is also a great way to look for positive interactions –as I am sure you already know. Knowing (and controlling) the interactions within a node would almost certainly be helpful.

More generally, interactions are something that feels under-explored in the forum. Interaction terms in linear regression are seldom discussed, and while you can constrain interactions in XGBoost, it’s hard to manage when you have a large number of features. My concern is that many spurious interactions get pulled in.

Also, feature importances in P123 don’t really tell us anything about interactions

I’m considering using the “glass box” Explainable Boosting Machine (EBM) in InterpretML, where I can toggle pairwise interactions on/off, remove features on the fly, and visualize the marginal performance curves.

Do you have any experience with EBM / InterpretML for this kind of workflow? I’m planning to explore the “glass box” approach next. It seems promising but I have not used it yet.

1 Like

I’m deep in to (re)building my concept, the first trial was not a success.

The current process looks like this at the moment. First pick the anchors, will run an IC analysis to as decision support. Each anchor will be the general of a Node.
In my first trial I fumbled allot to figure out how to use anchors, I think I got it now. To build the Nodes I will use Residual Learning - Node 1 explains the target. Node 2 explains the error (residual) of Node 1. Node 3 explains the error of Node 2 and so on. I will let the best predictive anchor be the general of Node 1, to chose which anchor to use for the following nodes I will use “Diversity-Aware” sorting or MMR (Maximal Marginal Relevance). There is a risk I will loses quite a bit alpha with that way so will try a hybrid approach.

Anchor selection is the only thing that really works for now.

Validation page as it is now. Running an analysis, extremely slow since I have to recalculate everything after each node is complete

I hope I will get some good results, spent so many hours on it :man_technologist:

4 Likes

Nope, using pure residual learning is too conservative, getting very stable results, but not greedy enough. Will have to make a mix… Still got hope for great results

2 Likes

I think this app will become the bridge from AI to classic P123 rankings.

I had lots of spare time to focus on this app this last week, just keep coming up with new functions to add, but it's basically ready. However, I will be traveling quite a bit the coming weeks so I'm not sure when I can upload a production ready app, but it's coming.


What It Does

HFRE takes your P123 factor data export and builds an optimized hierarchical ranking system that you can import directly back into P123. It uses machine learning techniques under the hood, but the output is a standard P123 ranking system XML - no black box, fully transparent weights and directions.

The key insight is that instead of manually tweaking factor weights, the app identifies which factors actually predict returns (via Information Coefficient analysis), groups correlated factors together to reduce redundancy, and builds a multi-node ranking structure where each node captures a different "theme" in your data.


The Workflow (7 Steps)

Step 1: Load Data Export your universe data from P123 with all your factors and forward returns. The app automatically detects your date column, ticker column, return column, and all your factors.

Step 2: Feature Analysis (IC Calculation) The app computes the Information Coefficient (Spearman correlation with future returns) for every factor across every date in your training period. This tells you which factors actually have predictive power and in which direction (Higher is better vs Lower is better).

Step 3: Feature Reduction If you have many factors, this step helps you remove redundant ones. It identifies highly correlated factor pairs and lets you keep only the most predictive one from each group. This prevents multicollinearity issues and keeps your ranking system lean.

Step 4: Feature Bundling (Optional) This is where it gets interesting. The app uses hierarchical clustering to identify groups of factors that move together. Instead of having 5 separate value factors competing, you can bundle them into a single "Value Composite" that combines their signals. Each composite is properly normalized and gets its own IC calculated.

Step 5: Anchor Selection Now we build the ranking structure. The app uses a greedy forward selection algorithm to pick "anchor" factors - these become the primary signal for each node in your ranking system. It prioritizes factors with high IC that are uncorrelated with already-selected anchors, ensuring diversification.

Step 6: Validation This is the heart of the ML approach. The app runs walk-forward cross-validation:

  • Trains on historical data
  • Tests on out-of-sample holdout periods
  • Repeats across multiple time windows

For each fold, it builds nodes around each anchor (adding support factors that improve the signal), then fits a meta-model to weight the nodes optimally. You see performance metrics like IC, Sharpe ratio, and bucket returns across all holdout periods.


Step 7: Export to P123 Finally, the app generates P123-compatible XML. All the node weights, factor directions, and composite structures translate directly into P123's ranking system format. Just copy-paste into P123's ranking editor.

Imported factors

Back test further in P123


Key Benefits

  • No more guessing weights - The validation process finds optimal factor weights based on actual out-of-sample performance, no need to manually split universes with MOD
  • Handles correlated factors properly - Bundling and the node structure prevent you from accidentally overweighting similar factors
  • Walk-forward validation - You see how the system would have performed on data it wasn't trained on
  • Transparent output - The final ranking is a standard P123 composite structure, not a black box
  • Iteration is "semifast" - Change parameters, re-run validation, compare results with a few clicks

What You Need

  1. A P123 data export (CSV) with dates, tickers, factors, and forward returns
  2. No python, no coding required (the app is a desktop GUI application)
  3. A few minutes of patience for the validation to run

More details and the app itself coming soon, trying not to add more functions now, just final tweaks. Happy to answer questions in the meantime.

13 Likes

This sounds very promising! A few questions:

a) The export might be pretty large. What if you have 300 factors and weekly data? How do you generate this data? Do you have to run a screen every week over the last 25 years?
b) How does the program cluster factors? Does it look at the actual items in the factors to see which are related? Do you label the factors yourself so that it can tell FCFA/MktCap (a value factor) from FCFA/AstTotA (a quality factor)? Does it cluster them by looking at which stocks have which rankings for each factor? By forward returns for each factor?
c) How does it handle slippage costs? Or do those not come into play?
d) Would it create different ranking systems for going long and going short? Obviously, that would be ideal. In my experience you would choose and weight very different factors for each approach.

Anyway, looking forward to seeing how this works in practice!

A) You do one Factor Download from; RESEARCH — TOOLS — Download Factors
Here you will add factors from a ranking system and add targets to work (normalize by rank) and lastly add a 1W future return factor for creating reports in the app (not normalized).

B) We will generate a correlation dendrogram, we adjust a clustering limit and it will calculate which features has high correlation and cluster them in to composite nodes. The app will look for keywords in the feature names to automatically give the theme names like Value and Quality (does not always get it right) or you can rename them your self. You can approve all clusters one by one, if you don’t agree with the cluster choice you can remove a feature from the node or just skip creating the node and the let the feature be stand alone features.

C) It does not handle slippage cost now, but I have been looking at techniques how to do it, posted about it the other day. That’s new territory for my so will not come in the first release.

D) As the app is coded now it will “create” perfect linear annualized quantile return curve for the ranking system. But I’m looking at techniques to generate more of a S-curve or a “hockey stick” curve. If get that to work before first release you would have to use a short target (negative future return) for a short strategy.

1 Like

Could you expand on this a bit, please? For example, if I download all the factors for all the stocks on a particular date, I can run a correlation table and see which factors are correlated according to which stocks have them similarly ranked. Or if I were to map all the features to their future returns, I could correlate them that way. Which does your program do? Or is there another way that I haven't thought of?

1 Like

A correlation matrix is generated in the background calculating pairwise correlations using all the downloaded (normalized ranked) data for all the features on all dates.
The correlations are visualized in a dendrogram.

Once correlations are calculated, they are converted into a distance metric that defines the "Height" on the dendrogram's Y-axis. The formula used for this distance is:

• Height = Distance = 1 - |correlation| .

This means that:

• Low Height indicates high correlation (similar features).

• High Height indicates low correlation (distinct features).

• Cluster Node Identification: The process identifies "tight clusters," typically defined as groups merging at a height of less than 0.30 (correlation > 0.70).

In this picture the “merging” setting is set at 0.5 visualized with a red line through the dendrogram.

Cluster nodes / features will be highlighted in the dendrogram when accepting the new cluster node to get a better understanding of the relationships.

1 Like

So what does this correlation take into account? The names of the stocks and the future returns? or just the stocks? or just the future returns? Obviously, just the dates and the normalized rank data isn't enough to determine any correlation without either tickers or future returns.

1 Like

I think the confusion is around what “correlation” means in this context.

The correlation matrix measures feature-to-feature correlation, not feature-to-return correlation. It answers: “When Factor A has a high value for a stock, does Factor B also tend to have a high value for that same stock?”

Concrete example:
Imagine on a single date you have 500 stocks with values for two factors:
∙ P/E Rank (0-100 for each stock)
∙ P/B Rank (0-100 for each stock)
The correlation between P/E and P/B is simply: across those 500 stocks, when P/E rank is high, is P/B rank also high? This is a standard Spearman correlation across the cross-section.

So what is needed:
∙ Date (to group stocks into cross-sections)
∙ Ticker (to match factor values for the same stock)
∙ Factor values (the actual data being correlated)

And what is NOT needed:
∙ Future returns (not involved in feature correlation at all)

Returns come into play later when we calculate Information Coefficient (IC), which measures each factor’s correlation with future returns. But the feature-to-feature correlation matrix is purely about redundancy between factors - if P/E and P/B are 0.97 correlated, keeping both in your ranking system is redundant regardless of whether they predict returns.

I think it is how the term “rank” is used in classic P123 ranking system compared with how “normalized rank” is used in a ML context that it causing confusion.

3 Likes

Thanks, that answers my question. It's the stocks that are taken into account, not the returns. Perfect--exactly the way I would have done it myself.

3 Likes

I think Algoman is extremely nice to provide and share this app to all P123 users without the need to use Python or any coding.

It will cost a lot and likely very expensive to hire someone in US with the skill set and ability to develop this app in-house.

It has been a while since I met such a sincere and generous person. He is definitely not doing it for the money.

Regards

James

6 Likes

Then which factor should be kept ?

The one with the highest Information Coefficient (IC).

I think I solved the "Linear" issue with Linear AI ranking systems

Test with traditional ElasticNet model (OOS).

Since we really don't care about the ranking order of the lower deciles in a ranking system, we can penalize miss ranking a top-decile stock way more than a bottom-decile stock. The model will basically adjusts coefficients to minimize errors on high-target stocks witch leads to better separation at the top, possibly worse in the middle and below.

Below a test with same features as the test above, same target, same ElasticNet model, but with graduated sample weighting on the top 20% buckets. (OOS)

9 Likes