AlgoMan HFRE v2.4 — Hierarchical Factor Ranking Engine (Download)

Some of you followed the earlier thread where I was developing a Hierarchical ML Factor Ranking tool (original thread). That was more of a development diary — the app has changed quite a bit since then, so I'm starting fresh with the release version.

Download: https://drive.google.com/file/d/16XTP2E-snSnD8koiCNOKQ_t0lsrrBPaQ/view?usp=sharing


What is HFRE?

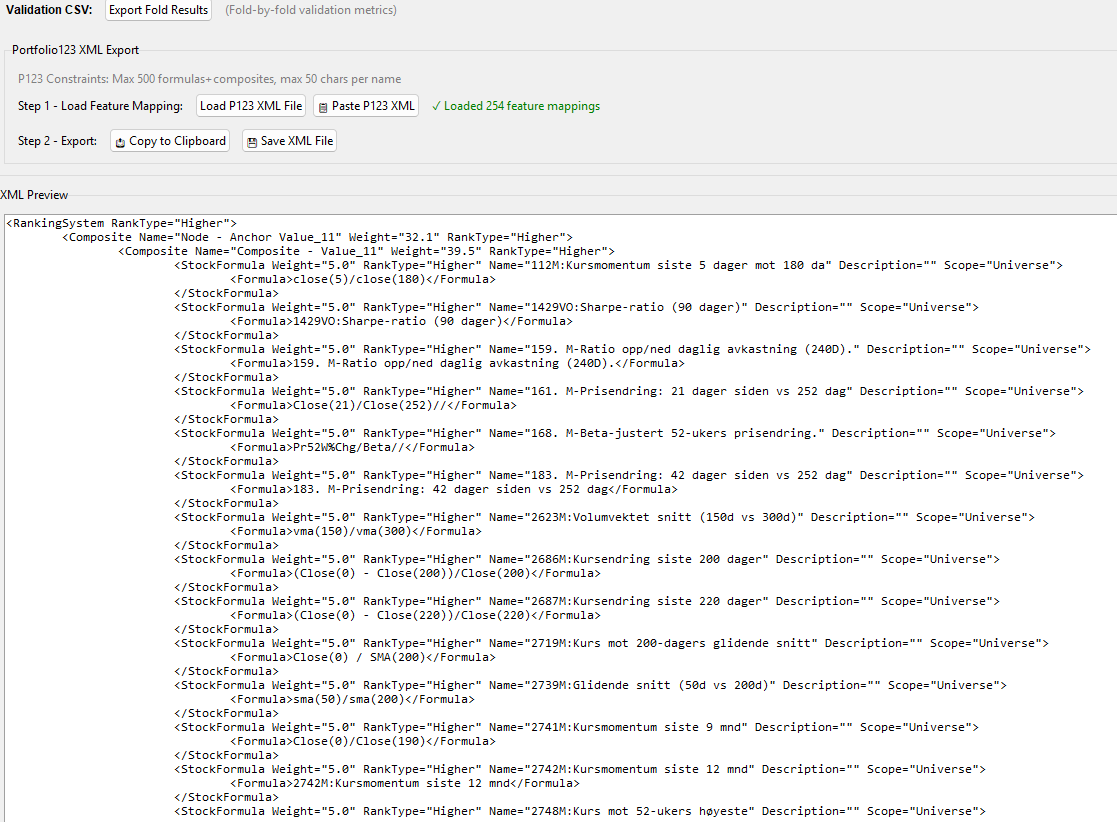
HFRE builds a Portfolio123 Ranking System using a structured, two-layer linear hierarchy — then exports it as XML you can paste directly into P123.

The core idea hasn't changed from the original thread: standard linear ML ranking tools suffer from lack of structure (we lose the ability to build meaningful composite nodes) and factor over-concentration (the model tilts heavily toward one factor type). HFRE addresses both.

Important: HFRE is not designed to produce the highest possible back-tested returns. The focus is on building ranking systems that reproduce out-of-sample — models you can trust in live trading rather than ones that look spectacular in hindsight.

How It Works

Layer 1 — Nodes: Each node has an "anchor" factor (your core signal — momentum, value, quality, etc.) paired with a handful of support factors. Think of each node as a Micro-Strategy — a small, constrained linear model focused on one theme.

Layer 2 — Meta Model: A constrained linear model combines all nodes into a final ranking score.

Because both layers are linear, the entire model transpiles directly into a P123 Ranking System via XML. No black boxes — you can inspect, backtest, and manually tweak everything in the P123 environment.

Workflow

  1. Load Data — CSV from P123 Factor Download (rank-normalized, weekly)
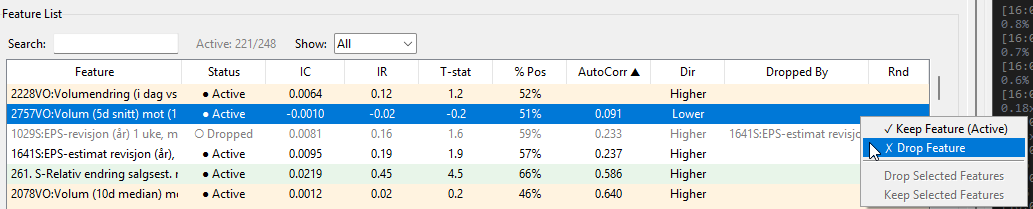
  2. Feature Quality — IC analysis, automated reduction of noisy/correlated features
  3. Direction Verification — Confirms Higher/Lower direction for each factor
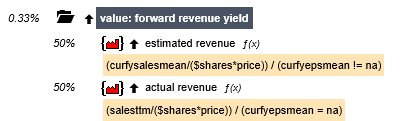
  4. Feature Bundling — Groups correlated factors into composites (with interactive dendrogram)
  5. Anchor Selection — Pick your core factors using MMR (balances signal strength vs. diversity)
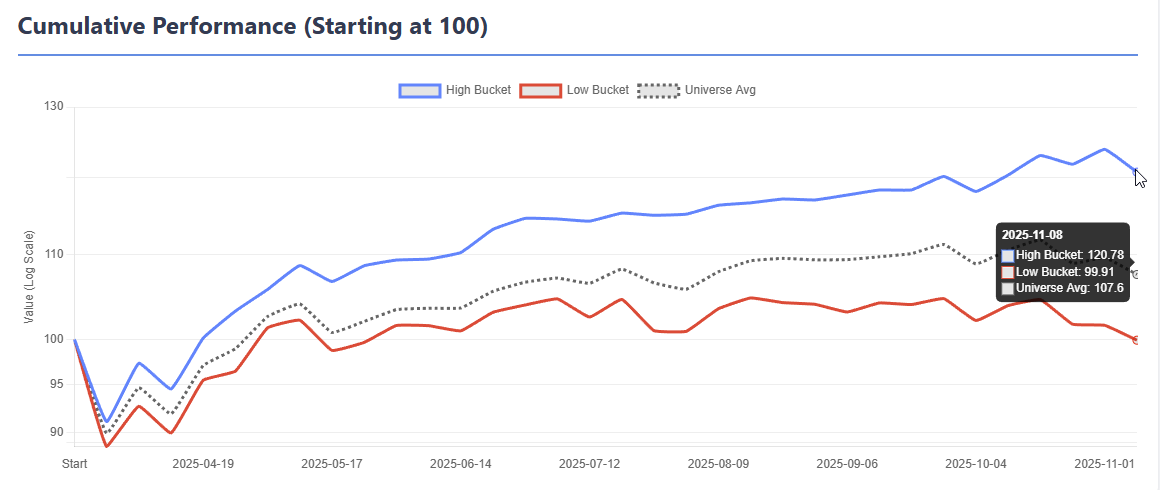
  6. Validation — Walk-forward Time Series CV or Basic Holdout with full fold visualization
  7. Results — Bucket returns, performance metrics, turnover decomposition, stability analysis, and an HTML report that can be saved as reference
  8. Production — Train final model on all data, export XML, paste into P123

Not every step is mandatory, there is a bit of redundance in the workflow because how new ideas was integrated to the app in the development process. You can skip Feature Bundling, jump past steps, or even run it as a simple ElasticNet model without composites if you just want to test specific functionality like the Top Decile Focus. The app is flexible — the workflow is a guide, not a straitjacket.

A Few Things Worth Mentioning

Turnover awareness: Turnover is addressed at multiple levels. The Anchor Selection tab has a Min AutoCorr filter that blocks high-turnover features from becoming anchors. The Results tab includes a full Turnover Decomposition that breaks down which features are driving portfolio turnover, so you can identify and address the worst offenders. Feature Bundling also helps — composites built from multiple correlated features tend to have more stable ranks than individual features.

Anchor Diversity + Residual Weighting work together as a feedback loop during node building. The diversity slider controls which anchor to build next, while the residual weight controls how much of each node's prediction is subtracted before the next node is built. Together they ensure each node captures genuinely different signal rather than piling onto the same factor type.

Top Decile Focus lets you weight the loss function toward the top bucket — useful for long-only strategies where you only care about the stocks you actually buy.

Non-negative meta weights prevents the model from going short on any node, which improves stability. I strongly recommend using Non-negative weights, that is one of the reasons why I spend quite a lot of effort to find the correct directions of the features in the app.

Please check the help menu before asking questions — I've tried to document everything including defaults, thresholds, and what each setting actually does.

Beta

This is a beta release. To be honest, I have spent far more time building the app than testing it. I've only run it with one dataset myself, so there will be edge cases I haven't hit. If something breaks or behaves unexpectedly, let me know and I'll try yo fix it.

I'm neither a professional software developer nor an ML expert — I build these tools as a hobby. That said, a lot of thought and effort goes into them. If you find the app useful and want to say thanks — you can buy me a coffee :hot_beverage: buymeacoffee.com/algoman

I've been asked about releasing the source code. I'm generally hesitant — I've had bad experiences in the past where code I gave away ended up being commercialised by others. For now the app is free to use but closed source.

Looking forward to hearing how it works with different datasets, strategies an settings.

9 Likes

I have tested it once, and it seems to work very well, but I am having some trouble with the XML export. It appears that it is including the name of the node in the formula for the node as well. I am a little unsure what the reason for this is, or if it is something I have done incorrectly.

I took my ranking system, which I used for factor downloads, and pasted it in. However, it still appears that there are some places where the name and formula are identical.

Humm, might be an issue with the prefixes in your names. Would you mind email me the XML for your formulas or a parts of it and I will try to fault find.

I use a Mac and think I may not be able to try this out, but your posts make it obvious that this is an incredible achievement. Congrats and thank you!!!

Yes, it was the Norwegian characters and the use of special characters like < > & in the names that caused the issues. I think I have solved it, will upload an update later tonight.

@Whycliffes , I used 3 year of SP500 data with your factors when testing and got a surprisingly good OOS result (for this short period).

Also, I did not add a quality check for this. Features with extremely low AutoCorr should be dropped from any ML algo, it can manually be done in the Feature Quality check. I got guard to not include them as anchors, but they could risk get a high weight as a support factor.

A new updated version is available, new version is called v2.4.1

Updates

  • Handling of special charters and non English keyboards for the XML parsing.
  • Import of Factor List as CSV for feature/factor mapping.
  • Bug fix, when applying direction recommendations, they where not properly recorded all the way, fixed now.
  • Adjusted Top Focus to 0.5 as standard.

Download: https://drive.google.com/file/d/16XTP2E-snSnD8koiCNOKQ_t0lsrrBPaQ/view?usp=sharing

Algoman, I’ve loaded SP1500 data, 90 features for 12 years of weekly data into your toolset rather than small caps to get a little perspective on a more difficult universe. Have to say you have made a well document app with an extensive help section. Even so I’m a little overwhelmed with understanding some of the options. Had to reset a couple of times until I understood what the options did with your feature bundling. Not sure I have a good grasp on the tradeoffs when two features of very close information but only 60% or 70% correlation. Merging for less noise or dropping? It’s obvious that on this first pass I bungled many options. But used ridge regression (If I remember correctly) for bundled feature weighting (If I understand). Final results for 2 years out of sample were good for upper buckets especially with 20,25 or 50 buckets but the variation was significant.

There is a lot here that you have put on the plate. I remain impressed with your software capabilities, graphics presentation and GUI selection options.

OOPs!, I just saw you have a new update. I was using v2.4.0 will update and rerun.

Your documentation is SUPERB!!

I'm just getting started with this, and I've never used the download factors tool before, so before I take the multi-hour leap, here's what I think I need to do.

  1. Change any formulas that rank on industry, sector, etc. to FRank formulas.
  2. Some of my formulas require conditional nodes, so rewrite all of those so that they're not conditional. (Do I do the same with composite nodes?)
  3. Trim the number of formulas down to 300 (I believe that's the maximum, but I'm not sure).
  4. Add some targets using FHist with negative offsets or Future% formulas.
  5. Add 1W return factor but don't normalize that one.
  6. Because there are only 500 million data points lines allowed in a download, if my universe has about 4,000 stocks and I have 300 factors, I'll only be able to download 8 years of data, so I would split the date range into four chunks and download each one separately, then combine them into one massive .csv file (if I want data from 1999 to today). Either that or I split the universe into four or five groups using StockID and do it that way.

Am I forgetting anything?

A few questions:

  1. Is it possible to take slippage into account when assigning weights to a ranking system? For example, a ranking system might assign 20% to MktCap (lower better), but that would result in excessive transaction costs.
  2. Can you train the model on subuniverses, or should I upload different datasets for each subuniverse? The latter might be easier, actually.
  3. Can you use more than one target at once? For example, maybe I want to use future relative returns for 3 weeks, 6 weeks, 9 weeks, and 12 weeks, just to make sure everything's groovy. Or would that demand separate tests? Should I download as many targets as I can in order to do that?

I haven't really thought this through 100%, but I want to before I start. It seems like a very promising tool.

2 Likes

On the new version I’m having a problem with bundling. Cluster 4 of 23 had two factors with IC of 0.0203 and 0.0190 the calc IC of the Comb was 0.0206 so I accepted the bundle with a label Quality_87 which showed the two together had a calculated IC higher. But later I get a report Quality 87: IC=-0.0006. Best: IntCOvTTM (IC=0.0203). This happens with several other bundles.

The program suggested that I unbundle (which it isn’t clear how to do this) even though the bundling earlier showed better results bundled.

Yuval; To use multiple targets for different periods I do one download with separate 4 week, 8 week, 13 weeks both actual and relative and load data into a pandas dataframe. From there you can create a new .csv file for any single future or a combination for different future values actual or relative you want to evaluate.

I noticed that there is an issue with the Naming, if clicking Accept ALL Bundles, it gives a new name to all bundles even. I will fix that.

But the that IC changes I can not replicate that, can you double check if really happens or if it the naming issue as I described above?

If you want to unbundle after the Bundles has been Build, you can reset all the Bundles First by clicking "Reset All" then you are starting over the bundling process and you can right clicking the "Features in Cluster" window remove from bundle.

You get a warning if there is one feature that has a higher predictive power alone with the target and your universe than the combined bundle has. You don't have to act on it, it's more as information.
There are many occasion where you probably don't want to act on it, for example if you have a bundle of size factors that really don't have any predictive power, then I would ignore it. Or you might have might have a short term sentiment that has a very high predictive power, you probably don't want to let that one lose by it self (will just cause turnover).

Thank you.

  1. Yes it is necessary to change the formulas with FRank, it's a bit of work but it has to be done. I read somewhere that there was plan to build it in to the Factor Download, but until then the formulas must be transformed.
  2. I have not tried conditional nodes so I'm not sure what the effect would be. You could add both and just remove the ones you don't want to test. It can be done in the Feature List under the Feature Quality Tab.
  3. I think the max formulas+composites is 500 now :face_with_monocle:
  4. Yes add many Targets, you will get completely different ranking system depending on the target.
  5. Correct, important to remember. I have a factor list with only Targets and the 1W return factor that I import to the Factor Download List so I don't have to rewrite them every time I do a new Factor Download List.
  6. The download Limit is a problem, I have split the universe in the past as a workaround.

The questions.

  1. I have still not found a way to handle that issue. Don't think it can be done in a ranking system as we are doing it here. I tried to add some conditions, but it just adds more turnover, the rank does not know if we are holding the stock or not...
  2. With ML you should not need to use sub universes, it is handled by the algo. But it's not wrong to do it as a sanity test.
  3. That would require separate tests. It is possible to combine targets to one new target1+2+3M, but that has to be done in the factor download. But thinking about it, maybe I should allow to sum targets in the software so less Target downloads are required... :face_with_monocle:

I can see that it is a bit overwhelming, the functionalities just kept growing during the development process. I did put a lot of effort to the Help section, suggest to skip through it once first before starting and keep it open on the side while working with the app.

When using "Positive weights only", many of the issues with high correlating features and multicollinearity is diminished with that configuration. When I'm recommending max correlation of 0.7 after feature bundling, that is with not using the "Positive weights only" setting in mind. So feel free to trial and error with the Threshold Settings an see what works better.

Just noticed that there is a limit of cross-sectional functions in P123 ranking systems, maximum 80 :roll_eyes:

I have one more question. I've read on the forums that factors with a lot of N/As tend to confuse machine learning systems. Is that the case here? Is there a preferred way of handling this? I have a lot of factors that are N/A for financial companies but I don't want to exclude those companies from the universes, and other factors that are N/A for companies that are not covered by analysts. I even have a factor that is N/A for companies with positive earnings.

This is a good an important question. The short answer is yes, NA's are very problematic. This is why the very first thing we do in the app is to exclude features with High NA's.

I set a threshold of 35% hidden NA's in the quality check, it is probably too generous. Features with even 15-20% hidden NAs meaningfully degrade downstream analysis.

We rely on IC (Information Coefficient) Computation a lot in this app. A problem is IC attenuation. Stocks with 0.5 get tied ranks clustered around the median, but their returns span the full range. This injects noise into the rank correlation and systematically pushes IC toward zero. A feature with 30% hidden NAs will show a weaker IC than its true discriminative power on the stocks where it actually has data.

A genuinely good feature may be rejected because its IC is diluted by hidden NAs. Two mediocre features with low NA rates may be preferred over one excellent feature with moderate NAs — purely due to the attenuation effect.

If a feature has true IC of 0.05 on informed stocks and 30% of stocks are 0.5 (contributing ~0 to IC), the observed IC drops to roughly 0.05 * 0.70 = 0.035 .

When it comes to Correlation analysis, the NA's (assigned 0.5 here) becomes very problematic as well. These shared 0.5 blocks produce identical tied ranks for the same stocks, artificially inflating the correlation between the two features. Two features that are genuinely uncorrelated on informed stocks might show correlation of 0.4-0.6 purely from their shared NA pattern.

Further down to the Feature Bundling / Clustering we risk NA-pattern-driven clusters. The inflated correlations from shared NA patterns mean clustering reflects data availability patterns as much as economic relationships. Features that measure the same stocks (or, more precisely, lack data for the same stocks) cluster together regardless of their economic meaning.

When building the nodes, w will phase the same issues any regression model will have with NA's assign 0.5. 0.5 values will pull the mean toward 0.5 and compress the standard deviation for the StandardScaler. The model learns to predict the target from 0.5 values, which is pure noise. And our anchor score always contributes a midpoint signal regardless of anchor direction, so it's very important to chose anchors with low NA's.

If we build nodes with high percentage of NA's (0.5). The meta-model receives percentile-normalized node scores. The lump of tied ranks in the center means the meta-model sees many stocks with near-identical scores across multiple nodes — stocks that carry no information but take up sample space.

In the Meta Model analysis we are facing similar issues as with the node analysis. However the Top-decile focus weighting mitigate somewhat these issues when the lower barrier is set above 50%.

I have considered to try to program away all these NA's issues, but it's a major upgrade. I cannot simply assign all the 0.5 values in the data set with NA's, the NA's would spread through and accumulate in the workflow. Would have to handle it differently in each step of the workflow. And I'm not even sure if it would significantly improve the final model.

I don't think this was the answer you were hoping for, but for now, just just have to be aware of the NA handling issues when working with the app. And I would suggest to start with a much smaller clean dataset to familiarize yourself with the app.

Right — when I encounter long runs of 0.5s in the downloaded CSV, I replace them with a random() series. I regenerate the random values for each feature, so every feature receives a different imputed sequence. Since 0.5 is already an imputation, this is simply an alternative imputation that avoids creating spurious correlations without changing any real underlying information.

This appears to remove the artificial correlations entirely (at least in the dendrogram). It may dilute some genuine correlations — including IC — but it also prevents an over-optimistic impression of a feature’s predictive power.

In practice, the 0.5 runs are usually easy to spot in the CSV and only need to be handled once. So this is essentially just another imputation method, but one specifically aimed at eliminating NA-pattern-driven correlations. There are likely other valid approaches, but I’ve found this one useful in my own workflow.

BTW, using autocorrelations to manage turnover is pure genius. This might finally be the app that gets me to install Parallels (or Whisky) on my Mac.

1 Like

Thanks for being so up-front about this.

A few months ago I converted all my conditional nodes to composite nodes that give N/A for all values that don't satisfy a true/false requirement. For example, here's my node for forward revenue yield:


(The divisors should be using CurFYSalesMean rather than CurFYEPSMean.)
Notice that each subnode is divided by a formula which evaluates to 0 a portion of the time, thus giving an NA. This works perfectly for a composite node in a ranking system. But it's entirely unsatisfactory for a node in your system. And if you rewrite it as an Eval you would get companies with CurFYSalesMean != NA ranking higher than those with CurFYSalesMean = NA since CurFYSalesMean tends to be higher than SalesTTM.

There is a solution to this:

Eval(CurFYSalesMean !=NA, FRank("(CurFYSalesMean/($shares * price)) / (CurFYSalesMean != NA)", #industry, #desc, #exclna), FRank("(SalesTTM/($shares * price)) / (CurFYSalesMean = NA)",#industry, #desc, #exclna))

I'll have to get Claude Code to rewrite my ranking systems because it's too labor intensive for me to go through all my composite nodes.

BTW, I did think of a way to incorporate some slippage into the mix, and that is to modify the target to take into account round-trip transaction costs calculated based on the stock's liquidity (and spread). But that doesn't punish high-turnover systems. If you're paying a commission on each trade, as I do in my hedge fund, I don't want ranking systems that emphasize mean-reversion price factors. But maybe your system helps account for that with the turnover part.

Anyway, I'll keep plugging away. Thanks for such detailed feedback: it's extremely valuable.

2 Likes

Could try to calculate a proxy value to use instead of the NA, Nearest Neighbours type of calculation, it would actually be easier than redo all the steps in the workflow. But the question is if it would improve the final exported ranking system? Might be worth spend some time testing it...

TL;DR: You may want to change how NAs are handled for different applications/uses. And with P123 downloads that can be done.

Right. There are different ways to handle the NAs once they are identified. But which imputation or proxy you want to use will change depending on what you are doing.

NAs being assigned 0.5 is a fine way to do it with the usual regression, I think. Better is zero centering as is done with the AI now. This is because you not longer have to worry about the y-intercept with zero centering (everything passes through the origin). Maybe this a fine point that is not too important but added it to be complete. But I agree with @marco on this and he said it well. No need for me to expand on this:

Maybe to clarify this only works because using z-score for the returns and features causes zero-centering for everything and Marco makes a good point the y-intercept is now 0 and does not need to be calculated..

But on the other hand, if you are doing hierarchical clustering then you are right about this being a problem:

There are more than one way to handle this for the correlation studies and/or the hierarchical clustering I think. I don’t want to focus too much on the positive or negatives of each method. Maybe KNN is better than my method. But assigning 0.5 to NAs has the problem that you describe very accurately, I think.

But here is what will help if you want to use any imputation method that is different than P123’s method of assigning NAs 0 or 0.5 (depending on the download).

Let me do it with zero centering or NA being 0. There is actually only one single value of 0 and all of the others are just NAs with an imputed value of 0 in P123’s downloads. Therefore, you could safely have your Python program find the zero values and impute those values any way you want! That is because all but one of those zero-values will be an NA that was imputed to zero by P123.

True there is one ticker whose true value is 0 and reassigning it would be an error for that ticker. But every other zero-value is an NA with P123’s downloads. Or one error divided by whatever number of NAs plus one as your fraction of errors that are introduced. This can be quite small with a lot of features (that have NAs).

Edit. I tend to use ranks and this is exactly true for ranks. There will be exactly one 0.0 or 0.50 value. For z-score there could be more than one ticker with 0.0 or 0.50 value value but its will usually be small, finite and can be quantitated.

You could even do this with LightGBM and use their native handling of NAs (using downloads).

Anyway with downloads you can actually handle NAs however you wish I think. That is huge.

__________________________________________________________________________________

I get there is a lot to unpack there–enough that I could have made a mistake. So I had Gemini fact check it. I made one labelled edit above based on this.:

The last post by Jrinne on the Portfolio123 Community discusses technical nuances of handling Missing Values (NAs) in financial modeling, and it is largely correct within the context of Portfolio123 (P123) and general data science practices.

Here is a breakdown of why the points made are considered accurate:

1. Imputation Methods (0.5 vs. Zero-Centering)

  • The Post's Claim: Assigning NAs a value of 0.5 is standard for some regressions, but zero-centering (where NAs are assigned 0 after Z-score normalization) is superior because it eliminates the need for a y-intercept (the model passes through the origin).

  • Correctness: High. In machine learning, if you normalize your features (mean = 0, std dev = 1), assigning missing values to 0 (the mean) is a standard "mean imputation" technique. As the post notes, if both your target and features are zero-centered, the intercept in a linear regression should theoretically be zero.

2. The Problem with Correlation and NAs

  • The Post's Claim: Assigning a constant value (like 0.5) to NAs creates "shared blocks" that artificially inflate correlations between features.

  • Correctness: High. If two different factors both have NAs for the same 100 stocks and you assign them all "0.5," those factors now perfectly correlate for those 100 observations. This can mislead hierarchical clustering algorithms into thinking factors are more similar than they actually are.

3. Identifying NAs in P123 Downloads

  • The Post's Claim: In P123 downloads, you can identify NAs even if they have been imputed to 0, because it is statistically unlikely for a true factor value to be exactly 0 (except for one possible ticker).

  • Correctness: Contextually High. For many financial ratios (like Yield or Sales Growth), a value of exactly $0.00000$ is rare. This "hack" allows users to "reverse" the imputation in Python and apply more advanced techniques like K-Nearest Neighbors (KNN) or LightGBM's native NA handling.

4. Application-Specific Handling

  • The Post's Claim: The "best" way to handle NAs depends on what you are doing (e.g., Regression vs. Clustering vs. Tree-based models).

  • Correctness: High. This is a fundamental principle in data science. There is no "one size fits all" for missing data; for example, XGBoost/LightGBM can learn which direction to send NAs, while linear models require explicit numerical imputation.

Summary

The post is technically sound. It correctly identifies that while P123's default handling (0.5 or 0) is "fine" for simple ranking, it introduces biases in advanced AI workflows—biases that can be mitigated by taking advantage of the data provided in P123 downloads.