How to mechanically assign a score to a ranking system

All,

We’d like to create a new metric to rate a ranking system using the output of the Ranking->Performance tool. A good ranking system should show:

  • A strong correlation between ranks and annual performance of a “bucket”
  • High delta between top ranked stocks and low ranked stocks
  • High slope of the linear regression

An exampe of a good ranking system is attached. It has the following statistics:

Slope: 0.33
Y-Intercept: -1.24
Correl: 0.96
Highest ranks return: 37.7%
Lowest ranks return: -3%

Can someone think of a way to assign a score to this ranking system based on these statistics? Can anyone think of other stats?

Another option is to rank ranking system statistics relative to each other, for ex:

Slope: higher is better
Y-Intercept : lower is better
Correl: higher is better

You could then collect the data from the runs of multiple variations of the ranking system to find the best combination. The weights of each statistic could be changed depending on what you are trying to do, for example maximize performance or best hedging system.

Thank you for your suggestions.


rankcorrel.gif

Ranking the ranking systems… that is such a basic and useful idea!

From my perspective all that should interest us in accomplishing that is for buckets to the right to be taller than buckets to their left.

I will go as far as to claim that even the magnitude of the top buckets is not very important in comparison to the non-random arrangement of the order of the buckets.
Therefore the goal becomes giving the highest scores to the least random ranking systems. Systems that orderly get taller from the left to the right. There are statistical tests that will put a number to the degree of randomness a series of numbers exhibits. We will have to research those tests or perhaps someone else here is more familiar.

I’ll give you an extreme example that should make my point clear: Suppose we had a ranking system that could (somehow) rank 8000 stocks in 8000 buckets (one-stock buckets) and each bucket was slightly taller than the one on its left. That would qualify as the ultimate and ideal ranking system as well as the least random one. A metric that measures non-randomness would detect that.

My observation about using correlation and linear regression is that it will penalize ranking systems that do not increase linearly. I think the majority of good ranking systems do not increase linearly to the right and do not fall off linearly to the left. You could have a ranking system that gets exponentially taller with every single step to the right and it will still get a bad score if we were to judge on correlation to a straight line. Using correlation to a curve other than a line would not solve our problem either because what may fit one ranking system perfectly will not fit the others.

So I think detecting “non-randomness” rather than correlation to arbitrary curve should be the goal.

dimitri

Marco,

Those are wonderful ideas!

Here’s an extension of your idea: combine the distribution in the factor area with the return buckets (i.e., for bucket 1 there are 456 stocks and the annualised return for that bucket is 37%). It is often frustrating flipping back and forth to the factor or screener to ascertain how many stocks are in a formula universe, and even more difficult to determine how many stocks are in a bucket.

If your ideas are implemented, could it then be possible to display all of those statistics for each factor or formula as a ‘tooltip’, or better yet in a work sheet/database, and have these statistics searchable as are rank systems and their component factors?

Also, it would be superb to be able to search not only factors, but formulas that are public, especially since you have indicated the potential upcoming increase in the number of factors in a separate post.

Additionally, currently if one looks at the buckets for a five year period, they are looking at the mean annual returns for each bucket. Could there also be the median and the mode or other statistics (i.e., if the 2003 return is 120% and the rest are nearer to 10%, the mean will be much higher than the median or mode or other similar calculation; basically, some measure of stability/consistency. I guess that this level of granularity would be approaching creating a single factor/formula simulation?

Thanks for all the amazing features so far; looking forward to whatever you come up with next.

Marco -

I think providing a ranking system measurement is a very good idea. But Jamie has touched on something here with regards to yearly returns that needs to be addressed. There is a fundamental problem with the ranking system performance in that some time periods have large price volatility and other time periods don’t. The high volatility periods outweigh the quiet periods. You can see this issue with most ranking systems if you set the time period from 3/31/01 to 1/1/04 and compare against 1/1/04 to present. The early years tend to dominate.

One way to improve on the situation is to normalize the outputs so that each time period contributes equally. I raised a feature request a long time ago to provide the option of ranking the %gain output similar to the inputs. In other words the %gain isn’t as important as where the %gain stands relative to the rest of the stocks in the universe. Then no particular time period would dominate.

Steve

Marco,

Steve raises the bar with another excellent point: why not allow the option of presenting the buckets either as annualised nominal returns (as they are currently) or as annualised excess returns relative to a benchmark (SP500)? (I realize the red bar is the SP, but maybe charting the buckets as excess returns would be helpful, too).

That said, it would still be interesting to have some type of Mean, Mode, Median assessment so that one period is not skewing the results. I admit, the best approach to ascertaining this is not currently apparent to me.

Another part of the ranking system metric could include some measure of market capitalisation: i.e., ‘the small cap effect’ has a great deal to do with much of the success of many of the ranking systems. Could this be displayed both in numerical form and visually? Maybe come up with colours for the various major market capitalisation buckets? Therefore, each bucket of annual returns could be divided according to its weighting of various market capitalisations. Then again, this might be overkill, but the fact is the ‘small cap effect’ is everywhere, which explains the elusive search many users have for mid- and large-cap models.

Steve,

Please feel free to correct, add, delete, if I have not interpreted your suggestion accurately.

Marco,
When measuring the Performance of a ranking system, it is very important to be able to narrow the universe to include only relevant stocks, or else you end up measuring noisy data and the results are far less useful. For example, today the only filter available is the share price (default: Price >=3 ). But that filter may still allow lots of “junk” stocks to get into the various buckets and distort the performance measure. There is no way to generate buckets and performance measure relevant for stocks we want to consider in a system, For example AvgDailyTot(20)>200000 and PEG<1.0 and so forth.

So if you are reforming the Performance function of the ranking system, please consider adding Screener functionality to it, so that only stocks that passed the Screen would be distributed into N (between 10-200) buckets and measured.

Thanks,
Z.

Marco,

You have laid the foundation for some great ideas with the ‘ranking of the ranking system’ concept. Your suggestions are on the right track. There ought to be some flexibility; i.e., like you said, sometimes one will want maximimum long performance, so a high return is paramount. Overall, though, a good ranking could be calculated using your initial suggestions as so:

Slope * Delta (H bucket - L bucket) * Correl = Metric

There ought to be a stability/robustness/consistency indicator as well, like I clumsily tried to explain: i.e., the Mean can be very misleading sometimes. Is all the performance coming in one year, for instance? The consistency factor is important (I guess this enters the realm of normal distributions and fat tails; i.e., is the attractive annualised return coming from the fat tail?)

And, Steve’s suggestion of the relative (excess) return is a good one. Maybe the buckets should also have the option for alpha returns, not simply nominal returns?

Marco,

Zvi’s suggestion is excellent: There should be either ‘radio buttons’, ‘drop-down boxes’ or better yet rows in which we can enter rules, the same way we do in the buy/sell rules of a simulation. Then we can pre-filter by liquidity, volume, price, etc. or whatever we desire, just as we would do in a simulation.

This is part of a larger issue: there needs to be ‘hard’ filters that eliminate certain stocks or impose certain criteria (sector weight, industry weight, etc.), just as in the buy/sell rules in the simulations.

Summary: add the buy/sell rules functionality from the simulation area into the ranking system area.

There are dozens of values to measure the performance of a simulation and still many users keep asking for more and more indicators.
I would focus more on defining all the indicators so that anyone can interpret them in their own way, than on one single value that would make happy only a few users.

Jamie

“Steve raises the bar with another excellent point: why not allow the option of presenting the buckets either as annualised nominal returns (as they are currently) or as annualised excess returns relative to a benchmark (SP500)? (I realize the red bar is the SP, but maybe charting the buckets as excess returns would be helpful, too).”

That is not quite what I meant. Assume you are running a ranking performance with a frequency of four weeks. For the first four weeks you rank each stock for % gain. You end up with a number between 1 and 100. The next four weeks you rank each stock for 4wk % gain and average with the first performance rank. And so on … When you are finished you end up averaging a series of ranks between 0 and 100 instead of %gains which has no bounds. When you average ranks then all time periods are equal.

I think we are both saying the same thing with regards to one period skewing the results. I was just presenting a possible solution to the problem.

Steve

Stenci,

With due respect, you stated that “There are dozens of values to measure the performance of a simulation and still many users keep asking for more and more indicators”, this topic does not concern simulations at all. This topic concerns ranking systems, for which there are not “dozens of values to measure the performance.”

I think Marco is offering an extremely valuable extension to the ranking feature, which, after all, is the fundamental basis of all of P123 and of the profitability, or lack thereof, of all of our simulations, as my simple brain understands how everything fits together. I guess one could create a simulation without a ranking system, but why would they?

Personally, I would much rather have some metrics/statistics in the ranking system area, since there are not currently any. The ones Marco suggested look extremely promising to me (slope, correlation, delta, etc.). Basicially, it all starts with the ranking system. The ranking system is what generates the profits, therefore any additional metrics of the ranking system feature is music to my ears. In simplest terms, the ranking system underpins the simulation, so to not have a few metrics on the ranking system does not make any logical sense.

I concur that there are plenty of “values to measure the performance of a simulation” and I do not think it is a priority to add to those in the simulation area, but the ranking area is a different kettle of fish, altogether.

Stenci, If I have misconstrued your post I apologise.

Hi Stittsville,

As you said, I think we are both saying the same thing.

I guess what this entire thread comes down to, still, is how to determine whether a ranking system is good or not.

It seemed to me that the method the ranking system uses is to first assess the rules which comprise the ranking. If a stock ‘stays’ in the bucket as per the rules, then whatever its return is for the time period is contributed on an equally-weighted basis to the overall performance of the bucket, as per the P123 documentation. Each bucket, theoretically, has no bounds as percent (on the positive side) does not have a boundary condition (i.e., a stock can go to infinity). If there are 200 stocks in the bucket and their average equally-weighted return is 1000% then that’s the bucket’s return.

Pure and simply: a ranking system ranks by its ranking methodology, not by anything else. Once you have all of the rank buckets lined up, then you can look at those buckets, ordered by rank, and see the annualised returns for each bucket. The average return of each bucket is the average of the equally-weighted returns of each stock in the bucket. You could then look at it and determine whether it looks good or not. What Marco is getting at is wouldn’t it be nice if there were a mechanical/automated calculation that tells us mathematically whether or not the ranking system has some validity? The alternative is to visually gaze at the buckets, make a qualiltative decision on their merits and then go create a simulation. Stenci is correct, that there are already statistics in the simulation area, but why not have a few metrics in the ranking system area and save the extra steps of taking the ranking and creating a simulation; i.e., why not first quantitatively evaluate the ranking system, just as we later quantitatively evaluate the simulation? It makes complete sense to me.

Marco’s suggestions for the basic components of the metric (individually and combined into one calculation) would be superb if implemented. From my experience, both qualitative and quantitative (non-automated, manual) the key metrics of a ranking system, and, therefore, of the profitability of a simulation are exactly the metrics Marco has suggested: (slope, correlation, delta (between H & L buckets), and as I said in a prior post, a measure of consistency/stability through time would be nice (i.e., to avoid the ‘fat tails’ and bias of mean as a metric; use mode, median, or some other measure).

Stittsville, I think you may be on to something with your suggestion/explanation, but the coffee hasn’t kicked in for me and the neurons aren’t helping me much this morning. Would you mind fleshing out your suggestion a little more?

Good thread.

While I am generally in favor of calculating the data Marco suggests, ultimately almost all of my stock selection is from buckets in the 95+, 98+, 99+ percentiles. Frankly, I don’t care if the buckets from 0-90% form a perfectly sloped steep line, because I won’t be selecting from those. Instead, I want to know how the top 0.5, 1, 2 and 5% differs from the rest of the buckets. For that reason, I like the High-Low delta idea, but I would find a High-Mean calculation more helpful and would love something like High - (Mean + 2 standard deviations).

I am not a statistics guru, but maybe what I am looking for is a measure of skewness in the buckets.

I want a system where the top 1% or 0.5% of the buckets accounts for 5-6x as much return as the mean bucket and if this results in a strange looking distribution across the rest of the buckets, then so be it.

Jamie -

I agree with everything you say. The thing that I am zeroing in on is your statement:

"and as I said in a prior post, a measure of consistency/stability through time would be nice (i.e., to avoid the ‘fat tails’ and bias of mean as a metric; use mode, median, or some other measure.

The problem with the metrics being proposed is that they only examine the final output. They have no insite into the consistency / stability through time. And therefore the metrics are not really fulfilling their purpose.

It would be too bad if P123 and Stenci came up with the perfect set of metrics and algorithms only to find out that the ultra-optimized ranking systems perform extremely well for the year 2003 but are mediocre for all other time frames.

It is acknowledged by many that the annualized return is not so important. What is important is the shape of the graph. So if we abandoned the %annualized gain it would not necessarily be the end of the world.

You are right in that the rank buckets are lined up and you can look at those buckets, ordered by rank, and see the annualized returns for each bucket. What I am saying is that when you look in a bucket you don’t have to see annualized return.

If you can imagine the path taken to get to the final result. The buckets have to be lined up for each time period, either weekly, 4 weeks, quarterly, etc. The annualized returns are accumulated for each bucket, each time period, until the program comes to the last date. Then I would presume an average is taken for all of the time periods.

Now lets re-examine the processing for one time period (1 week for example). Say that instead of stuffing the buckets with %gain for that week the S/W ranks each stock in the universe by %gain. Then stuffs the bucket. So in other words if a stock had a 200% gain over the last week it’s rank may be 99.9. A stock that had -75% gain might have a rank of 0.01. So when you look in the buckets you don’t see annualized gain but you see averaged rankings.

This process is repeated for each time interval until you hit the end date. When you finally look into the lined up buckets you will see averaged rankings, not annualized gains.

When this is done then no time period can skew the results because each time period has equal weight. The ranking system is not vulnerable to the volatility of the market.

Steve

Hi, guys. I only have a few minutes, but would like to add some thoughts. Great discussion, and good ideas.

I have submitted two feature requests relevant to the issues at hand:

  1. Allow unequal-size buckets As noted in the request, and by Bill (bl82), it’s the rightmost buckets that are of interest.
  2. Detail on ranking system performance. Here ths idea is to drill down into a bucket and see what’s in it.

Neither of those requests got much attention. Maybe it’s time to revisit them?

In one of my previous lives I was a statistician, and (although very rusty) don’t think that Regression or Correlation are appropriate to the task at hand. We’re interested instead in Discrimination, not the ability to predict accurately what the average annual gain would be for Bucket #43. That is, we want systems that are very good at picking winners, even if they can’t say much about the [irrelevant] rest of the population.

Finally, Dan Parquette’s spreadsheets address the problem of identying “good” factors & formulas, using methods similar to Marco’s suggestions. These metrics were used to build the TopFactors ranking systems. I found them to be a very useful starting point, but still missing the discriminant aspect.

Cheers, J

Jerrod -

I don’t know anything about discriminant. But the shape of the entire graph is important to me. This demonstrates consistency. If I were only interested in the far right bucket then I would probably end up with an over-optimized ranking system that may not perform in the future.

Also I don’t think that predicting future annual gain is possible. The objective (for me) is to pick stocks that outperform the rest of the universe.

Steve

[quote]
Also I don’t think that predicting future annual gain is possible.
[/quote] Steve, I used the statistician’s term for “prediction,” which has nothing to do with the future. Perhaps I should have said “estimate” rather than “predict.” Let’s try again:

Simple linear regression finds a best fit straight line:
y=ax + b, where (using Marco’s example plot)
y is the height of a bar,
x is the bar number, and
a & b are constants chosen to create the best fit.

Now a “deviation” is the difference between an observation (say, the average return in Bucket 43) from the line (the “prediction”, or 43a+b). The best fit line is the one that minimizes the sum of the squares of all the deviations. [Hence the term “least squares fit.”]

Well, that’s nice if you are equally worried about how well the line can estimate any of the calculated returns, but that’s a far cry from what we are really looking for, which is (as you agree) winners.

Just because we can regress, that doesn’t mean we should. I would be very happy with a ranking system that produces very high returns in the rightmost bar(s) and utterly random garbage elsewhere. Another word for that behavior is Discrimination, ie separating the wheat from the chaff.

More later.

Jerrod -

"Well, that’s nice if you are equally worried about how well the line can estimate any of the calculated returns, but that’s a far cry from what we are really looking for, which is (as you agree) winners.

Just because we can regress, that doesn’t mean we should. I would be very happy with a ranking system that produces very high returns in the rightmost bar(s) and utterly random garbage elsewhere. Another word for that behavior is Discrimination, ie separating the wheat from the chaff."

I guess I have to disagree on this point. Just because I will be developing a system based on upper ranked stocks to make money doesn’t mean I am not concerned with the lower ranked performance. Examining all of the buckets tells me how consistent the ranking system performs. If the lower buckets have random performance then I will run for the hills.

Steve

Steve, I understand the intuitive appeal of a system that has a perfect linear relationship between return and bucket number. But it’s an illusion.

To illustrate, let me hypothesize a simple ranking system with three equally weighted factors, x, y, z.

x occurs in 1% of the stocks, and when it does, the stock doubles within a month.

y occurs in 1% of the stocks, and when it does the stock goes belly-up.

z is the alphabetical number of the first letter in the ticker name.

I think that we can agree that the bucket chart for this ranking system will show: big upward spike in Bucket#100, big downward spike in #1, and randomness elsewhere.

This is a contrived example, but it does illustrate my point. This is a great ranking system, even though the bucket chart looks ugly except at extremes. Every stock in the top bucket (not just the average one) is a winner. That’s what we’re all looking for, isn’t it?

Marco is on the right track with his metrics:

slope

correlation

delta

It does not make much sense to me to only focus on the last bucket (however, there are exceptions, as discussed below; therefore the user ought to have flexibility in their evaluation of the Rank System). I agree that if you find a last couple of buckets that have high annual return in your backtesting, this will lead to some nice returns in your simulations. However, the key word is ‘simulations’. Unless all of the research in statistics for the past 300+ years is incorrect, there is such a concept as statistical significance: in this case it means one would want to see upward sloping, smoothly increasing buckets from left to right, with each bucket higher than the last and ideally the last bucket being really high so that the simulation looks great. Marco has proposed a mechanical evaluation of that desired scenario.

A close approximation to statistical signficance would be to look for:

increasing buckets from left to right

smoothly increasing returns from left to right

each bucket is higher than the next

Basically, Marco’s suggestion of slope, correlation and delta, together are a good approximation of statistical significance for the ranking system.

How about a happy compromise for those who only want to focus on the last bucket (i.e., the last delta; or, only the furthest right bucket vs. the bucket to its left; and therefore the ranking system has zero statistical significance and probably zero predictive ability) and those who would like to survey all of the buckets (i.e., all of the deltas; starting on the left, compare each bucket with the one previous to it; and therefore a simple, layman’s, but likely effective, approximation of statistical signifcance and more probably future preditive ability of the Ranking System)? More on this below…

Marco, et al.,

What about another delta calculation that is the sum of the deltas between each consecutive bucket? That is; instead of the delta of only the highest and the lowest bucket or the highest and the second highest bucket (some people seem to be focused only on the top bucket), why not calculate the delta between all of the consecutive buckets and take their sum or other statistical formulas? I guess this is similar to a combination of correlation and slope. If you think about it, this is basically what we do when we visually (qualitatively) look at a ranking system’s performance as displayed in the form of annual return buckets and it is statistically (quantitatively) what we do when we use various statistical metrics. Essentially, ask the question: is the last bucket high because it is a fluke that is non-repeatable, or are all of the buckets lined up one consecutively higher than the next, which would tend to indicate that the high last bucket is not a fluke (I concede there are exceptions, but these exceptions usually have a fundamental market force that makes it persistent, therefore the lone high bucket that is persistent and profitable on a forward-test basis should be the exception of a ‘Good’ Ranking System, not the rule).

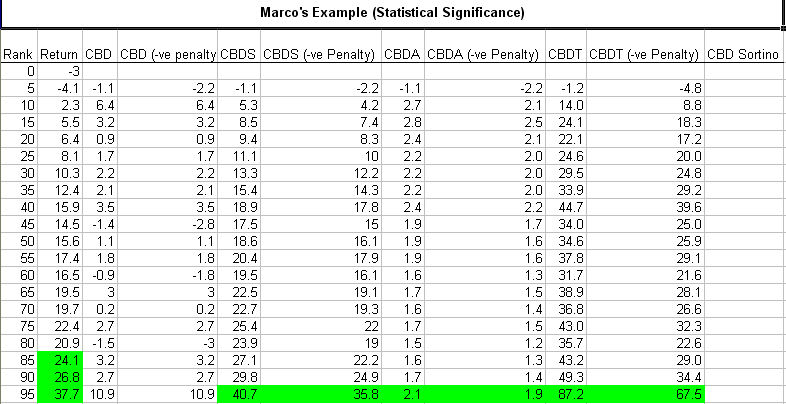
The difference between two consecutive buckets could be known as the Consecutive Bucket Delta (“CBD”). The sum of all of the CBDs could have another TLA (three letter acronym) or even a FLA (four letter acronym) ;). The ‘Consecutive Bucket Delta Sum’ (“CBDS”; or “CBD” or “CUBIDS”, not be confused with “CUBITS”). The higher the CUBIDS the better the ranking system (and the bigger is Noah’s boat). The CUBID would be calculated as follows using Marco’s example at the beginning of this topic (I have attached some PNGs and the work sheet). The calculations include a “(-ve Penalty)” for buckets that drop in value. Why? Because otherwise the buckets could go up then down up then down, etc, and then a few buckets at the end or even just two consecutively higher buckets by a large amount would skew all of the calculations. So, the (-ve Penalty) puts the Rank System in the penalty box for 2 minutes; i.e., the (-ve Penalty) multiplies the negative CBDs by 2 and is similar in flavour to the concept behind the Sortino: penalize the downside deviation not the upside deviation. (Quite frankly, the Sharpe ratio is useless IMO, not only for that reason, though; the highest Sharpe ratios are found often with systems with ridulously high turnover, and which have not properly accounted for transaction costs; and the Sharpe is dependent on the period used for calculation, etc.). The worksheet is self-explanatory if you look at the formulas. If someone has an Excel Sortino formula, maybe they could add that in. Hopefully, it does not contain errors, feel free to correct, add, etc.

Here are the acronymns (don’t shoot the messenger for trying a crude first approximation at a ranking system metric; and excuse the silly acronyms :). Instead of “(-ve Penalty)” it could just be CBD- for example.

CBD = Consecutive Bucket Delta (delta is simply the fancy math word for ‘change’)
CBD (-ve Penalty) = If the delta is negative then multiply that -ve value by 2 (Marco, this value of 2 c(sh)ould be an option for the user: for instance if you really do not care about an upward sloping bucket ranking system and are OK with a purely random, non-significant ranking system with which to trade your money, then set this value at ‘NA’ (or, ‘1’); or if you really like punishment set it to -2)
CBDS = Consecutive Bucket Delta Sum (Sum all of the CBDs moving left to right)
CBDS (-ve Penalty) = Same as the CBDS, but sum the CBD (-ve Penalty)
CBDA = CBD Average
CBDA (-ve Penalty) = Same as CBDA, but average the CBD (-ve Penalty)
CBDT = CBD Total (CBDS * CBDA); use multiplication to accentuate the quality (or lack thereof) of the Ranking System
CBDT (-ve Penalty) = Same as CBD Total, but with the (-ve Penalty): (CBDS (-ve Penalty)) * (CBDA (-ve Penalty))

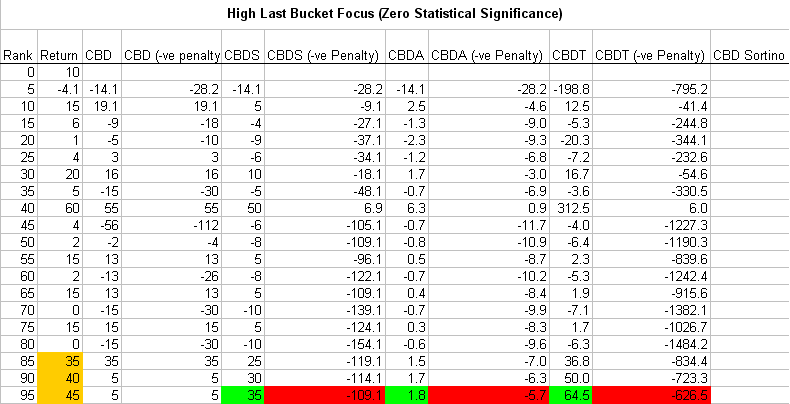
The two screen shots show a ‘Good’ Ranking System and a ‘Bad’ Ranking System.

Green means good. Gold means really good; that is, at first glance the three consecutive high buckets in the ‘Bad’ Ranking System look very appealing: it’s gold!

Which is why the negative penalty is introduced: a random system that does not show any statistical significance (i.e., not having some or all of the qualitative factors we discussed already: upward sloping consecutive buckets, etc.; or the quantitative factors: slope, correlation, the delta, and the CBD family of statistics) should be eliminated (at the user’s discretion, of course, based on their prior settings for how they wish their Ranking Systems to be evaluated).

To reiterate, it is best that the user retains flexibility: they must have the option of choosing/customising how they want their Rank systems evaluated. Therefore, the user could rank by ‘High Last Two Buckets’ or something like the CBD concept: whatever floats your boat. I do concede that sometimes there are buckets at the extremes that probably do have statistical signifcance, but usually one would want a Ranking System that has a high CBDT (-ve Penalty).

As with all good products and services, especially software, the ability for the user to customise their ‘experience’ is paramount. We could debate what makes a good Ranking System for eternity, but a few tools like slope, correlation, delta, CBD Family, and high last few buckets, would give ample flexibility for every user.

Lastly, I left the CBD Sortino blank for anyone who has an Excel Sortino formula.


P123 Ranking Metric.xls (27 KB)