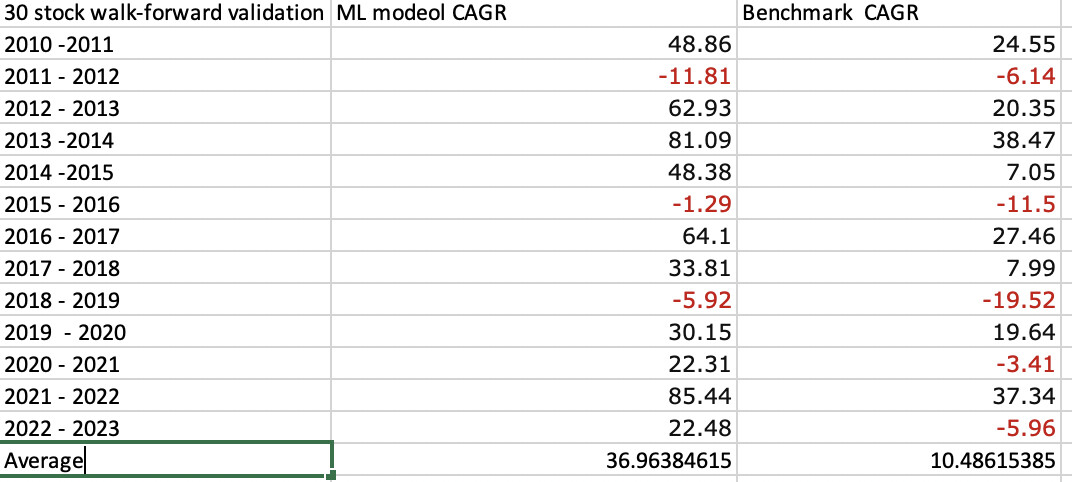
I took 69 factors—many BS noise factors and some good—and selected some of them using a simple algorithm from Jan 1, 2000 to Jan. 1 2010. I then used a simple ML algorithm, trained on the data and just for the fun of it bootstrapped it (or Bagged it meaning bootstrap aggregating) 100 times. Then tested this out-of-sample 2010 - 2011. It took maybe 40 seconds to run in Jupyter Notebooks with a Mac Laptop (with the 100 bootstraps). I then walked this forward selecting new factors, training 2000 - 2011 and testing 2011 - 2012,……Selecting new factors, training 2000 - 2022 and testing 2022 - 2023. Results:
I will say a backtest training 2000 - 2023 and then testing 2000 -2023 does do a quite a bit better. But I think I will stick with this validation method myself. Also, not bad compared to out-of-sample results for some of the designer models.
To the best of my knowledge this is the first complete validation starting from scratch with feature selection of what @Marco has been working on. I hope it gets the attention it deserves from present members and serves to attract new members when released.
I am also seeing some results with Bayesian optimization on a large number of factors. I have been comparing the performance to an equal weighted portfolio of all of the factors I am optimizing on. Out of curiosity what is your ML model to equal weighted linear model “alpha”? I think this is a good metric to determine if the ML or optimization model is worth investing in compared to the simpler linear equal weighted version. Or some other non-optimized base version.
For example I see out of optimization “alpha” around -5% to 10% depending on the base factors. But, it is unfortunately showing some systematic performance inconsistencies (like the first 5 years out of sample are a negative alpha and the next 5 years do really well). And not a lot of stability if I vary the initial inputs.
Either way I am also excited for the Portfolio123 release! I am starting to run into a wall with the quality of my code limiting my confidence level of my methods.
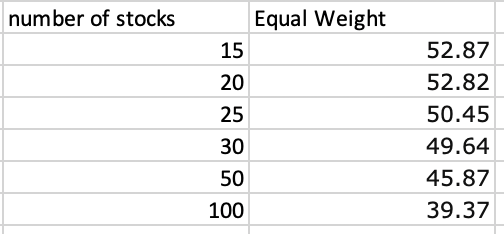
Here is equal weight using k-fold validation and a 3-year embargo period:
This is not equal weight but qualifies as “Or some other non-optimized base version” which was in your question.
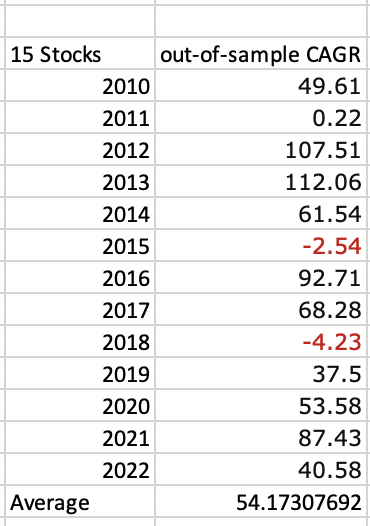
I think this really gets as you question though. I started with 2010 AND SELECTED FACTORS BASED ON A SIMPLE ALGORITHM THAT I COULD WRITE DOWN. Then I used a simple machine learing method that probably qualifies as a “non-optimized base version.” I then tested it on 2011. I then repeated this by selecting factors 2000 - 2011, trained using the same simple ML algorithm and tested 2011 - 2012……
I am sure you recognize this as time-series validation which you have preferred in your previous posts, I think. I find it significant in that it is time-series validation without look-ahead bias for feature selection. Anyway, I am thinking you might be interested in this:
I think validation has 2 meanings here. Yes a machine learning validation for sure. But also a validation of what you are doing in that it is real evidence that machine learning works without the benefit of look-ahead bias in feature selection.
Granted, this is not a hold-out test set but the rules are simple and it has not gone through a lot of optimizations (not a large multiple comparison problem). The rules are simple and make sense. Maybe to the point of saying I have held to the principle of Occam’s Razor here.
It makes me think about this extract (below) from another research paper.
Regards
James
Utilizing Machine Learning for Non-Linear Regression
Machine learning (ML) methods have proven useful in many applications for analyzing a full feature set, and so to it is evaluated here in terms of predicting OOS Sharpe ratio performance.
We next asked if non-linear regression methods trained on the full feature set could do better at predicting OOS Sharpe ratio performance. Towards this goal, we explored a number of machine learning techniques, including Random Forest and Gradient Boosting, to predict OOS Sharpe. To avoid overfitting, all experiments used a 5-fold cross-validation during hyperparameter optimization and a 20% hold-out set to evaluate performance.
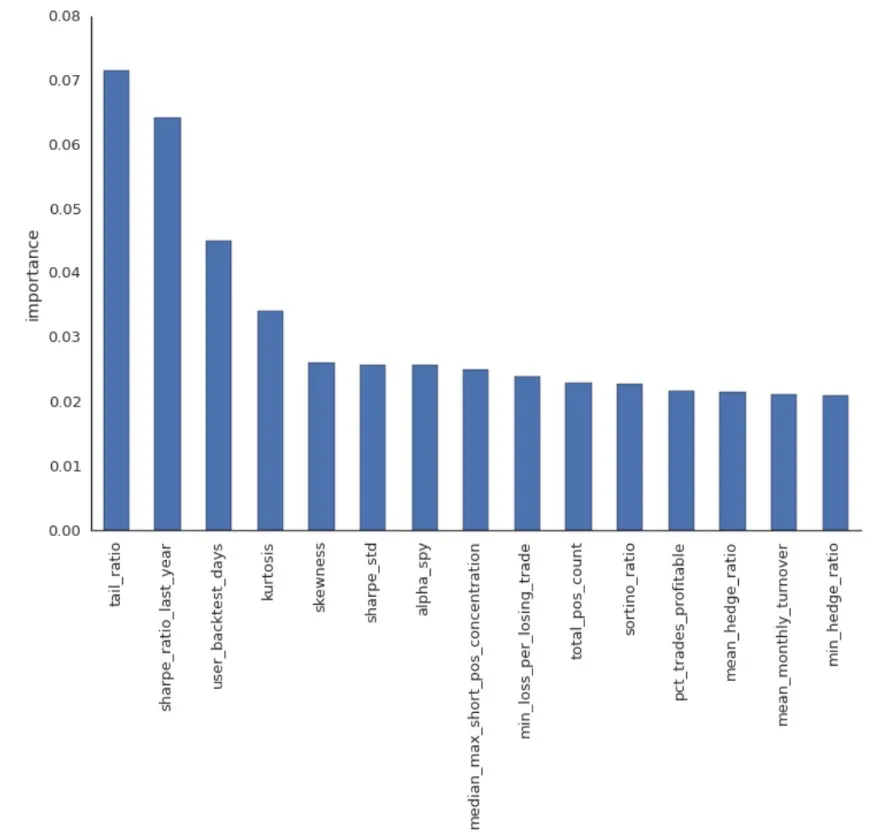
Utilizing a Random Forest Regressor as a portfolio selection tool, the machine learning method performance was measured by having it compute the OOS cumulative return and Sharpe ratios for equal-weighted portfolios of 10 strategies, chosen by having the highest predicted Sharpe ratios on the hold-out set by the random forest regressor. This is then compared to 1000 random portfolios, and a portfolio formed by strictly selecting strategies with the 10 highest IS Sharpe ratios.
The results are surprising, as the ranking of portfolios by the predicted Sharpe ratios perform better than 99% of randomly selected portfolios with an overall Sharpe ratio of 1.8, compared to the IS Sharpe ratio which performed better than 92.16% of the randomly selected portfolios with a lower Sharpe ratio of 0.7. The authors note that although the IS Sharpe ratio performs reasonably well but not at a statistically significant threshold compared to the random portfolios, it nonetheless speaks well for the value of non-linear ML techniques when constructing portfolios of trading algorithms.
The Random Forest Regressor indicates above the most predictive features. It is important to note that a few of the most important features are higher-order moments (skew, kurtosis, tail ratio), which may suggest that predictive information may be extracted in a non-linear and multivariate way.
So I think this would be an example of what is called “stacking.” Stacking is where you use a machine learning model with inputs of other machine learning models to make predictions.
–Jim (aka “The Grocer” because I bag and stack so much). Bagging being a reference to Bootstrap AGGregating. Truth is I bag a lot but have not done that much stacking and do not have that much to add to this excellent reference about stacking. I do bootstrap my present model as do most random forest models. Thank you!!!
We are getting oh so close to our beta launch for AI/ML.
Given the complexity of the field, and our newness to it, we are pivoting to two new products for ML:
Make it easy, all web-based.
Make it easy for users that want to do ML outside P123
#1 we’ve been working on it for 2 years. It’s very time consuming since it involves a front end and powerful backend.
#2 is the new pivot. It’s just a set of tools to download normalized features (no data license required) for easy consumption in Jupyter. And ways to easily import model predictions. Different normalization options will be offered for the download together with handy ways to manage datasets. This will actually be our first release sometime this week or next at the latest.
FYI. perhaps #1 will appear a letdown for the readers of this thread as far as sophistication, specially in the area of cross validation. But it’s just v1.0 and we will improve with your help.
So I have been thinking about this before your question.
If it is one or the other I think #2. I think #2 makes more sense now in November 2023 than it did when you started. ChatGPT being there to help modest to poor programmers like me and the increased use of parallel processors in modern computers. In summary, it can be done at home in Jupyter Notebooks now.
That having been said, was I hoping for both #1 and #2. With that I might cross-validate a random forest model with a download and then run a random forest model that P123 provided with option #1 for daily rebalance. Cross-validation within P123 would not be necessary for this to work for me.
Just my thoughts. I will take either with #2 being best if I had to pick just one.
BTW, have you considered letting people “pickle their models” and upload them for you to run within P123 (or Colab)? Saves your processing power for the training portion.
@Jrinne
Actually, you can now cross-validate some simple ML algorithm now. I assume that you want to infer the predictions from the ML algo inside p123 screener, run backtest (see beautiful equity curve), and later run screen when you want to get current positions.
For example multiple regression decision trees (DR) can be trained locally and the best preforming rule of each DRs (with highest average return) at the leaf node can be saved as a formula and used in a screener using 'OR' such as $BestRuleDR1 OR $BestRuleDR2 Or $BestRuleDR3 to filter out stocks. You can bootstrap your sample to get different 'best rules'.
Even better you can infer predictions from a shallow Neural Network (MLP), which is a collection of linear equations and activation functions. Then parse the whole equation as a string from your NN and save it as a custom formula to be used as a standalone ranking or one of your feature.
This solution sounds really cool. Can be memory expensive but would save some tedious work described above.
This may sound complex to some readers. But random forests (and decision trees) are the most basic and simple code possible. Ultimately just a series of if, else code if you have ever looked at a predictor (pickled and ready for use or upload).
Every bit of this can be parsed by any programmer. Do not let me or anyone else convince you that this is hard.
For Rank we normalize from 1.0 to 0.0 every period (group by date) N/A’s get 0.5
For Normal we let you choose the scope for calculating the distribution, either every period entire dataset or training period only. You can specify a trim % to trim out crazy numbers before hand. And we let you specify the sigma limit. Basically it’s the same as the current ZScore function with the option to scope it using the entire dataset.
For MinMax we’re still deciding some of the details. The main use case is to just transform the data to a scale from 1.0 - 0.0 but maintaining the outliers (we will have to use scientific notation) so that you can do your own thing outside of P123 w/o needing the raw data (which requires a license)
Hope I’m understanding this correctly. For Rank, P123 will stick to evenly distributing rank values over the range [0,1] irregardless of the underlying factor values instead of a distribution that’s proportional to factor values. Right?
Normally the predictions would be made in a Jupyter notebook from the downloads on a P123 member’s computer (or Colab, maybe Amazon AWS for a few). We will be able to import our predictions into P123? Maybe P123 will rank the predictions for rebalance? Not sure that is what you meant. But that would be a cool bonus!!!
For rebalance with overnight data for days other than Monday initially?
Also, so that will replace DataMiner downloads for machine learners perhaps? Limits, fees? End of concern about API credits for some?
Nice no matter what the details turn out to be and I am happy to wait for the release for the details.
BTW, thank you. You and Dan said you were considering this feature request. I never hoped it would be this soon. It should please any machine learner already using Jupyter notebooks for machine learning and most programs should run on home computers I think. My MacBook is up to most tasks anyway (e.g., random forest and boosting).
You can do that now with Imported Stock Factors but could be more user friendly. Also there are some things to be aware of (for example imported values never expire and are carried forward if you don't update a particular stock).
Right. It's the standard Rank function in python. We're thinking of doing a couple of versions that behave slightly different with NAs which might have an impact for factors that have lots of NAs (PE for example, or dividend related ratios)