When the VIX is in backwardation it may be a good indicator to be out of the market. Another way to use the contango data is to use it as an indicator when to buy an inverse VIX fund. Some of the inverse VIX ETNs were up more than 50% for the past two years in a row.
Chaim,
This is absolutely true, as you know. Buying XIV when the VIX is high, and the VIX futures have moved from backwardation back into contango is an excellent strategy. I have used CBOE.com. I do not know of a way to do it with P123.
Anyone who has not tried this: this is a high risk strategy in the short run. You could loose 75% or more in a very short time. Long term is likely to do well due to the “roll yield” from contango.
Jim, ZIV (which is longer term) did pretty well too with much less volatility.
These products are a way for us to get into the insurance business legally. It can be profitable most of the time (in this case very profitable) but if you’re in the insurance business long enough then you will find that anything that could happen will happen sooner or later (to paraphrase Warren Buffett). To sell insurance successfully you have to understand probability very well and limit your risk very carefully. You manage risk by limiting position size, but more importantly by keeping enough money in uncorrelated assets (such as cash) to have available to cover the eventual losses. You also try to minimize the risk by not selling during high risk situations (in this case when the VIX is in backwardation and/or some other indicators that show elevated risk levels). It is important to model expected (and unexpected) scenarios. This is where P123 can come in.
My initial reaction to selling VIX insurance was that it’s too much correlated to the stock market to make sense for me, but two things have recently made me decide to take second look. I recently came across two unrelated strategies that seemed to be successful at limiting it’s risk. I also realized how profitable this strategy can be during good times and long-term (perhaps precisely because few are willing and/or able to get into this business.)
One example of a strategy that seems to have done well even during the drawdown period is Catalyst Hedged Futures Strategy (Ticker: HFXAX). From their website:
[quote]
INVESTMENT STRATEGY
Capital appreciation and capital preservation in all market conditions, with low volatility and low correlation to the U.S. equity market.The Fund invests primarily in long and short call and put options on US Stock Index futures contracts. Cash and cash equivalents, including high-quality short-term fixed income securities such as U.S. Treasury securities are used to collateralize the futures options positions.The Fund seeks to achieve its investment objective by buying and selling options and option spreads on stock index futures. The Fund seeks to profit in three ways: (1) premium collection - this technique yields profits as sold options’ value declines over time. Profit may be captured if sold options are repurchased at a reduced value, or when they expire worthless, allowing retention of the original sales proceeds; (2) volatility trading – market prices of options are highly dependent on anticipated volatility of the underlying stock indexes. The Fund may enter options positions designed to hedge or seek to profit from either an increase or a decrease in stock index volatility; and (3) trend following – under certain conditions, the Fund may enter options spreads in an attempt to profit from an established price trend. However, in general, the strategy does not depend on a prediction of equity market direction, and is designed to produce returns that are not correlated with equity market returns.
[/quote] I’m not 100% sure what these strategies are but I would like to try to see if I can replicate something similar.
Yes. There is a lot of potential there and any tool to learn how to manage the risk would be helpful.
As you know one can end up buying and holding for a long period. ETNs profits can be taxed as long term capital gains last time I checked.
Chaim, as you know there are actually no underlying securities in an ETN. So in XIV’s case there is some risk the Credit Suisse can default right when one is buying: bad market times.
I could not imagine putting more than 5% of my portfolio in this. If anyone is looking at this XIV is not just the inverse of VIX and Chaim’s points about Contango are important. Buying on the dips (while the VIX futures are in backwardation) would be a losing strategy.
BTW, I when I look at the chart of XIV, there seem to be huge volume spikes right at the bottom. Someone really knows how to play this and when to buy.
The default risk can be mitigated by buying the futures directly.
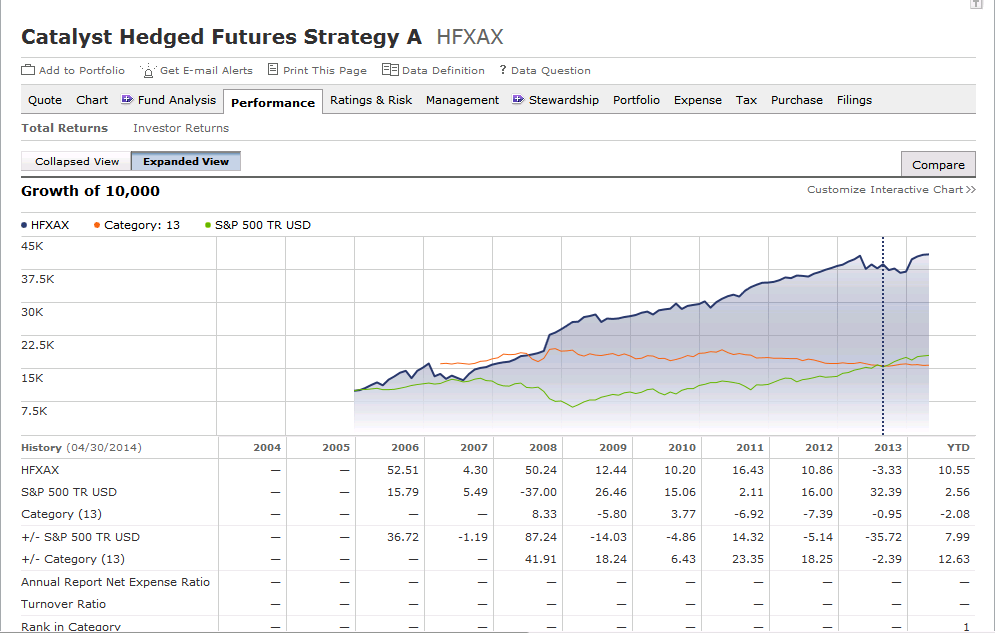
Wow! There is money being made and not much drawdown.
Exactly. Note that profiting from the contango is just one of the three strategies listed for this fund. It is not clear to me what the others are and how it avoided the drawdown in 08. I would have thought that selling volatility in 2008 would have led to a huge drawdown. Is it because they have a reliable system telling them when to get out of the contango trade? Do they buy volatility when the market is in backwardation? Is it because they were just lucky? (This place seems to be trying a whole bunch of innovative strategies, probably hoping to be successful with some of them). This could mean that they were just throwing a bunch of spaghetti at the wall hoping that something will stick. (See that dashed line? I think that’s when they switched over to a mutual fund) Maybe they are on to something. Maybe something stuck. I would like to find out how they’ve been doing it.
Chipper - this is just standard options strategies. I’m not sure why you are attributing this to VIX contango. Any options analysis software will show you what happens with increasing or decreasing implied volatility for any options spread position. And with good s/w you can see historical implied volatility and adjust positions for what you expect future volatility to be.
Steve
Hi Steve,
They made more that 18%/year since inception in 2005. From what I understand, most options strategies didn’t do nearly as well–especially during 2008. To quote from the website [quote]
The Fund seeks to profit in three ways: (1) premium collection - this technique yields profits as sold options’ value declines over time…
[/quote] If you know of other options strategies that work so well during bull and bear markets then by all means please let us know.
Chipper,
I haven’t looked at the fund that you mentioned yet, but you are correct that they have done very well for both a) option strat’s and b) managed futures.
One of the best, longest lived option strat’s out there is LJM. They are a very good firm (20 year or so history with 20% plus AR). They had significant losses in 2008. Many, many option funds blew up completely in the tech bubble and then many more in 2008. 80% or more DD’s were common.
Most also really struggle in strong bull markets with low vol.
Option funds always have great 2-5 year runs…and attract assets until vol. spikes. Then, most go under. This was my very first experience in alternatives. I doubled my money in a year and then lost 100% of it. Luckily it wasn’t a huge investment.
Most managed futures firms have had very rough years since 2010 or so.
I know a few option strategies that have done well (for instance Parallax)…over 10 years or more. They are rare. Nearly all involve proprietary directional underlying index movement and - ‘band’ prediction models that predict market ranges over various time periods…and adjust position sizes based on these proprietary predictions on a) market movements and b) forecast volatility. They are fairly complex. Much more so that you could do with a ‘canned’ option system on Think or Swim or whatever you can get as a retail investor.
Having said that…I trade some XIV strat’s (selling leveraged ETF’s). But…I don’t put much in. I know some of the people doing this professionally and they are much better at it than I could be (one has a PhD from Harvard in Rocket science and 5 years at a top hedge fund as a successful trader…then 4 more years running his own fund)…Maybe I could do it…if I put in years at it. Maybe.
I’d have to dig more…but the fund you posted has done very well over this time range compared to many of the best names in this field.
However…a) they might have launched a dozen funds and closed the rest…and b) they likely have very high embedded fees that might erode all profits.
Best,
Tom
Tom I agree, it is difficult to know for sure if their strategy is a good one or if they were simply lucky. If we would know more about their strategy (and risk control) then it may help us answer the question.
Going back to the topic of this thread, if there would be a way to measure the level of contango (such as by having available the VIX level and it’s less famous brothers such as the VXV index) and have backfilled VIX ETNs going back to 2004 then we may be able to come up with a viable strategy to complement the rest of our portfolio while carefully limiting the risk. Please vote in favor of this feature request.
Chipper/Tom - Many option strategies are very appealing because they have a very high probability of success. BUT they may also have unlimited risk in extreme situations. This is why they tend to blow up at some point in time. However a well managed fund with a lot of capital diversified across a range of strategies and effectively delta-neutral could possibly do well in adverse situations. In any case they may not be strictly focused on equity futures. Commodities (gold, oil in particular) may have performed quite differently than the stock market in 2008/2009.
Steve
Chipper,
I work with volatility a little bit, for clients and myself.
As to your feature request this is a real job. Backfilling these ETF is difficult, since they are complex instruments. I’d be very surprise if your feature request comes through. You may have to do the job yourself.
The way to figure out the shape of the futures curve is to compare front and back months futures. VIX/VXV will do the job also. All this data is retrievable from the CBOE website, all you need is a little programming and a server to run your algo on a daily basis. Or you can create a little windows program and automate it with Task scheduler.
If it’s really important I can build such a program for you, just e-mail me your needs and we’ll try to figure something out.
Aurelaurel,
You’re right, programming it from CBOE site is best.
But…A simple feature request to add the two VIX data series from CBOE site on these would likely do the trick. If there are no data license issues. I thought I had posted something on this in 2010, but not sure.
Or, if just want a spot value, can just go to a site like:
http://vixcentral.com/
But…that won’t help with backtesting.
There are some created synthetic backfilled ETF data series on some various sites around the web along with papers on VIX ETF trading strat’s. Many papers in fact.
Best,
Tom
I had commented on an existing feature request out there for adding VXV a couple of months back:
https://www.portfolio123.com/mvnforum/viewthread_thread,7023#35085
Tom C
@Tomyani,
I wish I remembered where but you can retrieve a reconstructed VXX data series off Google. The guy did it from VIX futures, I doublechecked it and it was very accurate.(I lost the spreadsheet in the move from Paris)
What strategy do you want to backtest ? there are not that many anyway, if I’ve done it already I’ll send you the results.
Michael Stokes at MarketSci had done a reconstructed VXX series - I’ve used it in my own backtesting.
http://marketsci.wordpress.com/2012/04/18/free-historical-vxx-data/
For those newer to volatility trading there are some really good blogs out there if you are looking to learn more:
http://vixandmore.blogspot.com/2014/01/performance-of-vix-etps-in-2013.html
You can approximate what you are looking for using related instruments that P123 does support. See here for some options to try out: http://vixandmore.blogspot.com/2014/01/performance-of-vix-etps-in-2013.html?_sm_au_=iVVNqMRQHtQ5nnNj