New Factors! SUE (Standardized Unexpected Earnings) and more

Dear All,

we just released many new factors related to Standardized Unexpected Earnings (SUE) mentioned in this post by @WalterW. General formula for Standardized Unexpected factors is

SU = (ACTUAL - ESTIMATE) / STDDEV

More in depth documentation is coming. Please note that Standardized Unexpected Sales (SUS) doesn’t really exist in literature (as far as we can tell) but seems to help in rankings.

The new factors are all in the ESTIMATES section. They are:

SUEQ1 SUEQ2 SUEQ3 SUEQ4 
SUEY1 SUEY2 SUEY3 SUEY4
SUSQ1 SUSQ2 SUSQ3 SUSQ4
SUSY1 SUSY2 SUSY3 SUSY4

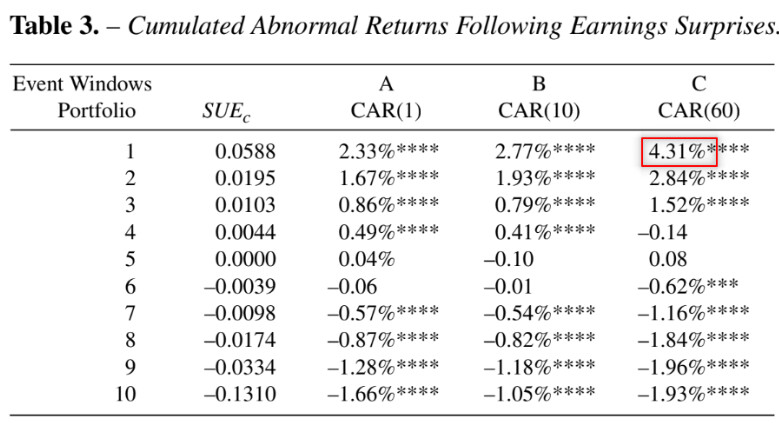
Return SUE / SUS for the previous 4 Interims (Quarters or Semi Annuals) and 4 Years. We constrain prebuilt factors to -10 to +10 since values outside this range do not seem to correlate to additional predictive power. Values below and above are set to -10 and 10 respectively.

The new functions are

EPSSUE(offset,type [,constraint]) 
SalesSUS(offset,type [,constraint])

Return SUE / SUS for the period. For example EPSSUE(0,QTR) is equivalent to SUEQ1. Constraint parameter defaults to 0, which means no constraint is applied.

EPSHistEstSD(offset,type)  
SalesHistEstSD(offset,type)

Returns the standard deviation of the estimates for past periods. This is the last value before the announcement.

EPSHistEstCnt(offset, type)
SalesHistEstCnt(offset,type)

Returns the number of estimates for past periods. This is the last value before the announcement.

ConsEstStdDev(cons_item [, period, weekAgo])

This function is unrelated to the above, it was missing (an oversight) from ESTIMATE FUNCTIONS. It returns the SD for upcoming period.

Let us know what you think

Thanks!

1 Like

Very nice, Marco! I will try them today. Thanks!
Walter

Interesting. What are the choices for the “constraint” parameter?

Example 7.5 constrains output to -7.5 to +7.5

Which is also equivalent to Bound(SalesSUS(offset,type), -7.5, 7.5)

The naming seems a bit redundant;

EPSSUE = EPS Standardized Unexpected Earnings
SalesSUS = Sales Standardized Unexpected Sales

Not big deal. As was said before, naming is hard.

Don’t know what I was thinking. Perhaps it helps with search ?

SUE & SUS are indeed short , but they do not conflict with anything else . Should be an easy change.

While we’re at it;

EPSHistEstSD(offset,type)
SalesHistEstSD(offset,type)

Look out of place compared to EPSEst() and SalesEst(). Dropping the “Hist” part looks better to me.

EPSEstSD(offset,type)
SalesEstSD(offset,type)

What do you think?

Walter

Just something to keep in mind: stocks with only one analyst at the time of the actual will return NA for the corresponding SUE factor, since the standard deviation of the analysts will be zero.

Actually to me it’s EPSEst & SalesEST that are confusing. It’s not clear that they refer to the past compared to others. For example

EPSEst(0,QTR) is the last consensus EPS mean before the announcement was made. It is set once and never changes

ConsEstMean(#EPSQ,0) is the consensus estimate for the current quarter and has not happened yet. The value can keep changing until the earnings are announced.

If we change EPSEst to EPSHistEst(0,QTR) it would be clearer

1 Like

That works, too. From my point of view, EPSEst() and SalesEst() were already established. Adding ‘Hist’ to emphasize that they refer to historical data is good.

Walter

I added documentation for SUE & SUS in the reference.

I also summarized some of the results of a 2006 study by Kaestner 2006,
Anomalous Price Behavior Following Earnings Surprises: Does Representativeness Cause Overreaction? (417.8 KB). Original paper is here

The study shows that a positive correlation between SUE values with returns 60 days after the announcement. For example it shows that Portfolio 1, made up of stocks in the top SUE decile (for the most recent quarter) shows a 4.31% abnormal return 60 days after the announcement

However the paper also shows that investors extrapolate the information too far into the future such that a series of past similar surprises causes an overreaction phenomenon. This overreaction drives stock prices below their fundamental value after a series of negative surprises and above their fundamental value after a series of positive surprises.

This effect is shown in Table 6 where the highest return of 4.64% after 60 days of the announcement, occurs for Portfolio 1 following a negative surprise (row labelled “1,-”).

It also shows that the worst 60 day return of -1.97% for Portfolio 1 when made up of stocks that had 4 prior positive surprises (row labelled "1,++++ "). In other words the effect of a positive surprise diminishes to the point of being inversely proportional the longer the positive trend continues.

It doesn’t seem like the new factor names (SUEQ1, etc) work yet via the API:

p123api.client.ClientException: API request failed: ERROR: In 'Factor'. Invalid value (SUEQ1)! (on line 3)

The underlying functions, EPSSUE/SalesSUS, work fine however.