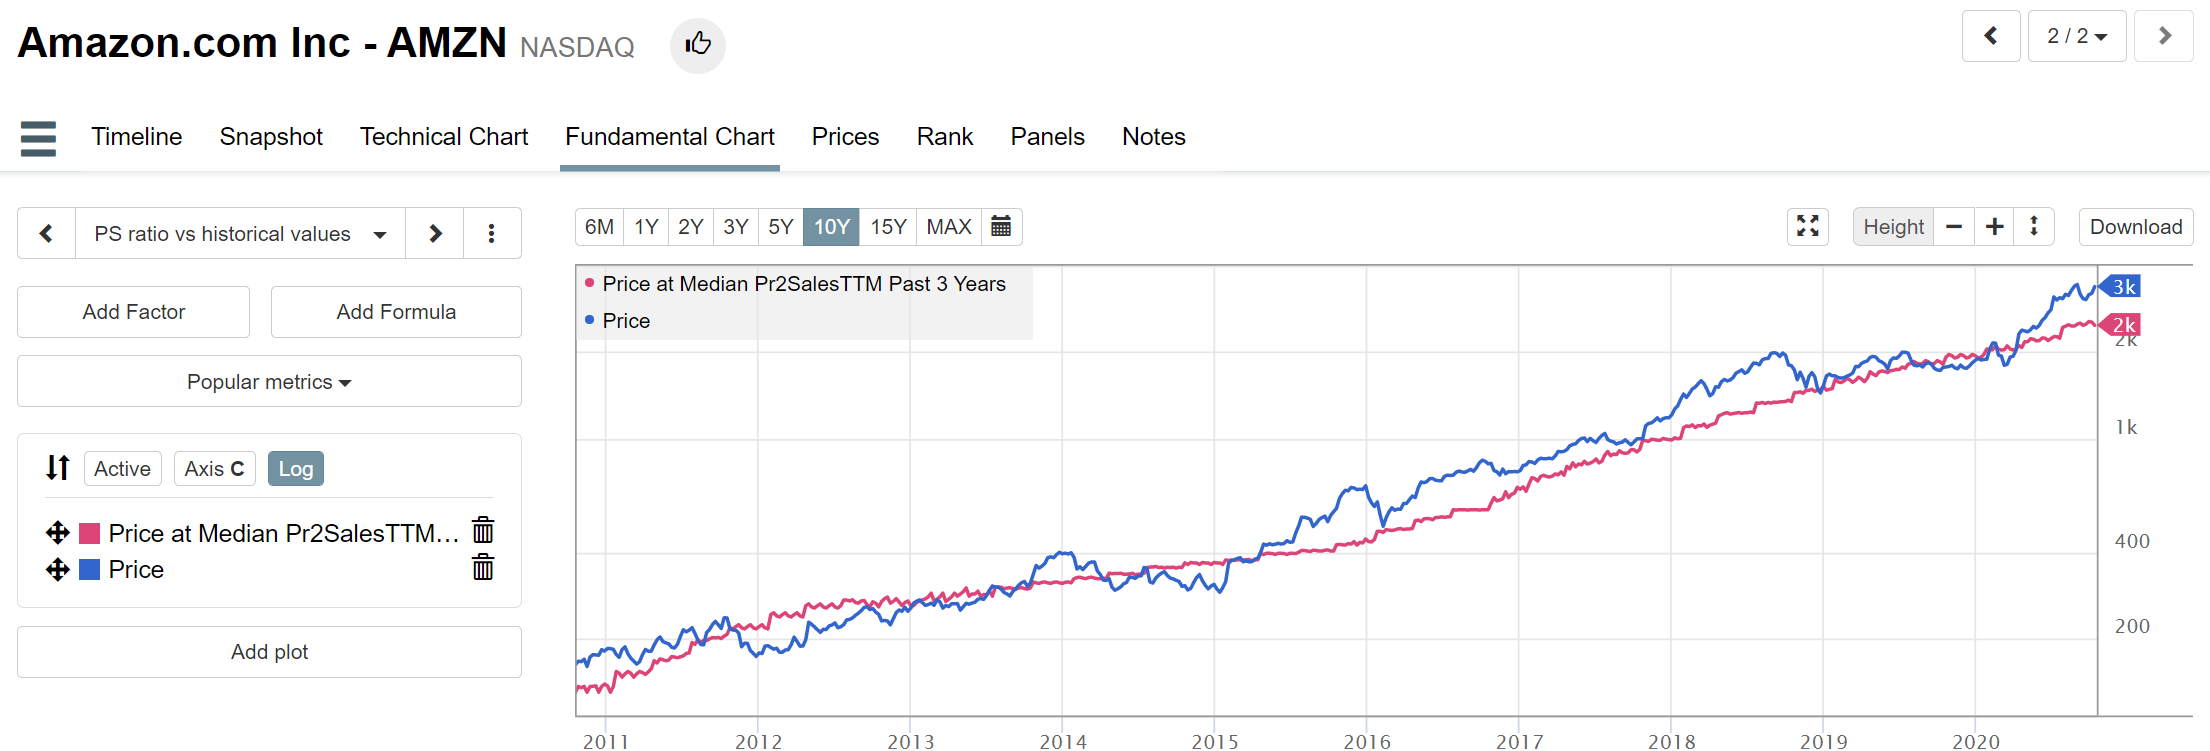
Walter , shoot you right! Your median is actually way more generous. With my median in the numerator I get about $2000 “fair value”, so it’s 50% over it’s historical median. Guess that’s the covid effect. I’m not selling
Steve when you hover over you will see the values. But we’ll see what we can do.
re. bundles, not sure what you mean. With the new plots feature you can have 10 plots if you like. Either tiny ones or you scroll down to see them. We’ll also add a feature to have two columns of charts.
Also, I’ve found that, depending on how the calculation is made, dividend paying stocks can plot differently. Plotting SalesPSTTM*Pr2SalesMedian
has the same endpoint but the historic values are different for some stocks. Check AMZN and MO.
Walter
PS - plot TSLA, too. Its adjusted price is less than $100!
Marco - so I use fundamental charts in Seeking Alpha articles. (It’s publicity for you). The 4k would be shown on the copy/pasted chart but the hover-over values wouldn’t.
By bundles, I mean a user predefined study. That way, you just call up a study and all of the plots come up simultaneously, instead of having to select each individually. It is not a big deal for most people, I’m sure. It would make life easier for me. As for multiple but separate charts… It isn’t great for me as I want the full-size, not squished charts for articles so I end up deleting all but one. I am constantly deleting and reselecting charts. I can work with what I have, but it is (gosh) work.
Steve, the new charts can be easily made as tall as you want , and each plot height can be controlled individually. So you can have a really long page and just scroll down. You have left right arrows by the layouts. Isn’t that enough to scroll? Not sure how you can have everything. You want full charts and all layouts ?
Marco - If I can adjust the chart size then that will probably do. The only thing is with regards to multiple plots. You have shown some pretty nice applications but my problem is that it takes a long time to set them up. It would be nice to be able to save the set of plots as a ‘study’ and recall later. Have the ability to store a few studies. You would just click on a button labeled “Study 1” and all of the plots associated with that study would come up for whatever stock you are examining. If that feature doesn’t happen then there probably won’t be much use for multiple plots on a chart in my estimation, at least I won’t be using them. But I appreciate the effort you are making to improve the charts.
Marco, that’s very powerful!
I like that we can plot expressions including aggregate series, custom formulas and even FOrder!
However it seems it doesn’t accept the Rating function to plot ranks (I get this error: Rating(“Basic: Growth”) is not valid)
Ranks can already be plotted in the Rank panel, but it might be interesting to have Rating() available here. To be honest, I don’t need it, I was just testing.
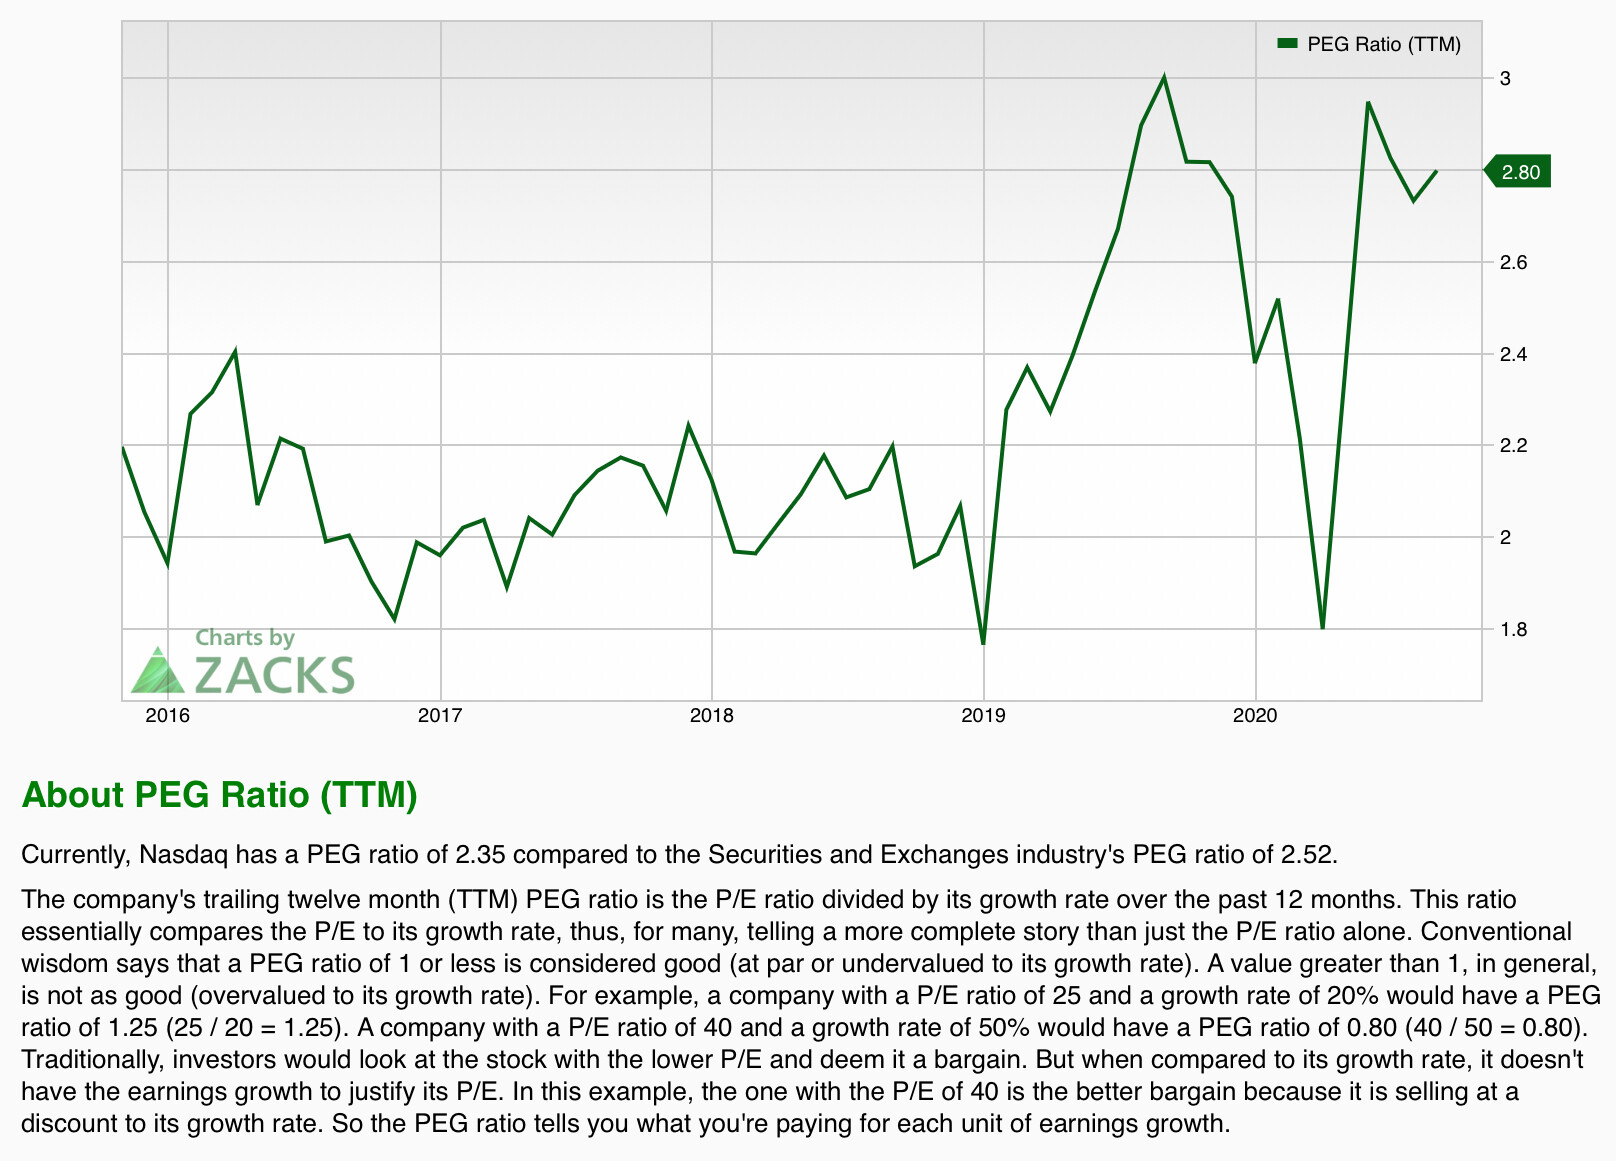
Those are NA’s. The previous version just drew a straight line between the valid data points so it was not as apparent. PEG using LTGrowth can be very bad with NA’s , specially with few analysts. But PEG using short term growth is also very volatile, and often looks crazy. (I’ve personally abandoned PEGs in my analysis)
Is there a way you can reinstate that feature? Very often there is only 1 missing data point for some financial statement items and it looks kinda silly. I liked that the old version would draw a straight line between valid data points. Thanks