The use of technical analysis

Yuval, a lot come from the US Trading Championships

https://twitter.com/Trader_mcaruso
https://twitter.com/markminervini

Also hints from my Trader Network:

Stockbee
https://twitter.com/Qullamaggie

I know there is a big discussion for example if https://twitter.com/markminervini is legit and the big question on why those traders sell services
or teach for no fee (https://twitter.com/Qullamaggie) when they are vastly profitable (beeing full time by my self, I can agree, that there are good
reasons for beeing profitable and having a service at the same time (especially connecting with people, its a very lonly business otherwise).

Not going into that discussion, everybody has to find out by themselfes and of cause I can never be sure 100%.

What I saw conviced me, especially when I mapped the frameworks of those traders to newer academic reasearch.

1 Like

Here is a site and programmer/trader that interests me: https://etfoptimize.com

I think Chris has alway had a point in the forum. I take his comments/suggestions seriously.

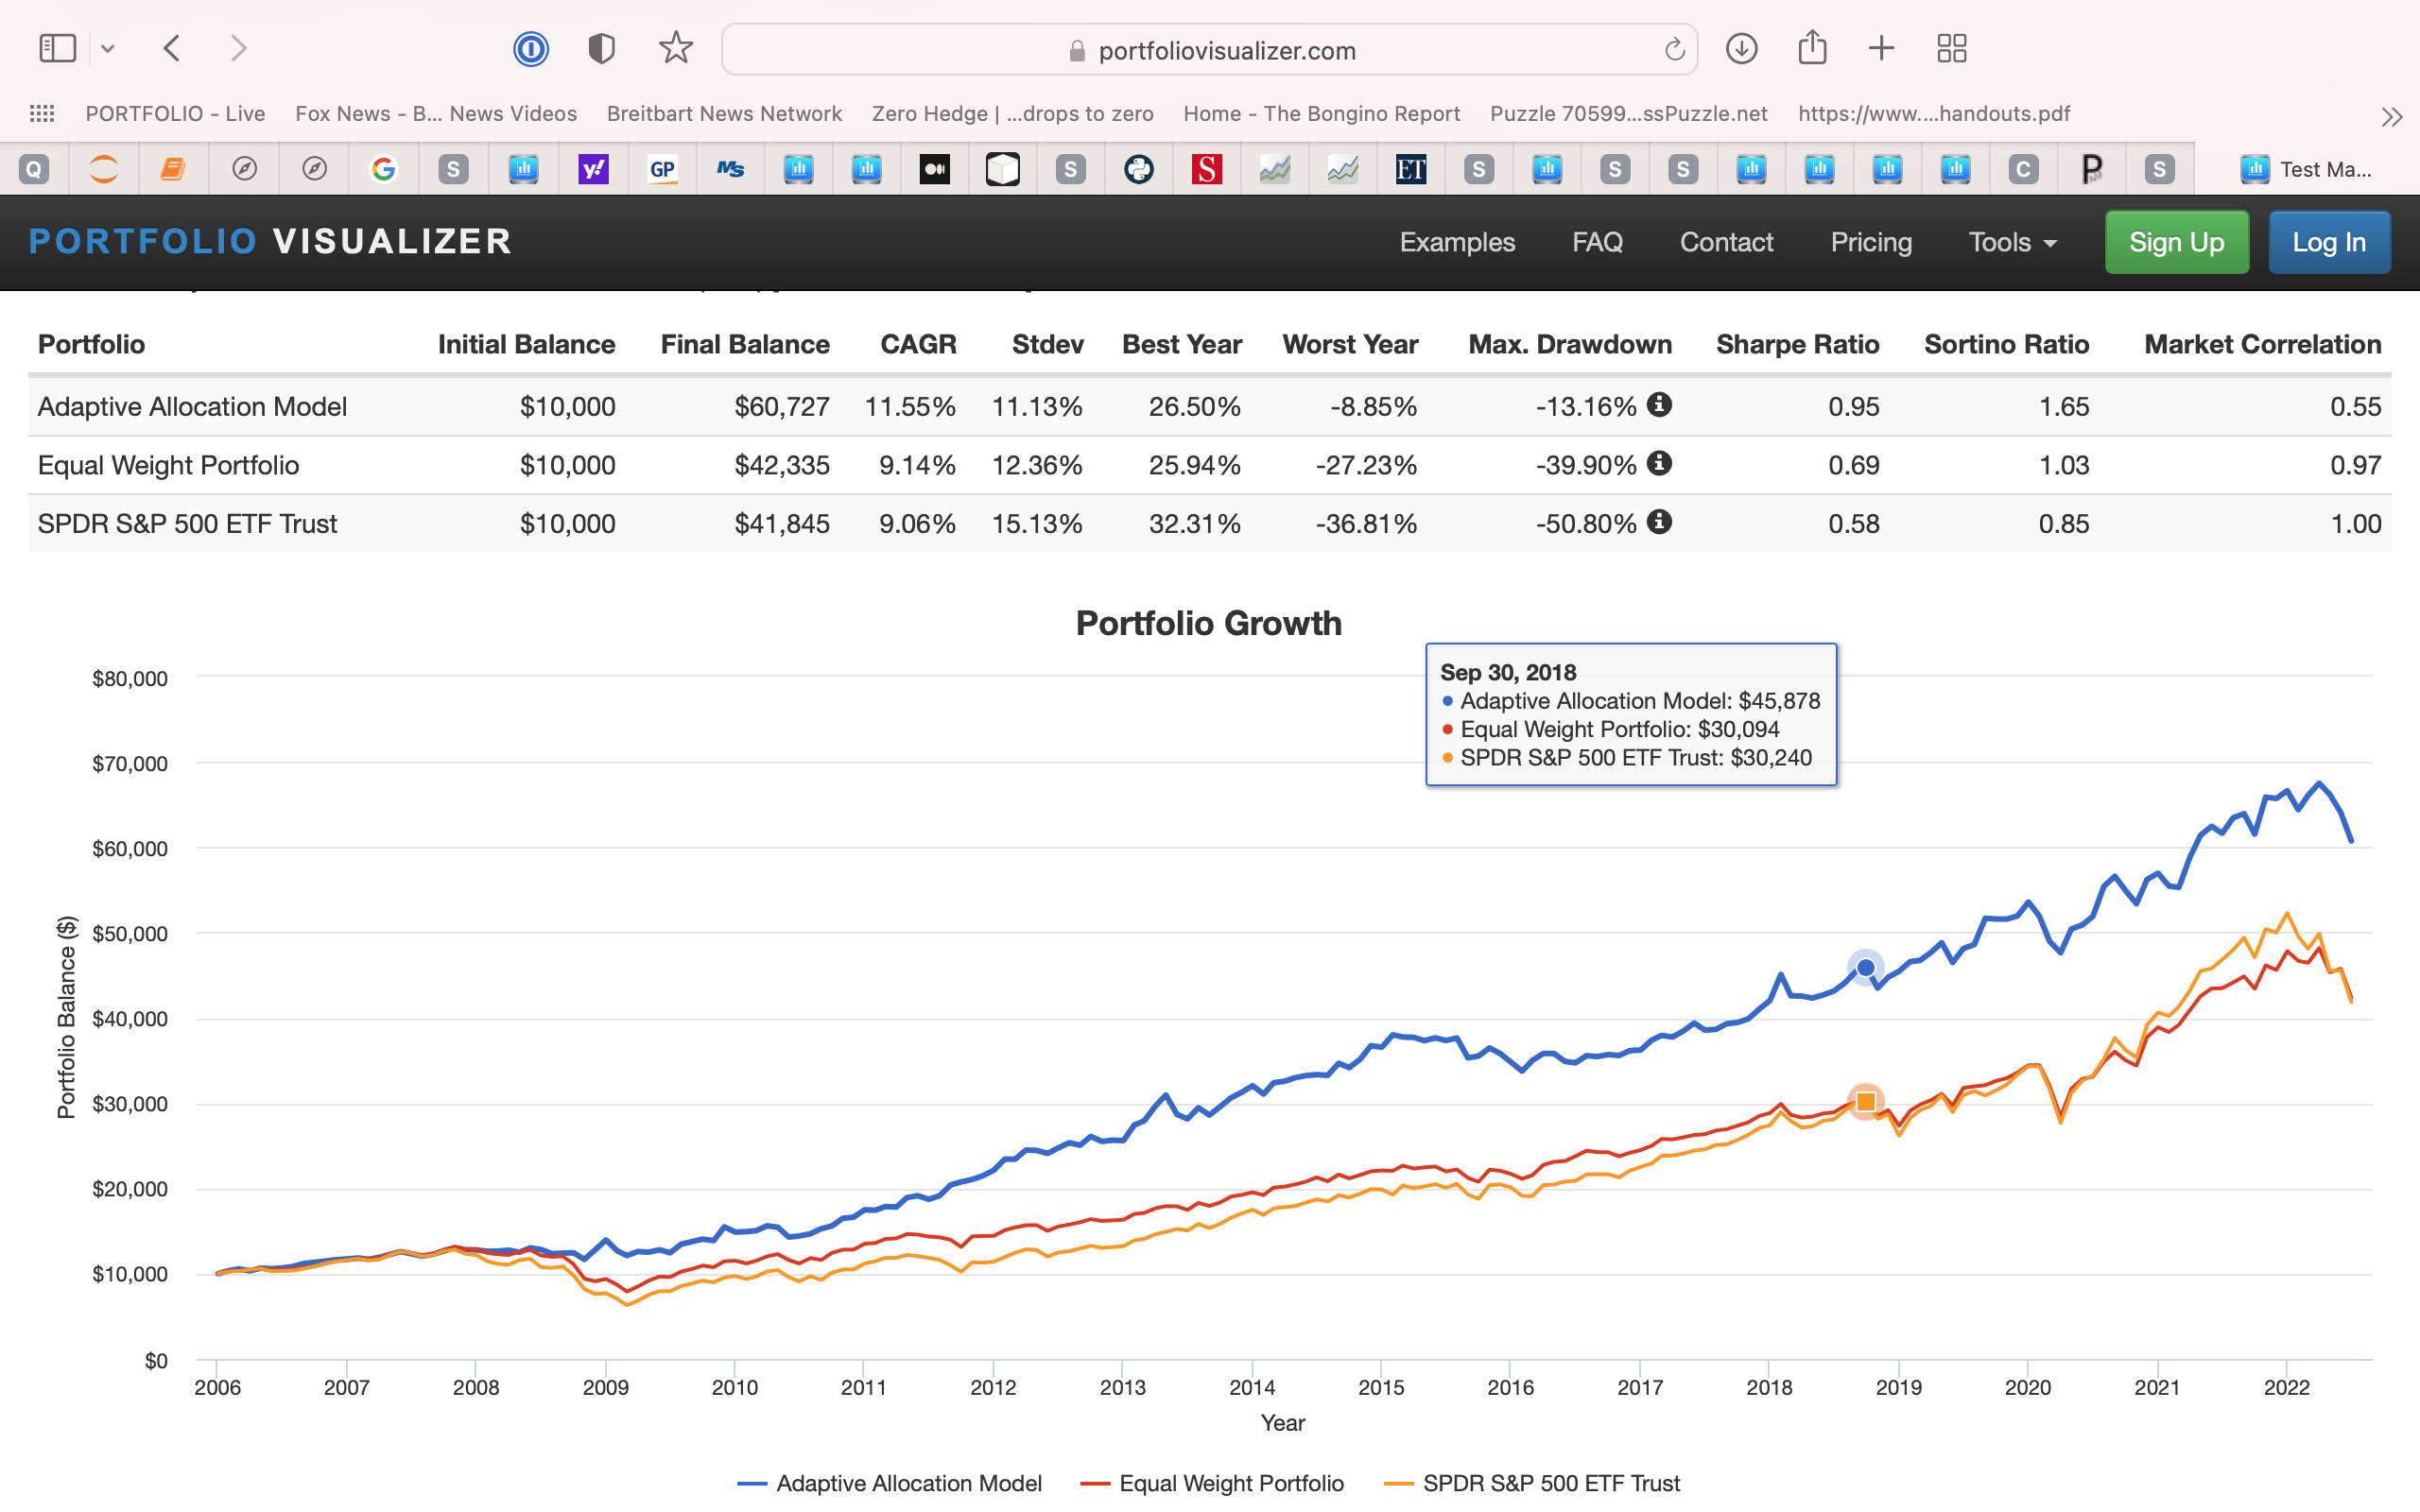
But leave that aside for a moment. Here is a site that has a pretty good and consistent following. From a business perspective it might be interesting: https://www.portfoliovisualizer.com

The problem with Portfolio Visualizer (and where dramatic improvements can be made) is that is does not have much in the way of indicators (technical or otherwise). What it has is rudimentary.

My only point for P123 is that it would be relatively trivial to dramatically improve on Portfolio Visualizer’s site if there happens to be a business case for it. The computing power required is not large compared to what P123 does now. Using the ML algorithms above would be just one way to make a dramatic improvement and it is clearly not computer-resource intensive.

We don’t really know whether P123 employs a ML specialist anymore (we never hear from her in the forum if she is still there). Or whether P123 continues to focus resources on AI programs recognizing classic trading patterns (a pretty resource intensive and complex coding endeavor that may not be possible for P123 in the end).

P123 bought some GPU’s (or pays for access) in an attempt to complete this maybe? How many patterns can it recognize? What is its accuracy (precision, recall)? Can it learn and recognize new patterns? How much time have you spent? Are you done with the coding?

Personally, I would rather use the FED data with AI models and it is already in tabular form on P123’s computers. [color=firebrick]I think that would be a huge improvement over what Portfolio Visualizer does and everyone would recognize it. I think some people at Portfolio Visualizer would be signing up at P123.[/color]

P123 can debate Chris, Andreas and others about the value of technical indicators. P123 will be right on many counts. Me, I would just ask if there is a market.

For now, if you want to do ML you need to know some Python. The above program is one I have found helpful. I am absolutely sure there are better programs. Working to prove that my program is not that good would not address whether there is a market for good, professional programs.

Many find P123’s API helpful. We do not know what everyone is doing with the API but it suggests they might be using some algorithms that P123 does not provide now. There may or may not be a business case for P123 to provide some of those algorithms themselves (without a lot of debate from P123 about what P123 think they should be doing with outside programs).

P123 could consider whether there is a business case for provide programs for people focused on doing other things with P123’s API or for those not actively running Python programs now.

P123 is free to focus its resources wherever it wants without paying attention to Chris or Andreas or even Yuval really. Unless, Yuval thinks technical trading patterns is the one technical indicator worth pursuing.

Me I have no problem with P123 providing technical trading patterns. I just wonder if that offers the best bang-for-the-buck. If that is the best use of resources.

Just one idea if P123 actually takes feature suggestions anymore. Or if P123 welcomes any discussion of any ongoing development of AI capabilities.

This was an interesting conversation from which I can always learn something new, but I’m still looking for studies, or even self-studies, that illustrate how to utilize technical analysis to enhance the timing of my own stock purchases.

The first research, which I mentioned above, looked at a variety of known indicators but found that none of them were particularly predictive for 10, 20, or 50 days. I also tested the numerous technical criteria and rating system rules here at 123P, but none of them produced higher results.

That is not to imply that I do not consider share price trends, partially by assigning a bigger weight in the case of a decline in ROC (40), but it is not much more advanced than picking up some of the reverse effect.

I also have a risk on\off strategy (fundamental) to avoid the worst market moments, but I’m now seeking for other people’s experiences to apply technical analysis as a last review to better timing the buy.

I believe there is something in technical analysis, but I believe it is mostly technical analysis combined with others, or more complex models with IA.

Anyway, thanks for your contributions, and please feel free to add more.

M,

Specific to your question, I think relative strength works over short periods still. And the number of papers are too numerous to site here.

While more than you asked for, I do tend to want to look at this myself. To avoid overfitting–from selection bias of ETFs-- I used just the SPDRs GLD and TLT and took the 5 ETFs (out of 11 or half) with the best relative strength (monthly rebalance). And weighted them using mean-variance-optimization. Minimum variance here.

I signed out of my account to run this. One can check this themselves at Portfolio Visualizer to see how it works for other ETFs and see if there might be some selection bias after all–despite my rather generic choice of ETFs.

The above Python code was just a way to look at additional technical indicators–some a bit more esoteric.

In short, I agree with you. I don’t think there is any doubt that there are still some technical indicators that work. I hope others have additional indicators to share with you. There are almost certainly better indicators but clearly they exist.

Chris and Georg have named a few in the forum over the years (and requested that a few be made available in P123’s data). Marc Gerstein seemed to believe in Chaikin Money Flow (CMF) although there may have had some incentives to have that opinion (he has been employed by Marc Chaikin). I defer to them for a more comprehensive list. I am more about the reinforcement-learning “policies” which can be simple. Like: select 5 ETFs with the best relative strength and weigh them using mean-variance-optimization above.

Link to how CMF is calculated and the theory behind it: [url=https://www.fidelity.com/learning-center/trading-investing/technical-analysis/technical-indicator-guide/cmf]https://www.fidelity.com/learning-center/trading-investing/technical-analysis/technical-indicator-guide/cmf[/url]


Thank you much, Jim! It’s always a pleasure to find an ally on the internet, where unsubstantiated ad-hominem take-downs seem to be the game’s name. I’ve always felt that the proof of the pudding is in real-time results. I’m glad you (one of the sharpest minds on Portfolio123) recognize that. Thank you, sir…

2022 Results

1 Like

Jim and etc: TL;DR - Go lose money… Welcome to the real world where fundamentals don’t matter…

I tried for years. Morons never learn a lesson. GFY

Mr, @Whycliffes, sir!

Do you feel that you received an answer to your questions about technical analysis? When I read your initial post I was quite interested in seeing the responses, as I had spent a good deal of time learning technical analysis.

Perhaps I failed to read the responses carefully enough, but the conclusion I reached in reading the responses are (1) some (not all) technical analysis techniques can provide guidance for when to buy and sell, and (2) as to which ones, you need to figure it out for yourself. In other words, profitable TA methods exist, but they won’t be simple rules, and the more complicated rules that do work the folks who figured it out aren’t going to share with you. Is that the conclusion you reached?

Cary

My conclusion:
I haven’t found a study or meta-studies that are convinced that technical analysis works
But I agree with ETFOptimizer that to many studies test very simple technical indicators, and tend to test them in isolation. If technical analysis is to work, this must be done together with others to correct for the weaknesses that are inherent in the individual indicator.

I have read some studies that suggest that technical indicators may work on more trending asset classes than stocks, such as forex and commodities,

That said, it is recognized in financial theory that momentum and short term reversal work, so indirectly several of the technical indicators will measure in some way these two, but it probably won’t, in my view, mean that technical analysis overall works very well.

I’v thought sometimes that the reason technical analysis is so popular is first of all that it’s easier to learn and understand than the vast amount of information that needs to be incorporated into fundamental micro or macro analysis. The second is that technical analysis is a bit too easy to manipulate. With small changes in the indicators, they can provide good returns in a backtest, but which in turn makes them so optimized that they are unlikely to provide much value for future prediction of the price action of a stock.

Finally, of the simulations and screens that are available here as “public” , very few use technical analysis alone, and those who do often do poorly.

But I hope more people will publish their results with just technical analysis, so that it will be possible to probe this further.

In any case, if technical analysis is to be used, the simplest indicators cannot be used in isolation, they must be used together with others and it is important that they are not overoptimized.

But there are people in this forum who are way smarter than me, and who have done this “game” much longer, hope they can give some feedback?

I ran a 70 year timing backtest of the SP500 Index in excel, using only SMA and MACDD. Basically, the timer keeps up with the index with much lower drawdowns. It’s pretty well known that SMA works, but it’s not very exciting, and periods of whiplash occur which are emotionally hard to navigate. Here is a log plot of my test:

Mr. @sglinski, sir!

Thank you for your post. I have heard of using the 200 day moving average before, but not the MACD. Can you elaborate? I am currently using a version of the 200 Day moving average together with one of the economic indicators that Philosophical Economics mentioned back in 2016. (I only learned about those studies last year.) Perhaps the MACD would be superior.

But back to the question that Mr. @Whycliffes originally raised, do you know of an indicator or set of indicators that will improve the odds of getting a lower price for buys and a higher price for sells when acting on the live portfolio recommendations?

Cary

Good question and this gets down to trading using technicals and there is no one way to do this.
I think what everyone wants is to have the highest profit per trade on winners and lowest for losers and having a high percent winners helps. This also helps you control slippage. One way to do this is to identify stocks that have short term momentum (30 - 45 bars) and then have a shorter term pull back ~ 5 days. There are many ways to code both of these. Buying on the pull back you are getting a lower price for the stock. (Buy the dip and sell the rip). The next part is more of a trading question to control slippage. If the stock jumps 10% at the open most people will pass on it and wait for it to pull back again. If it does not pull back I pass. If your average profit per trade is 5% and the stock jumps 10% your odds of success are less. The simulation will use the average of the high and the low and would buy that stock that jumps 10% and would use the average of the high and the low so some people would just buy it. I’m sure other members have their own rules and code for this. The execution of the trade is very difficult. It comes down to trust the system and just buy it or use your own rules the day of the trade since you don’t know what the high will be for the day or the low until end of the market day. The same problem exists for the sell side. If your stock jumps 10% the day your system signals a sell that’s a good problem if it drops 10% that’s a bad problem. You just hope your system KPI’s hold for the future and it averages out over many years. This is why I avoid systems that have low profit per trade and high turnover. You really have to think about controlling slippage. I think there are members who can make this work but I can’t.

Cheers,
MV

1 Like

Great feedback here. Other TA tips: Buy stocks with a recent surge in volume, regardless of price. Use industry momentum, both short-term and long-term, and apply it anywhere from sector down to subindustry. Measure momentum (both individual stock and industry) using all sorts of methods, from the omega ratio to SMAs to VMAs to simple Close(X)/Close(X) to Close(X)/PriceH to RSI. One tip that I find works well for me is to measure individual stock momentum a month ago rather than now. That makes it much easier to buy on a dip, and it also means you don’t fall prey to mean reversion as often, since momentum is usually long-term and mean reversion is usually short-term.

3 Likes

I’ll throw in something concrete. I’ve found this useful to sell an over-bought holding and bump up the ports Avg Return.

Eval((LoopSum("Close(CTR)>BBUpper(60,2.0,CTR)",5)>=3)&(RankPos>X),1.0,0)

Here, set ‘X’ to the number of holdings (i.e. for a model that holds 10 stocks, set X to 10).

1 Like

Her are some of the best performing from danp`s excel sheet:

Pullback Loopsum( (close(CTR)-open(CTR)),5)/5 Universe Lower 10,4
Pullback RSI(8) Universe Lower 9,8
Pullback close(0)/lowest(#close, 50, 1) Universe Lower 9,7
Pullback rsi(10) - RSI(10,10) Universe Lower 9,7
Pullback (close(0)-Low(0))/(Hi(0)-Low(0)) Universe Lower 9,6
Pullback UpDownRatio(5,0) Universe Lower 9,6
Pullback close(0)/sma(10) Universe Lower 8,9
Pullback RSI(10) Universe Lower 8,5
Pullback ((Close(0) - Close(5))/Close(5)) Universe Lower 8,3
Pullback Close(0)/ema(10) Universe Lower 8,0
Pullback RSI(12) Universe Lower 7,9
Pullback (Pr4WRel%Chg-Pr52WRel%Chg)/abs(Pr52WRel%Chg) Universe Lower 7,4
Pullback close(0)/lowest(#close, 10, 1) Universe Lower 7,4
Pullback rsi(10) - RSI(10,5) Universe Lower 7,1
Momentum Close(0)/lowest(#close,10,0) Universe Lower 7,0
Pullback Close(0)/ema(5) Universe Lower 6,6
Pullback RSI(20) Universe Lower 5,9
Pullback Loopsum( (close(CTR)-open(CTR)),10)/10 Universe Lower 5,5
Momentum Price/PriceH Universe Higher 5,5
Pullback close(0)/lowest(#close, 5, 1) Universe Lower 5,5
Momentum Eval(Low(240)=Hi(240),(close(0) - Low(241)) / (Hi(241) - Low(241)),(close(0) - Low(240)) / (Hi(240) - Low(240))) Universe Higher 5,1
Pullback ((Close(0) - Close(10))/Close(10)) Universe Lower 4,7
Momentum ema(50)/ema(100) Universe Higher 4,4
Pullback Close(0)/SMA(20) Universe Lower 4,3
Momentum SMA(50)/SMA(200) Universe Higher 3,9
Momentum Loopsum( eval(close(CTR)<close(CTR+1), 1, 0),5) Universe Higher 3,9
Momentum Sortino(100,5,10) Universe Higher 3,6
Momentum Sortino(100,5,5) Universe Higher 3,5
Momentum sma(120)/sma(240) Universe Higher 3,5
Momentum Pr52W%Chg/Beta Universe Higher 3,4
Pullback Close(0)/sma(50) Universe Lower 3,2
Momentum (close(20) - close(220)) / close(220) Universe Higher 3,1
Pullback Close(0)/SMA(5) Universe Lower 3,1
Momentum (Pr4WRel%Chg-Pr26WRel%Chg)/abs(Pr26WRel%Chg) Universe Lower 3,1
Momentum Pr52W%Chg/PctDev(52,5) Universe Higher 3,0
Momentum Pr26W%Chg/PctDev(26,5) Universe Higher 3,0
Pullback Close(0)/ema(50) Universe Lower 2,8
Pullback Loopsum( eval(close(CTR)>close(CTR+1), 1, 0),20) Universe Lower 2,8
Momentum Pr26W%Chg/Beta Universe Higher 2,6

Thank you! Nice. It improved both performance and “overall winners” compared to my “test” system:

Test system:

Adding sell rule:

Do you use a similar buy rule to avoid overbought stocks?

Yuval,

I have not done a lot of testing of technical factors… But these were the strongest of the technical factors by any statistical tests that I did do.

Perhaps no coincidence that you mention this first. But again there are a ton of technical factors that I have not even looked at and I would not disagree with anyone who believes they have found better technical factors.

Best,

Jim

I’ve experimented a bit but not enough to use it in my models.

BTW, from your list, the following is a biased indicator. It favors low priced stocks. If it were a percentage, that concern would go away.

Pullback Loopsum( (close(CTR)-open(CTR)),5)/5 Universe Lower 10,4

Mr. @Whycliffes, sir!

Thanks for your excellent posts. I fear my I/Q is getting in the way for some parts of your posts, so I am hoping you can help me understand.

  • When you said " danp`s excel sheet", which excel sheet are you referencing?
  • When for the first rule you wrote “… Lower 10,4”, I assume that the “Lower” means lower is better, and I assume the “10,4” is the European notation that we in the US would write “10.4”. But what does the “10,4” signify?

Sorry, Mr. @Whycliffes, sir! I accidentally hit “Send” before I was finished. Now to more of my questions…

  • You have as your ranking system “AAA US 15 Total rating API 500N uten yt sine”. Is that the name of a private ranking system or is it a public one? I ask because I am so ignorant of a large part of the P123 web site.

Thank you for your replies,

Cary

Thanks. This same rule can be simplified by taking out the Eval as:

LoopSum("Close(CTR)>BBUpper(60,2.0,CTR)",5)>=3 & RankPos>X