M,
Specific to your question, I think relative strength works over short periods still. And the number of papers are too numerous to site here.
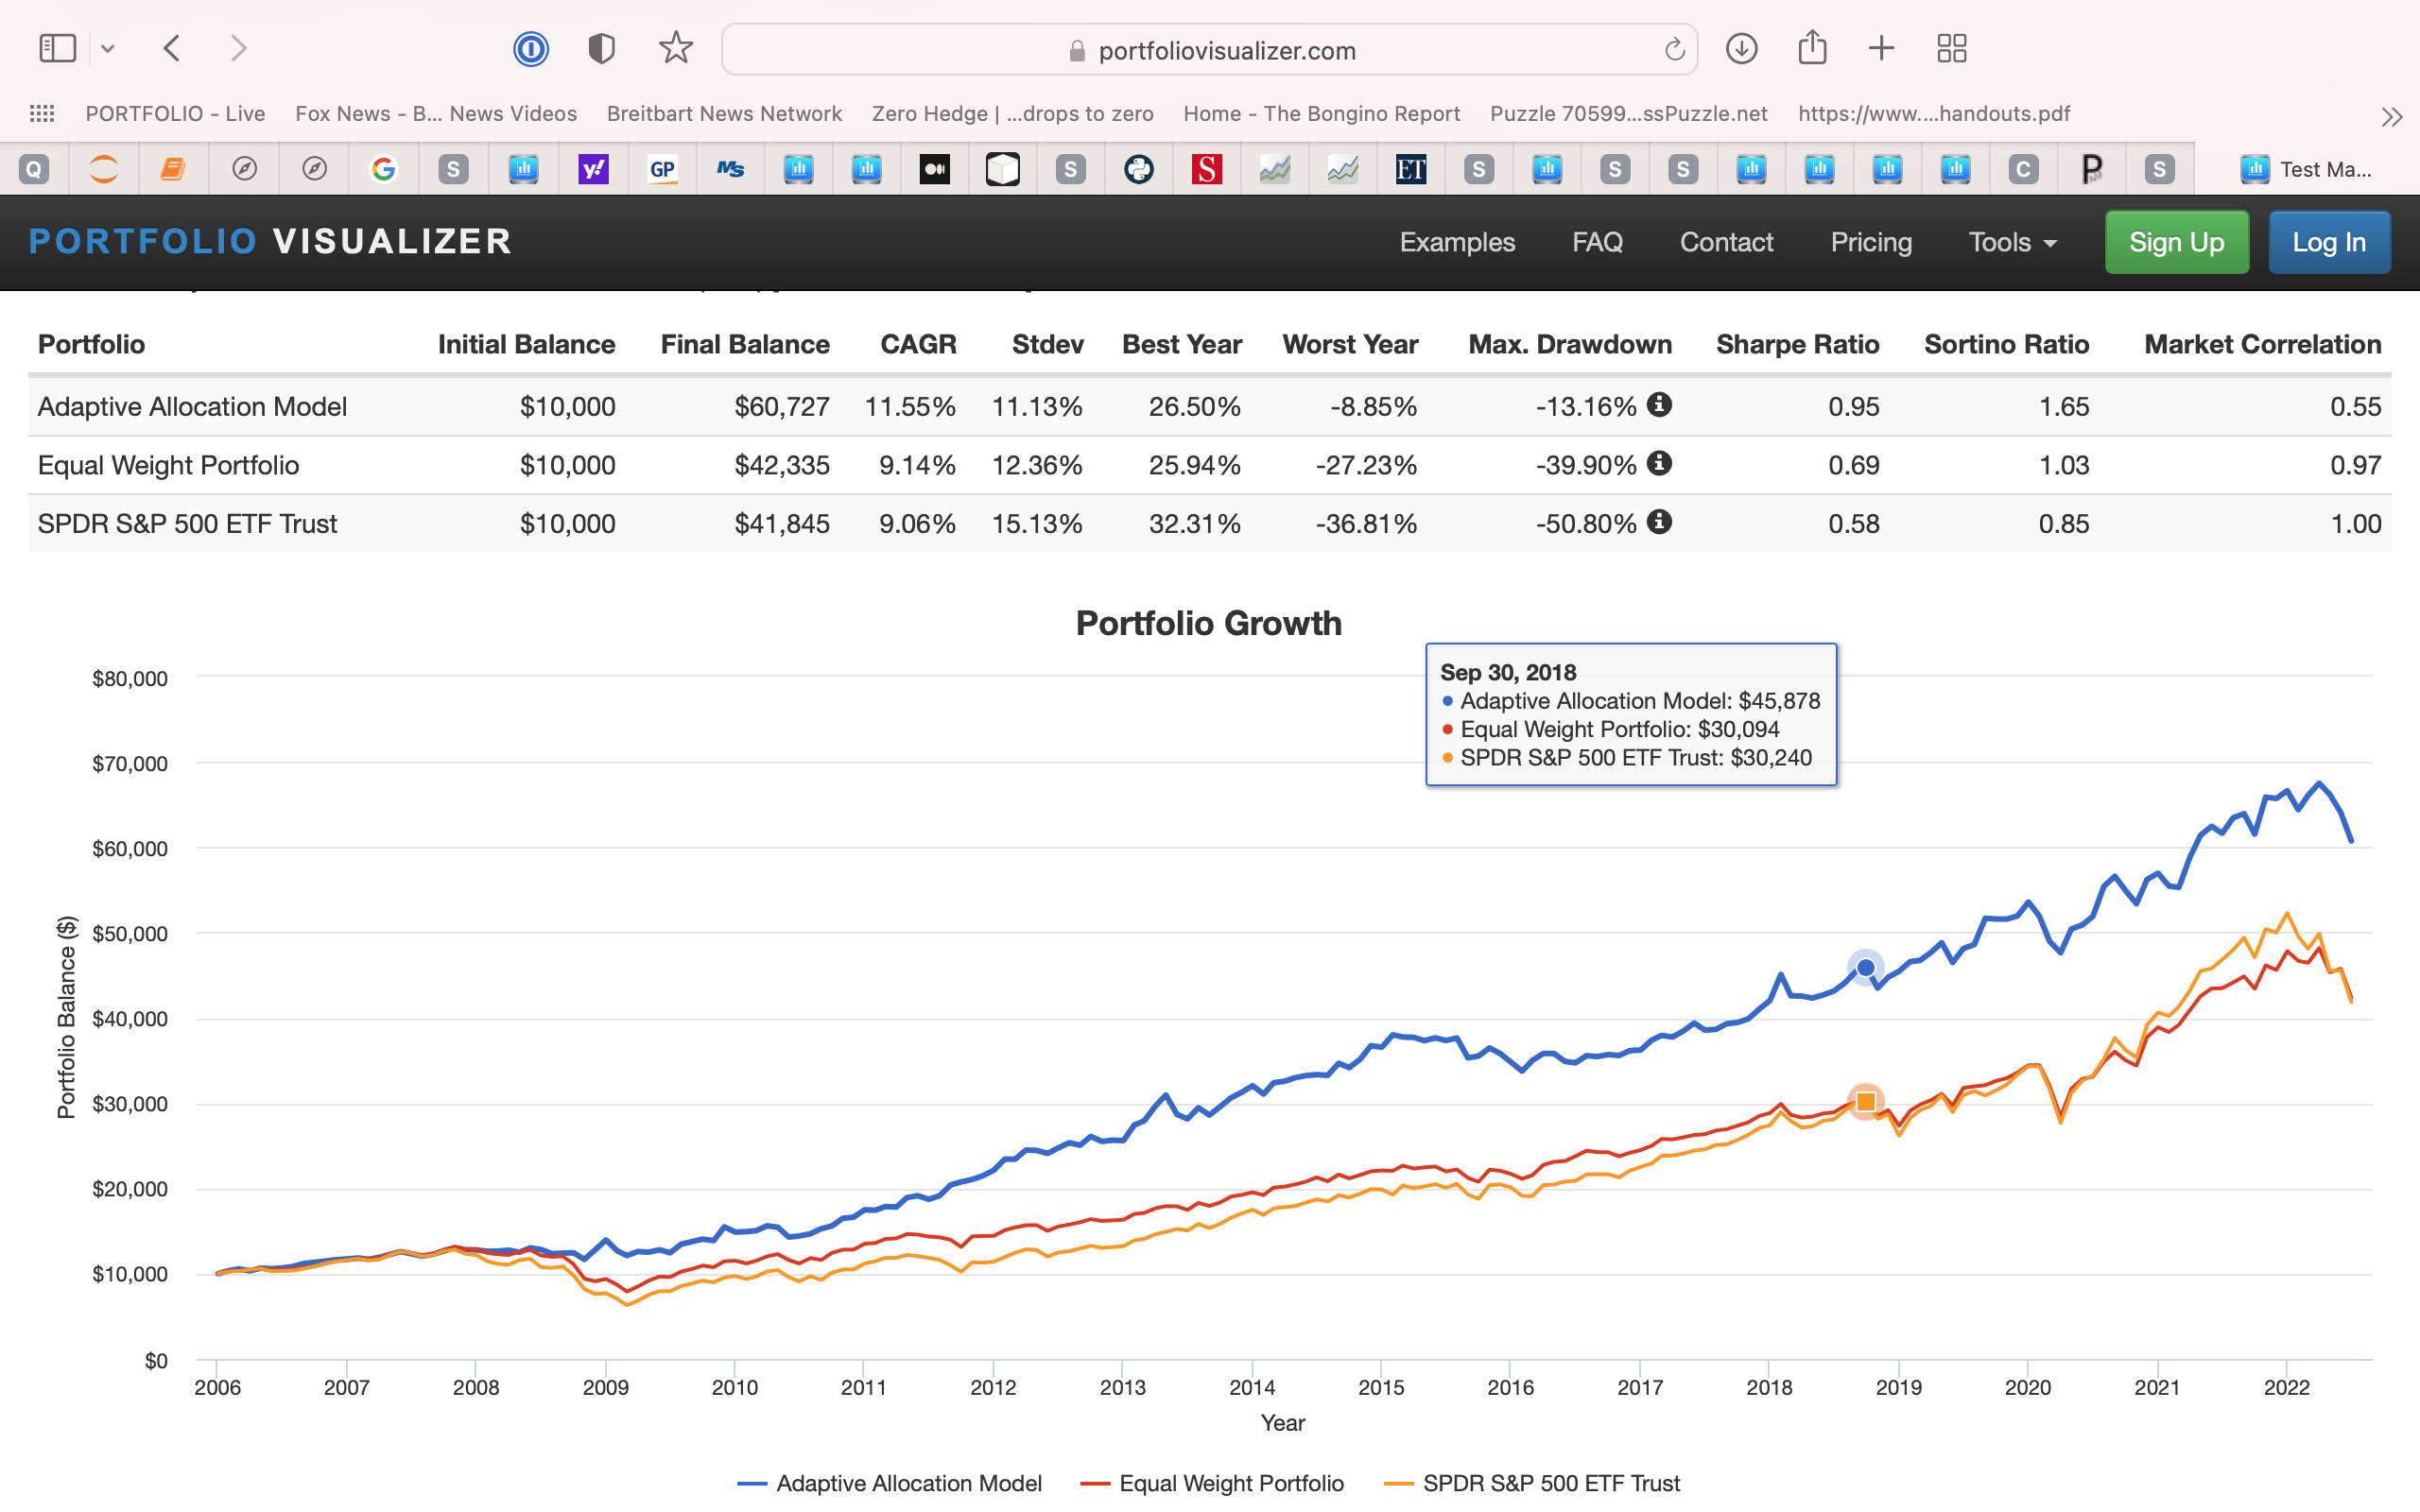
While more than you asked for, I do tend to want to look at this myself. To avoid overfitting–from selection bias of ETFs-- I used just the SPDRs GLD and TLT and took the 5 ETFs (out of 11 or half) with the best relative strength (monthly rebalance). And weighted them using mean-variance-optimization. Minimum variance here.
I signed out of my account to run this. One can check this themselves at Portfolio Visualizer to see how it works for other ETFs and see if there might be some selection bias after all–despite my rather generic choice of ETFs.
The above Python code was just a way to look at additional technical indicators–some a bit more esoteric.
In short, I agree with you. I don’t think there is any doubt that there are still some technical indicators that work. I hope others have additional indicators to share with you. There are almost certainly better indicators but clearly they exist.
Chris and Georg have named a few in the forum over the years (and requested that a few be made available in P123’s data). Marc Gerstein seemed to believe in Chaikin Money Flow (CMF) although there may have had some incentives to have that opinion (he has been employed by Marc Chaikin). I defer to them for a more comprehensive list. I am more about the reinforcement-learning “policies” which can be simple. Like: select 5 ETFs with the best relative strength and weigh them using mean-variance-optimization above.
Link to how CMF is calculated and the theory behind it: [url=https://www.fidelity.com/learning-center/trading-investing/technical-analysis/technical-indicator-guide/cmf]https://www.fidelity.com/learning-center/trading-investing/technical-analysis/technical-indicator-guide/cmf[/url]