Werner, I think they wanted to replace it with the FRED series, but I am not sure. Good to hear that some of your ports have improved with UNEMPL.
It’s just being deprecated because of the source. We are planning on switching to FRED/ALFRED numbers, rather than being limited to those provided by CompuStat. Unemployment should be available going forward, even after the switch, though you might need to change the code in the future.
Thanks for letting us know. It really works well as a timer, all the way back to 1987 according to my excel calculation. Please remember that the FRED data lists the UER on the first day of the months to which it refers. So you want to move the series forward in time by 1 month, to make it approx PIT.
Hi Georg,
thanks for your comments.
We can’t move the FRED series forward in real time.
I am wondering if we can apply the number OOS and when it is available/published (point in time) here on P123.
Georg - this number is not updated in real-time but has a delay… most of the government numbers have at least a one week delay or more. So you can’t use the date from the series exactly as is, you have to take the delay into consideration. Also, is the UNEMP figure based on surveys or census? Census isn’t performed on a monthly basis. I see the unemployment survey data published on various financial sites every month. Those numbers are derived from a small sample of the population (60 thousand families) who want to be polled so there is already a bias. They are heavily manipulated (seasonally adjusted, etc), and are almost always adjusted the next month after publication. Coincidentally, these surveys don’t state to what level of accuracy they are. For instance a 1% error would be 2+million jobs, and financial articles are talking about ~200K jobs monthly change. Complete jiberish. (Translation: I’m not convinced that UNEMP is a rock solid indicator).
Steve
The unemployment rate for the US is published by the BLS every month. For August 2016 it was published on Friday Sep-2 at 8:30am EST.
http://www.bls.gov/news.release/empsit.t01.htm
FRED series lists the August number with a date of Aug-1-2016. Therefore it is not PIT. As an approximation, the Aug number should be listed with a date of Sep-1 to make it PIT. If P123 wants to use the FRED series then they should shift it forward in time by one month.
It is not interesting to me how the BLS does the survey, as long as the method is consistent.
FRED Graph Observations
Federal Reserve Economic Data
Link: https://fred.stlouisfed.org
Help: https://fred.stlouisfed.org/help-faq
Economic Research Division
Federal Reserve Bank of St. Louis
UNRATE Civilian Unemployment Rate, Percent, Monthly, Seasonally Adjusted
Frequency: Monthly
observation_date UNRATE
1948-01-01 3.4
1948-02-01 3.8
1948-03-01 4.0
1948-04-01 3.9
1948-05-01 3.5
1948-06-01 3.6
1948-07-01 3.6
1948-08-01 3.9
1948-09-01 3.8
1948-10-01 3.7
1948-11-01 3.8
1948-12-01 4.0
1949-01-01 4.3
1949-02-01 4.7
… …
… …
2015-07-01 5.3
2015-08-01 5.1
2015-09-01 5.1
2015-10-01 5.0
2015-11-01 5.0
2015-12-01 5.0
2016-01-01 4.9
2016-02-01 4.9
2016-03-01 5.0
2016-04-01 5.0
2016-05-01 4.7
2016-06-01 4.9
2016-07-01 4.9
2016-08-01 4.9
So what you should be doing is simulating with Close(1,#UNEMP) and NEVER with Close(0,#UNEMP) to approximate PIT. And even then you will misfire occasionally because the information is received a day after it is expected. So can you run your sims using Close(1,#UNEMP)?
The BLS does not mention anything about revisions, reasons why, how frequent, etc. I know that they do revise the data so I see this as a risk item until demonstrated otherwise. As I said, the figures I see published every month are revised the next month (there are several figures, I’m not sure about UNEMP). The statisticians can’t keep their fingers off the numbers.
You may not be interested in the details below. But you probably should be.
http://www.bls.gov/cps/cps_htgm.htm
“A sample is not a total count, and the survey may not produce the same results that would be obtained from interviewing the entire population. But the chances are 90 out of 100 that the monthly estimate of unemployment from the sample is within about 300,000 of the figure obtainable from a total census.”
An error of 300,000 should be huge for analysts. They go nuts when the unemployment figure changes unexpectedly by even 50,000.
The other point I made earlier is that corporations are becoming detached from US employment due to globalization and the internet. As an example, the S&P 500 are in an earnings recession, 2 consecutive quarters or is it 3 now? Yet the UE rate is stable below 5%. The stock market has hit two large speed bumps in 2015/2016 yet this is not reflective in UNEMP.
All of the above is why I want to know how long you have been using this indicator with P123 tools, and what the OOS would be. I don’t care about backtest except after the point in time you decided this was a good indicator.
Steve
Steve, the current #UNEMP series is not from FRED. I checked the #UNEMP series and found that it was nearly PIT. I did an excel calculation with weekly PIT data which I extracted from FRED. I got almost the same trades in excel as from P123. So currently one must use:
Eval(Close(0,getseries(“#UNEMP”))/Close(3,getseries(“#UNEMP”))>1,ticker(“IEF”),ticker(“RSP”))
You can insert Close(0,getseries(“#UNEMP”))/Close(3,getseries(“#UNEMP”))<1 as an additional indicator in your ranking system and you will get good results.
I have been using the Unemployment Rate for a recession indicator for about 4 years. Works very well. There are sometimes small revisions to the series, but not often, you can find them on the BLS website.
Georg - Help me out here. What date does the August 1st report data show up in the P123 database? If I look today, will I get the August 1st data?
Steve
If you chart the series #UNEMP then you will note that the changes of the UER occur at the end of the month and correspond with FRED figures at the beginning of the month.
I’m not worried about historical data, only the current month’s behavior and how the current month might be updated after the fact. But in any case you are an engineer so I trust you know what you are doing. I have launched a new SA model based on your suggestion so I hope you are right ![]()
Steve
This is old news to those who have been using P123 longer than I, but here I go…
I created a simple SPY marketing timing system that uses a summation-based ranking system (ala piotroski) that includes several different popular timing factors. I then played around with (data mined? ![]() ) different buy and sell ranks to get a decent return. You can see it here:
) different buy and sell ranks to get a decent return. You can see it here:
https://www.portfolio123.com/port_summary.jsp?portid=1447216
What I like about it is the idea that market timing can be based upon many fundamental (like earnings), technical (like pricing movement) and economic (like unemployment) factors. My guess is that over time, the emphasis could change between them. So a ranking system, where none of them have an absolute say on when to get in and get out of the market, can be a useful strategy. This is in contrast to using a buy/sell rule ‘only’ approach (where it is more difficult to have the nuances of how different factors can play a role).
I included the factors that work for me and got satisfactory results. I think the use of ranking has merit for market timing. I will keep playing around with this as I learn more.
I hope a newbie finds this strategy useful.
Anybody have a market breadth timer handy? I know there is one kicking around somewhere. Georg?
Steve, check your email.
Mark,
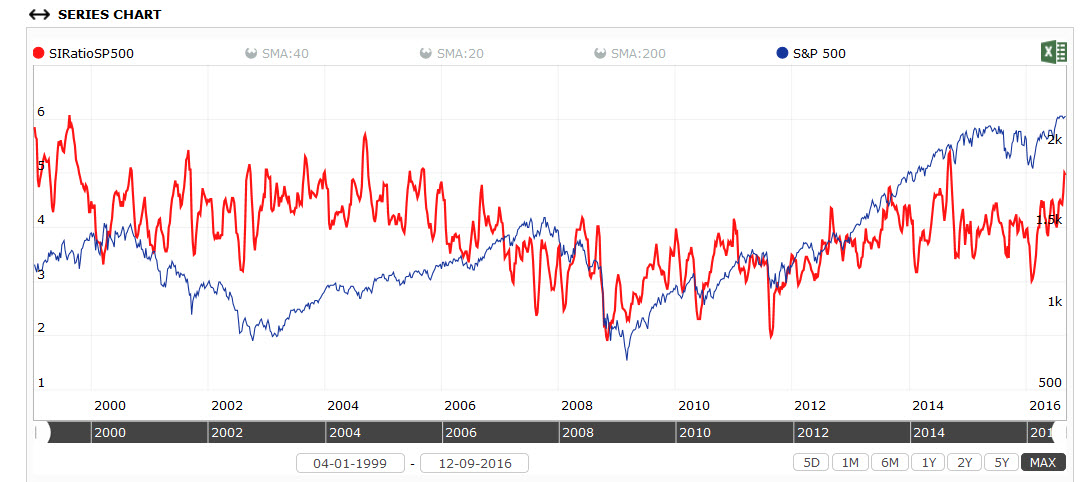
interesting that you mention Short interest. I used the average SIRatio for SP500 universe (see below) too look into that (attached). How would you use that as a timing indicator? Doesn’t really have a good correlation with what the index does…
EDIT
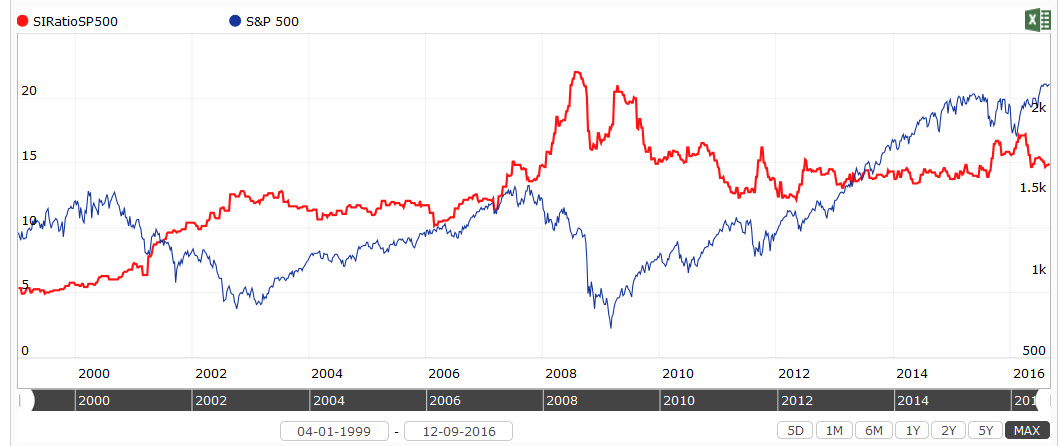
I now also looked at Short Interest Current Month (in Millions). This makes more sense, but still challenging to use as market timer. See attachment below.
Hello Florian I was referring to this rule formula it was used as a market timer in a previous thread. But my real question is how do you optimize multiple market timing data series to maximize the return. I know you can do it one by one and then combine them but I was wondering if the operations research wizards have a better way of doing it.
eval (sma(52,0,getseries(“SP500ShortIntAvg”)) > sma(104,0,getseries(“SP500ShortIntAvg”)),1,0)
Mark - right now I’m just using indicators in a majority vote wins. It isn’t very scientific though. If each indicator was absolutely independent from the rest, then voting would make sense. I think we need to think about how we could develop the decision making logic, looking at correlation of indicators, that sort of thing. It is about what makes sense for future predictability. Right now we can only optimize backtest results.
Steve
Steve that makes since and thank you for taking the lead on this. What is the decision making logic besides the equity curve?
Vix we know it rises before a correction but there are lot’s of false signals. We know it goes lower during a bull but you miss the 1st year of a bull.
Earnings gives lot’s of false signals especially when one sector like Oil goes into recession.
Unemployment has to drop during a recession and rise during a bull and shows some good predictive power
Ted Spread seems to be good for allocating the percentage of Bonds vs stocks during the entire market cycle unfortunately we can only allocate based on position size.
And Benchclose is obvious.
We know what has potential we just don’t know how to easily combine them and what makes since for the next ten years. The other issue is should you use EMA, SMA or the slope of the line. Lot’s of permutations and combinations wish there was a methodical way of doing this.
Thanks again and look forward to more of your posts.
Regards,
Mark V.
I agree there are lots of timing indicators and most if not all are flawed in some way. Currently the approach is to build as many indicators as possible and then let them vote… 50% of the indicators have to be bullish. It isn’t a great way but will do for now. You can play tricks with this i.e. increase leverage if >80%, be more aggressive i.e. >40% instead of 50%.
As for the future of this, please see http://stockmarketstudent.com/stock-market-student-blog/market-timer-business-cycle-approach
I am now starting afresh but using economics and fundamentals to determine where in the business cycle we are. I know the Fed Reserve is screwing up the business cycle but hopefully this will get back to normal. I might even get a smile out of Marc with this new approach since it wil emphasize fundamentals a lot more than the original market timer.
Steve
Thanks Mark!