Dear All,
We just released a redesigned Rank→Performance testing tool, or should I say "multi-tool"?
Here's what it does now:
Shows annualized returns for the quantiles for Total Return, Excess vs. Benchmark and Excess vs. Universe
Quickly allows you to compare the first half and second half of the period to check for decay
Many stats calculated like Pearson and Spearman correlation
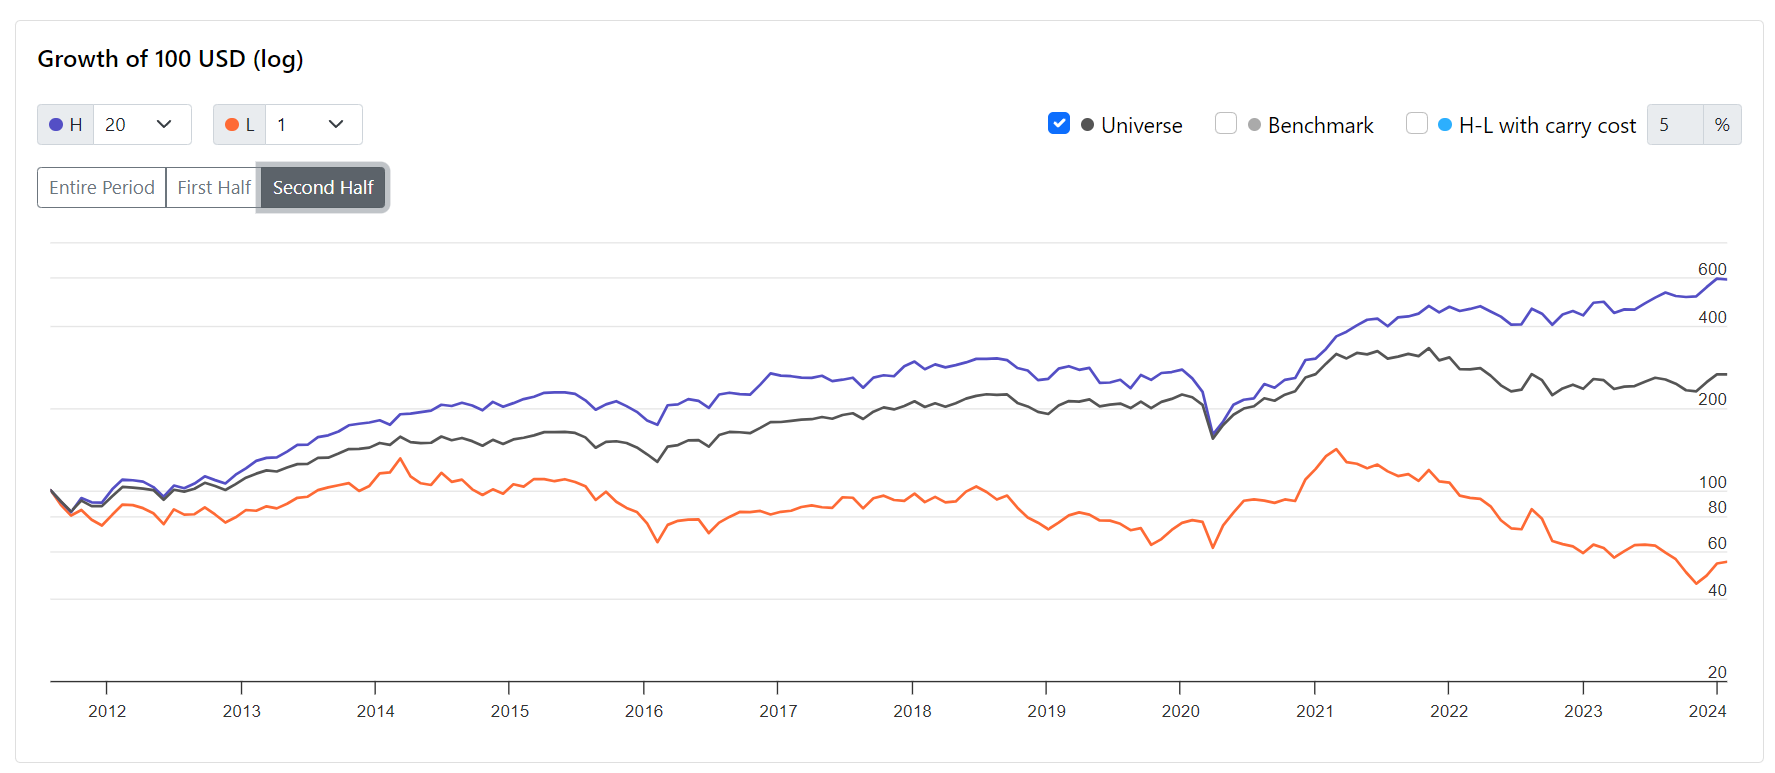
Compare the performance in log scale of a choice of quantile, benchmark, universe and High-Low (including carry cost)
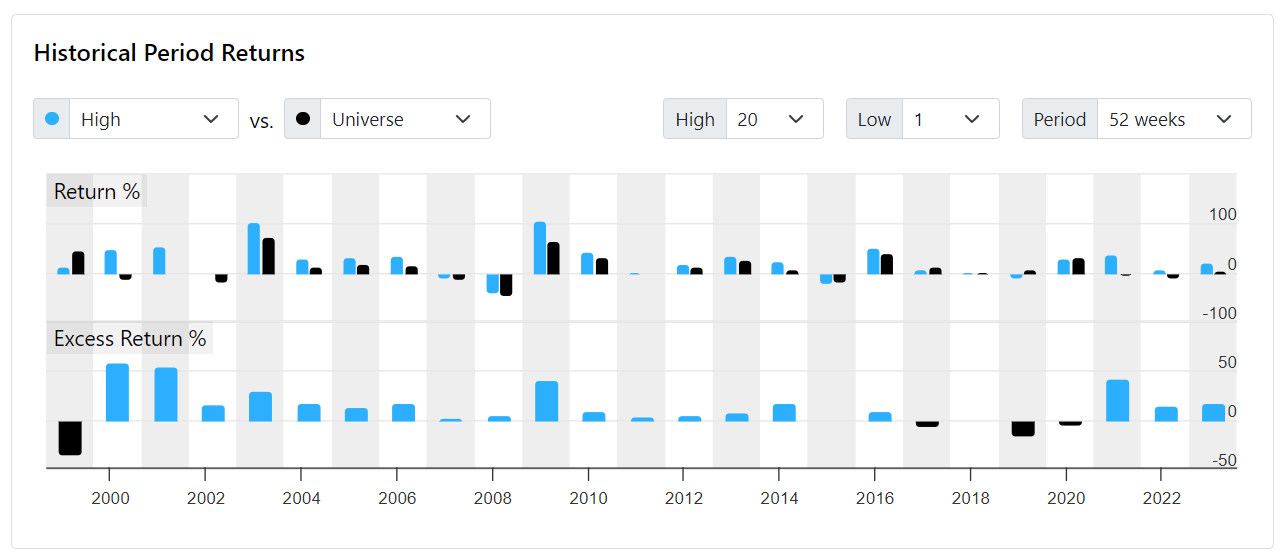
Visualizes the excess returns of periods to quickly get a sense of where the performance came from
Stocks in bucket chart to quickly spot problems
Download all the data to do your own analysis (includes stddev)
As you can see there's a lot, and it's all in one page. Here are the screenshots of our Core Value system that clearly shows that value has not been in favor for the past 10 years or so.
There's a phase 2 as well for this upgrade, so let us know what you think.
Cheers
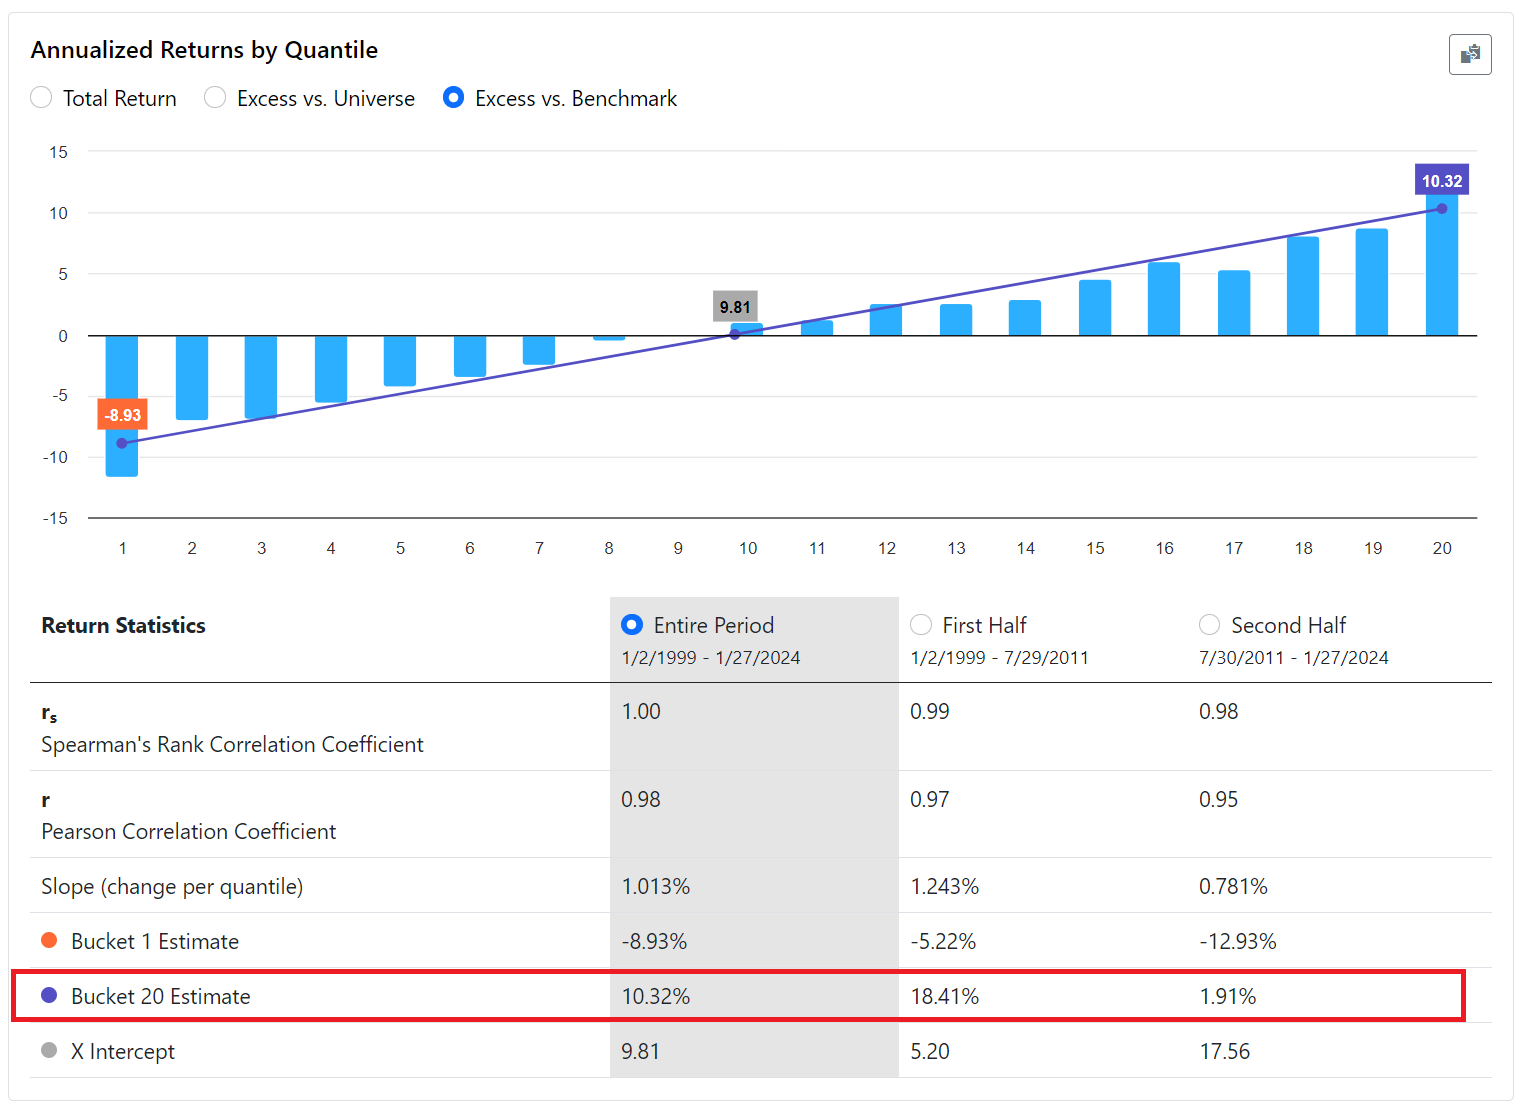
Quantile Returns & Stats
Bucket 20 is highlighted showing a decay from 18.4% to 1.9% excess return in second half
Periods can be different than rebalance frequency. Here the 52 week period is shown calculated from 4 week rebalances. The first half clearly has some of the biggest excess returns.
It should really give us a sense of when our alpha is eroding (or improving).
I’m sure you have your hands full with ML release, so this feature is above and beyond.
Hopefully you will see rewards via new subscribers and more engagement. Starting to feel exciting for me at least.
API endpoint /rank/performance is not affected. There will be a new endpoint that returns all the data used to generate this. Or perhaps we just add a new option to ‘outputType’
Yes, but we’re going to re-use this for ML. So two birds w one stone. We’ll create deciles from predictions and show basically this redesign as one of the outputs of the validation.
It looks like the default Minimum Price is now 0 when running a rank performance. I believe it used to default to 3.0 previously. Is that an intentional change or am I misremembering it?
That’s correct. The reason why it used to be defaulted to 3 is that the default universe was ‘All stocks’ , so penny stocks would always distort. Now the default universe is ‘Easy to Trade’ so it’s no longer needed. And if there are outliers we want you to notice, not hide them by default.
In addition, the price is a post ranking filter. So it’s acting more like a buy rule, which is not the technically correct way to eliminate stocks in a ranking system testing tool. Stocks should be eliminated at the universe definition, so that quantiles are evenly distributed.
In future enhancements we want to give you an easy way to slipstream rules into the universe without actually modifying it. This would give you a fast way to test different versions of the universe w/o jumping back and forth, and without making permanent changes to the universe.
This is something I’m missing, the possibility to add buy rules at a ranking system test. I want all stocks to be analyzed for the ranks, but I don’t want the stocks that is not passing the buy rule to be presented in the rank result. That would give a better representation of a ranking system in a Simulated Strategy imo.
The calculation of the correlation coefficients seem to suggest that it is good that they are high / close to 1.
Is this so? and why would this be good/important (for a system)?
When the Pearson correlation is (close to) 1, there is a (close to) perfect linear relationship between an increase in the bucket number and the bucket returns. So the returns of a bucket can be explained by a linear function (with positive slope) of the bucket numbers.
When the Spearman correlation is (close to) 1, there is a (close to) perfect monotone increasing relationship between an increase in bucket number and bucket returns.
This second correlation measure is a nice addition, because it could be the case that there is actually an exponential relationship (not linear) between the buckets and its returns. Pearson would then show a non-perfect relationship, even though an exponential relationship would probably be prefered to a linear one, but Spearman would still give it a perfect score of 1.
Thank you Victor for the clear explanation,
but to state it differently, if the top (or top 3) buckets are high and the rest is not,
wouldn’t this be enough? Is a relationship good/necessary between the buckets?
I have a few bits of feedback after using the new rank performance tool.
I’m still used to looking at total returns, but the tool defaults to excess returns over benchmark, so each time, I have to do an extra click to switch to total returns. Can the user set a preference in their profile to select the default returns? Given the number of rank performance tests we run, this could save a lot of clicks.
The raw bucket data used to be nicely exposed at the bottom of the rank performance chart. In the new version, it’s much more hidden in favor of the regression data which is front and center. To expose the raw data, you either have to click the copy button and paste into Excel, or you have to mouse over each bucket one-by-one. It would be incredibly useful to have an option on the Annualized Returns by Quartile Chart to toggle between the regression data and the raw data. For example, if you select raw data, maybe hide the regression line and label the top/bottom buckets on the chart and replace the “Return Statistics” with the table of per-bucket annualized returns.
Scroll down to the bottom to see an analysis on number of stocks per bucket.
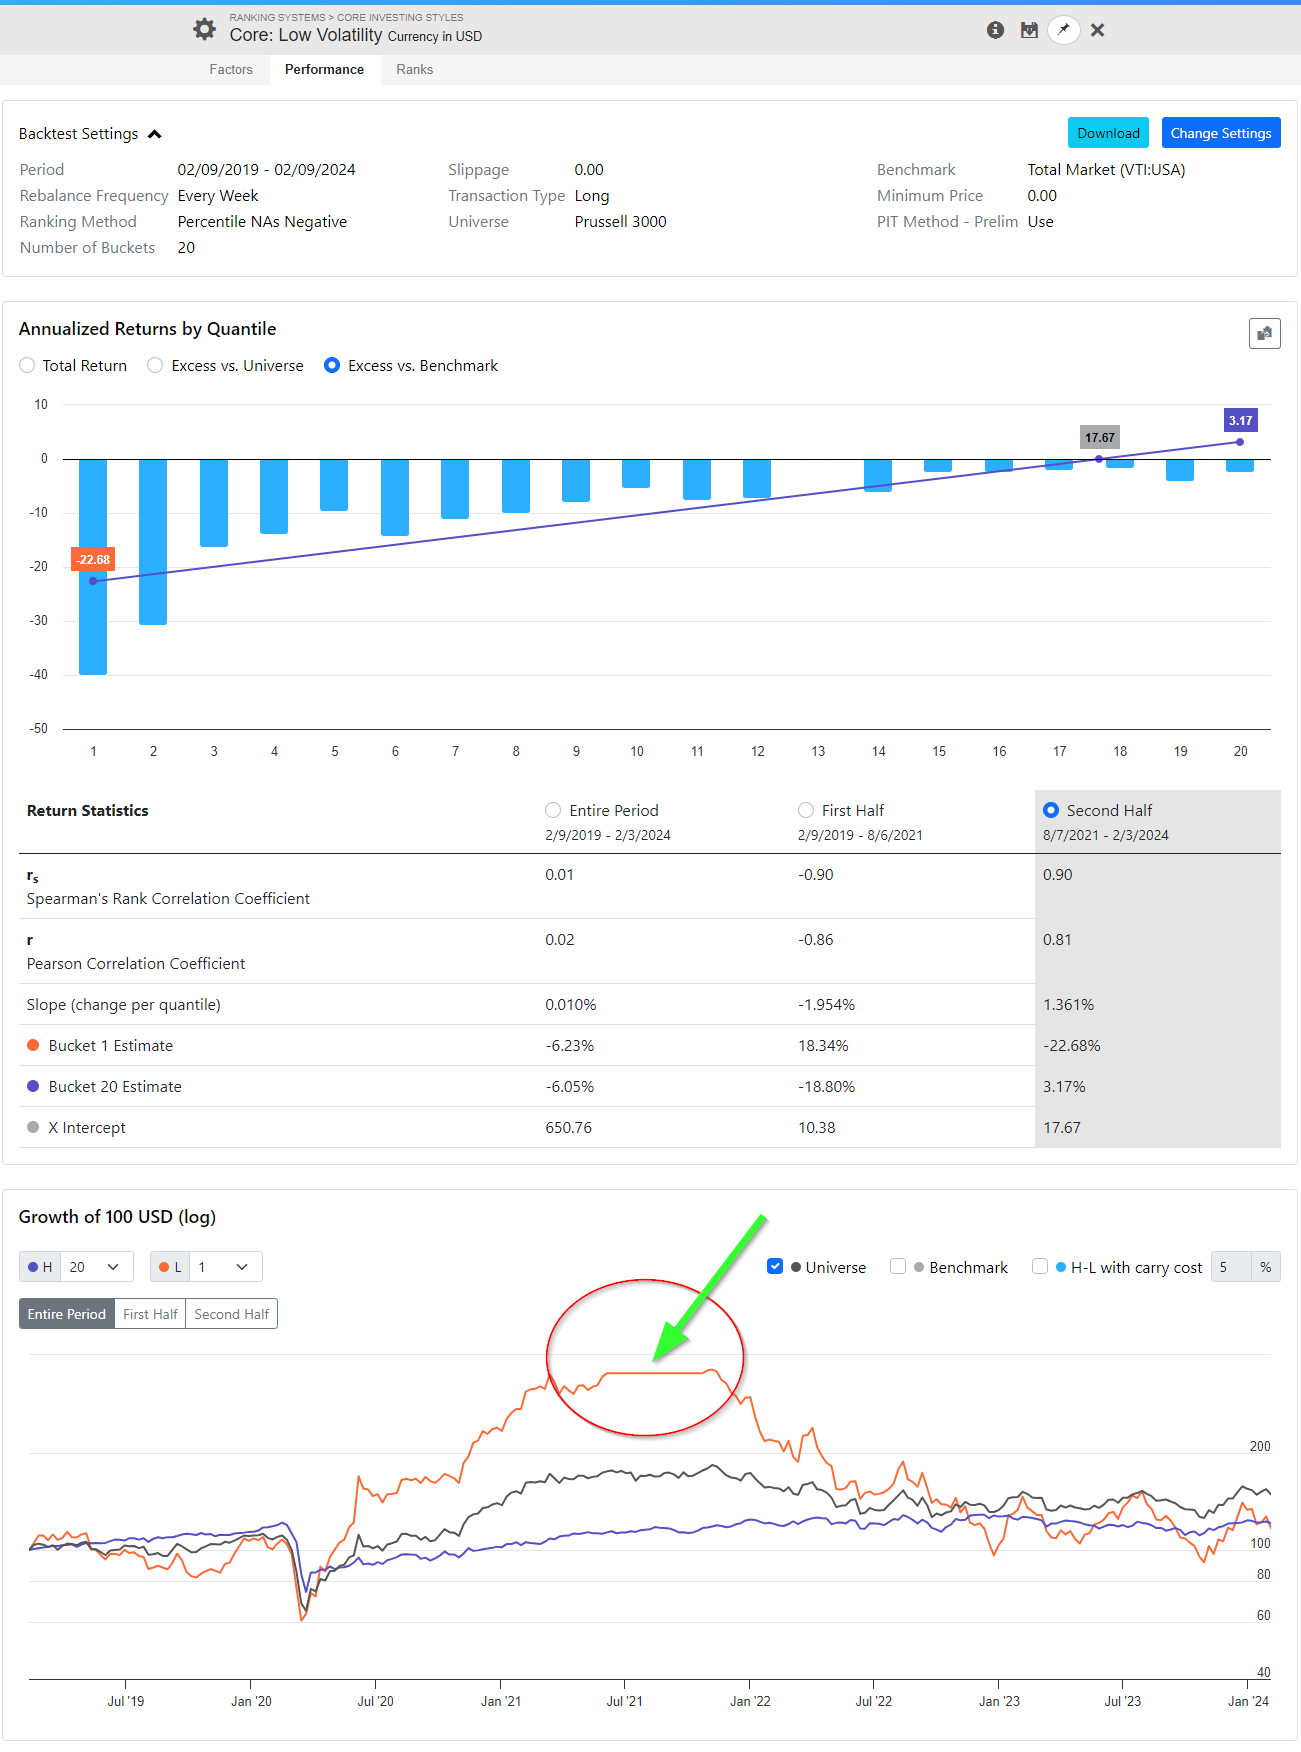
The cause is that two thirds of this ranking system requires 3 years of price data. As so many new companies appeared in that universe on 2021-06-05, the number of stocks with the highest number of N/A values caused the lowest rank to end up in bucket 2.
It looks like the Average Number of Stocks in Buckets chart has its data points misaligned by a period. We will look into resolving this issue next week.
I’m unclear if I should start a new thread or ask the questions here so I’m just posting here:
Can someone explain what we seek in the Spearman/Pearson Rank Correlation Coefficient?
I understand what they do according to ChatGPT; however, I don’t understand why they are used. e.g., Is a coefficient of 1 good? are we aiming for high coefficients and why?
What is a good/bad Spearman/Pearson Rank Correlation Coefficient with a short system? Do the same rules apply as the long system?
I probably missed it in previous threads, but I didn’t see it.
The spearman rank correlation is just a measure of whether a higher rank tends to have a higher rank of annualized return. In other words, does each subsequent bucket show a monotonic increase in returns than the prior bucket? If so, you should see a spearman correlation of 1, which is generally a good thing.
It’s just one metric that I use to evaluate of a factor or ranking system, but it doesn’t capture anything about the magnitude of changes from one bucket to the next. The pearson correlation is one way to measure that, as is fitting a regression to the x=rank and y=return line and measuring the slope of that which is also now shown in the new rank performance implementation.
As I mentioned in this comment in the “Ranking your ranking systems” thread, I tend to find the spearman correlation most useful when I’m running a rank performance on single factors, and I tend to focus more on measures of the return of the top bucket or top couple buckets when evaluating ranking systems.
My short ranking systems have a spearman correlation of 0.93-0.97 when evaluating at the granularity of 20 buckets.