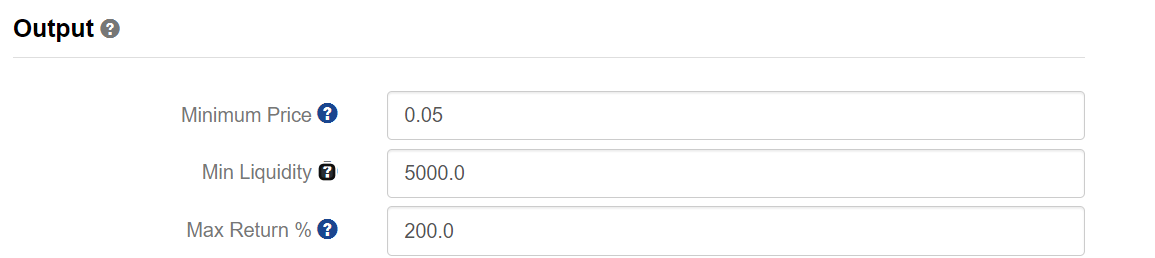
These “post rank” filters + modifiers defaults seem to handle outliers well regardless of universe chosen or regions. The Min Price & Min Liquidity are filters, while the Max Ret is a modifier (clips the returns for a period).
With a universe with microcaps or low prices stocks these filters create imbalances in the distribution of stocks in the buckers, but it is still preferable to the alternative where outliers skew the results.
Thanks @Chipper6 for the chart suggestions. We’re creating specs for future revisions. Let us know what else you’d like to see in this thread since the other thread is getting too long.
Thank you, I appreciate how responsive you have been to our suggestions.
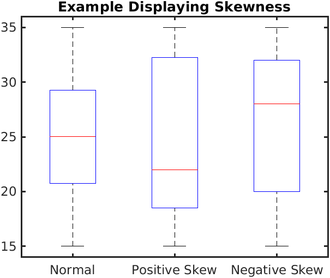
Another feature that we discussed in the past but that got buried somewhere along the way is to show the range of returns for each bucket. A box plot, also known as a box and whiskers chart. Like this:
This was discussed in the past but it got buried.
Note that like most data, in order to filter the signal from the noise it should show the variability of excess returns. This way you don’t have a market crash (which has no bearing on the ranking system) skewing the variability of the bucket.
I really like the expanded downloads of the rank performance test. I get that when you copy you can get the excess returns of each bucket: nice!!!
I wonder if for the big download button you might consider including the returns of the universe and benchmark—in which case one could easily subtract the returns of the universe (or benchmark) from a bucket to get excess returns for each week. Or even consider excess returns for each bucket (or just the top bucket for me) in the download.
This could be used to trivially calculate a lot of statistical and financial tests and/or metrics (e.g., the information ratio). Other examples of a use would be to bootstrap, do a Monte Carlo simulation or even get a Bayesian posterior of the excess returns which can be done easily in Python (with ChatGPT’s help if necessary) or in JASP. You cannot include every metric on your site but we can calculate most of them somewhere—even with the help of ChatGPT if necessary. This is one download that could help streamline getting several tests and/or metric members might want from the downloads.
Also one could get a box and whiskers plot of excess returns in Python or JASP (requested above) or whatever might be too much clutter (or too low of a priority) on the P123 site. Please do not misunderstand, I like a box and wishers but maybe you would not want to do a “violin plot.” Or adjustable confidence intervals. For example, what if I want a confidence interval of 99% while Chaim prefers 95%. And of course, both of those confidence intervals would not need to depend on the assumption of normality if done by bootstrapping. Maybe we would not have to make our case with a feature request in the forum and just do it ourselves sometimes—with excess returns of buckets anyway. Or we might avoid some future feature requests (yet make a feature easily available to a member), hmmmm… I really do like those violin plots (and the information ratio).**
One can copy and paste from another spreadsheet to get this now, so not urgent if this is not a popular request.
I appreciate what you have done, I like it and thank you for considering this.
You can get weekly returns of the universe by using the random() ranking system. For sims it would be a sample-size limit of 100 (for my membership level) which may not be ideal but you can get a weekly return download from sims (in Statistics).
You could get an exact number by doing a Rank Performance test on Random() with 2 buckets. Use the top bucket as a large sample or average both buckets to get more exact for the entire universe–assuming the factor has equal bucket sizes which you can now see in the download. You would only have to do this once and save it somewhere. Copy and paste it into your factor downloads and have the spreadsheet calculate the excess returns. Or Python can do that of course.
I suspect there might be a bug in the “H-L with carry cost” calculation. It seems that the calculation deducts the carry cost regardless of the holdings. For instance, if a bucket has zero holdings, it deducts the full carry cost, which is incorrect because there should be no cost associated with holding cash.
Could you please verify this? If confirmed, we need to correct it. Additionally, I suggest including all fields, including calculations, in the download for transparency, verification, and bug detection/fixes.
Moreover, it’s worth noting that the tool should deduct the overnight interest rate (e.g., Fed funds, which we have in the database). Users can then add or subtract from that number for borrow costs (short or better cash rates) because borrow costs are never static.