Price-blind (no value, no momentum) strategies

But why would price increases in the past suggest future price increases? Is it more likely that a stock that costs twice as much as it used to will double in price again or go back to where it was? There’s nothing in its price pattern that will tell you that.

I grant that some people have had a great deal of success following momentum strategies. But I also believe that more people have failed than have succeeded. Maybe it’s a case of once bitten twice shy. I tried it myself, studying technical analysis, buying and selling based on stochastics and sophisticated trailing stops. Never again.

True. But at the same time, stocks with low price volatility outperform stocks with high price volatility. Try using this as a ranking factor: priceH/priceL. You’d think, given what you just said, that stocks with a big difference between their high and low prices would outperform stocks with a very low difference. But the result is the opposite.


406699_69381.png

Marc–Thank you.

I look forward to an in depth discussion on momentum but by itself it doesn’t work. Close(0)/close(125), weekly rebalance for a moderately liquid universe. See below: you would be better off buying the 5, 10 or 15 worst performers than the 5, 10 or 15 stocks with the most momentum. And generally pretty flat.

Maybe Marc can help explain what momentum works with and why.


Jim - you should cut down on the number of buckets to say 10 or 20. Otherwise you are looking at noise. Also use a standard universe like SP1500 so people can compare their results with yours.

Cheers
Steve

Steve,

Yep. Generally much better if people can check and reproduce if they want to.

Still not so good against the S&P 500 equal weight with 20 buckets

Edit: Sorry. Just changed the benchmark on the first: same universe as the 200 bucket example. The second is with the S&P 500 universe.


I look at it from the other side – how would you identify stocks that can become future ten-baggers? We KNOW they have to have significant price increases. It’s highly unlikely to occur overnight (although it nearly did for Iomega in 1994 – when I bought their new Zip drive, I should have also bought $10K of stock), but over a period of time.

But the price momentum there is insufficient alone.

BTW, I just threw together a little screen strictly with the WER price factors. It did extremely well in the tech surge in 1999, but fell apart after that. I used it mostly in the 80’s and 90’s. But WER also has fundamental factors. It could be those fundamental factors that filter the group of price-selected stocks on HOW the growth is occurring – whether fundamental factors are driving it. If so, the stock may be more likely to continue its price momentum. As long as the fundamentals driving them also have momentum.

I tested lot of technical analysis factors back in the 80’s and 90’s, with similar results.

However, I still do use some of them, but only in special situations. For example, try a weekly backtest with a single price-only factor, on DJIA stocks, with:

– RSI(2)>=90
– RSI(2)>=70
– RSI(2)<=30
– RSI(2)<=10

https://www.portfolio123.com/app/screen/summary/56367

So Steve’s (valid) points are well taken. And in general, what I posted would be anecdotal at best. To do a little better:

I used the S&P 500 universe.

I took close(0)/close(xx) from close(0)/close(60) to close(0)/close(250) in 5 bar increments. So periods of 60, 65…250 bars. Or roughly 3 months to one year. Note NAs were negative: which should not make a difference as any stocks newly added to the S&P 500 would have a price history longer than 250 bars.

I used 5 buckets. I compared the middle bucket in yellow (middle 20%) to the top bucket in light blue. I simply compared whether the top bucket outperformed the middle bucket for each period.

The top bucket outperformed the middle bucket only 9/39 times (bars from close 135, 180, 185, 190, 200 210, 225, 230, 250). Less than 25% of the time.

See the example for close(0)/close(100) below.

How do we know that momentum works? It is easy to come up with a story, but I do not think first principles (i.e., the DDM) tell us which way it should go. Which is good because I would not want to question whether the DDM is correct (I do think it must be correct by definition). I use momentum for some ports–so I think momentum probably does work with some factors and/or for different universes–but it is not a simple subject.


Yuval,

I agree with much of what you say, but ignoring any estimate of company ‘intrinsic’ value and rating only on growth metrics is likely very closely aligned with elements of stock price momentum.

Re: abs(sales%chgttm-5)

You said:

If a company’s revenue is growing around 50% that’s just as bad as if their revenue is shrinking about 40%. Neither is sustainable or healthy growth.

While I get the sentiment of this comment, I don’t agree with this statement and doubt you do either. A company growing at 50% is much better then a company losing 40% in terms of management, customer demand, and likelihood it will earn positive revenues. At some point it may not be able to sustain that sales growth, but it’s likely a much better company all other things being equal. Clearly, the issue as an investor is if the market overreacts in terms of the increase in PE or PS ratios and ramps up future growth expectations too much in terms of the price relative to the earning capacity (in the case of the +50% growth) or if the market way overreacts and cuts future earnings expectations too much in the case of the down 40% case. You don’t know which one to buy without knowing the price vs. your future expectations of company value.

So, if you make no attempts to compare current mkt value to intrinsic value, you can’t be claiming to have a fundamentally based system.

You have found a ‘node’ of illiquid / overlooked ‘reasonable’ growth stocks - that is worth thinking more about and playing with.

  1. The ranking system performs the exact same with this factor or with sales%chgttm; both with lower is better when I run it on the all fundamental universe. For other universes, I start to see the better performance you mention.
    The ranking system also performs the same on multiple universes if I replace your factor with:
    ((sales(0,TTM)-CostG(0,TTM)/Sales(0,TTM))/(sales(4,TTM)-CostG(4,TTM)/Sales(4,TTM)))/sales%chgttm (higher is better). This is about growing gross margin dollars more than a rise in sales (so rising efficiency).
    So, what’s possibly going on:
  2. Choosing 5% annual growth as the ‘optimal growth level’ is really completely arbitrary - and is likely excluding certain higher growth industries and types of companies. For example, the tech industry has many companies that can sustain much higher growth rates for 5+ years (Amazon, HubSpot, Facebook, etc). In fact, SAAS models and many tech models generate such high valuations precisely because they can scale so rapidly and sustainably. The company I founded (non-tech) sustained 50-75% growth rates for close to 8 years. So, using this factor is likely excluding many sectors and excluding many hot companies.
  3. What’s more likely going on with this factor is that you are excluding the highest momentum stocks, which tend to often carry even higher valuations. So, likely it’s acting as a proxy for excluding very high fliers that are overvalued.

Not using any attempts at valuation are likely capturing ‘proxy factors.’

Re: Needing to use ‘abs value’ in denominator, my point was simply that you can handle this better with an if-then statement.

  1. With current factor, if company A earns $15MM this year and $10MM last year, then they will get a score of (15-10)/10 or .5. If company B loses -10MM this year and lost -$20MM last year, they also get a score of (-$10MM–$20MM)/(abs(-$20MM) = .5. Most rational investors would choose company A over company B. Claiming that they should be treated equally is not a strong argument, without a lot of proof behind it.
    Therefore, can simply use an eval or conditional branch and apply some more advanced logic to add a discount factor to the growth if the company started off as ‘negative earnings.’

Good luck.

Best,
Tom

Tom -

Revenue growth isn’t the same as earnings growth. Revenue growth of 50% in one year is relatively rare. About 7% of Russell 3000 companies achieve a revenue growth of 50% in a given year. I ran a rolling backtest on those companies, holding them for three months. Over the last five years they lagged behind the Russell 2000 by over 10% per annum. They’re usually losers.

Companies with a 40% decline in revenue in one year are even rarer, comprising a little over 1% of the Russell 3000. But at least they exceed the Russell 2000 benchmark.

Oh, and the last time Amazon had revenue growth higher than 50% was in 2001. There are, I admit, companies that have sustained revenue growth over 50% over several years (Twitter, Tesla, Workday, ServiceNow, Yelp). But if you had invested in any of them a year ago, you would have lost money.

In my opinion it is a growth rating for small-caps due to the small volume, too. But the approach is interesting: A composite rating for growth is always a good idea.

I also have concerns about the abs(sales%chgttm-5). The “5” seems to be optimised and backwards rationalised, because the argument of mean reversion could also be true for EPS-Growth (but backtests doesn’t show such a strong mean reversion here). At least the broad market (or sector) should be considered in the factor, i.e. “abs(sales%chgttm-FMedian(“sales%chgttm”)-5)”. Otherwise you would penalize even an average growing company in a bull market.

Nevertheless a high sales growth can be good, if the other fundamentals are good. If you look on the sales-growth as a single rating, it looks like there is a optimal growing rate of 5%. But if you look on a composite rating a bigger sales-growth should doing better - because then the other fundamentals are also fine (and make a mean reversion less likely).

If you want to find “pure quality” without explicit valuation and growth, you should look for margins, accruals, earnings quality, changes in receivables…

Sebastian

Yuval,

I agree that investors in the highest growth companies do poorly in public markets generally (unless they got in early and sell off to later stage investors), and I agree that it gets very, very hard to maintain these levels of growth and any valuation models assuming it will happen are likely in trouble.

An interesting example of the challenges of valuing a small, hi-growth company can be found here - in this discussion of the argument around Uber:

  1. Uber isn’t worth $17B.
    Uber Isn’t Worth $17 Billion | FiveThirtyEight
    (see the attached spreadsheet on this - it’s a good reminder of very traditional valuation methods)

  2. uber could be worth over $40B.
    How to Miss By a Mile: An Alternative Look at Uber’s Potential Market Size - Above the CrowdAbove the Crowd | By Bill Gurley
    (it’s a good thought exercise on selling / hyping a company and/or the challenges of valuing very hi-growth, ‘new business models.’)

This article raise interesting questions about how to value companies, but also points to the fact, that simply valuing a company based only on it’s 12 Month or 24 month growth rates is FRAUGHT with large conceptual issues. This is what I thought you were asking, and I was trying to help.

Your ranking system - unless you add some value component to it - feels largely like ‘pattern matching’ based on backtests and optimization. I am not against using those tools, but I believe that you are only making claims that exceedingly high growth is bad, because backtests show it’s bad in terms of stock market price movements in near and medium term. That’s pattern matching and nothing more. It’s the same as looking for patterns in price. You may then construct logical arguments (like the market overreacts and adds too much ‘growth premium’ to multiples), but it’s still pattern matching.

If you were to examine those companies that grew at 40% in a year and then looked at their total sales growth over the next 3 years, my bet is that it’s higher (that is raw sales and earnings growth is higher) than companies that grew at -5% the following year. But that doesn’t matter for an investor (the price movements of the stock do).

And if you were building a logical argument that companies that ‘grow too fast’ are bad, you would have ideal ranges of optimal growth for earnings, margins, etc. and penalize significant deviations and rises in these as well. The reason you don’t is likely that you built this through backtest based optimization (in one form or the other).

Best,
Tom

P.S. As far as me understanding revenue vs. ebit - I do:
I co-founded a company and grew it to over $200 Million in annual sales. I get the difference between revenue growth and earnings growth, and ours was much larger than 50% / year actually (around 100% / year over this time). In the past 3 years, I’ve also reviewed at least 200 business plans for 200 private companies with that level of growth over periods of many years seeking additional funding (seed or Series A) in the private markets. These are the companies that nearly all private tech investors seek out. If you are looking for small companies and using a growth model, it seems that you might want to copy what the best investors in the world in this space are doing - at least to start. But, that’s only if you have a similar holding period (a long time - like 8-12 years). If you have a shorter holding period, you don’t - but then you are using pattern matching - and should be looking at mathematical models for how to do that well, not looking for logical justifications for it.

P.S. #2 As far as Amazon:

Amazon was founded 22 years ago and is valued at $336 Billion or so. So, they’ve compounded value since founding at roughly 230% annualized per year (assuming they were worth $1 the day they incorporated). I don’t want to argue too much about this particular case, and I absolutely agree on is that hi-growth businesses and industries are typically much harder to value well - and the uncertanties are much higher as the time horizon grows.

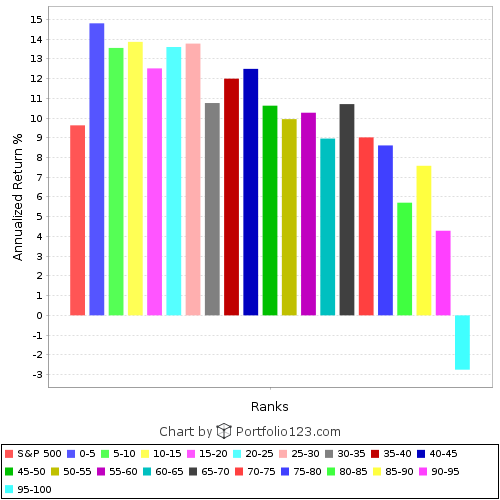
PS # 3. As far as companies that have grown sales more than 40% TTM, if hold them for 1 year - here’s the numbers from P123 (rolling test every month, 365 day hold) - they tend to do much better in the next year than average companies in up markets, and get punished more in down markets - but my point was none of this matters - and this is all saying nothing about their sales growth and business performance, just the stock market reaction to it:
GROWTH BENCH
Average 528.19 4.84% 4.15% 0.70% -95.77% 442.92% 61.26%
Up Markets 149 451.07 19.62% 13.62% 6.00% -94.00% 512.37% 67.42%
Down Markets 65 704.95 -29.05% -17.57% -11.48% -99.83% 283.72% 47.14%

This again, is pattern matching.


ubervaluation-Professor-NYU.xls (101 KB)

To quote Warren Buffett: “Change is the enemy of the investor”. This may help explain why a stable level of sales is a good thing for an investor.

Tom -

I was trying to present a rather simplified system for the sake of making a point. I actually use four or five measurements of growth, balancing between them; I just presented three here.

And I apologize for being arrogant. You’ve done a very good job now of convincing me that I may very well be wrong, and that what I’ve found out about modest revenue growth being better than strong revenue growth may be just a fluke pertaining to the last fifteen years.

Here’s what I’ve noticed. Growth measured by the most recent quarter versus the same quarter last year tends to be rather simple: the higher the increase, the better. Growth measured by the most recent trailing twelve months versus the previous trailing twelve months seems to follow a bell curve in terms of market reaction–the best and worst growing companies suffer the biggest drops and the middling ones do best.

As near as I can guess this is because the market reacts very well to high growth in the short term but that longer-term very high growth sets up false expectations. The object of stock-picking, as I see it, is to find companies that are likely to outperform investors’ expectations. Companies with high year-on-year revenue growth set up quarterly expectations that may be less likely to be met. On the other hand, companies who are accelerating their growth are rewarded with an increase in price/investment.

Again, I apologize for my arrogance.

Yuval,

You found a solid learning and digested a lesson from it well, and I think there’s real value in what you are doing here and you should keep building on it. I was just trying to get some dialogue around it to deepen my own understanding.

You may very well be right in what you’ve found - so don’t throw it out - but be cautious and keep digging.

Re: “As near as I can guess this is because the market reacts very well to high growth in the short term but that longer-term very high growth sets up false expectations.”

The market reacts very well to ‘unexpected’ positive changes in the short term. That’s what it’s great at. So, there may be something else going on here - like these companies tend to announce forward quarterly earnings that beat estimates - or tend to get more upgrades from analysts. You can start testing for these by ‘removing’ specific companies from the universe with ‘look ahead’ rules to try and isolate the source of the outperformance more clearly.

Best,
Tom

yuval - sales growth isn’t necessarily beneficial to investors. For example, acquiring companies is one way of growing sales. But if it is done by borrowing significant amounts of money or issuing shares to cover the acquisition then perhaps it is not benefiting investors. Have you thought about segmenting high growth companies into those that are diluting shares versus those that are not? Or massive increase of debt versus consistent debt between quarters/TTM?

Steve

Yes and no. One of my ranking factors, which I didn’t include here, is (sharesq-sharespyq)/sharespyq, with lower values being better–in other words, companies that buy back shares are preferred to those that dilute them. Another is EBITDA to total debt, opincbdeprttm/max(0.05,dbttotq), higher values being better. But I really like your suggestion of looking at debt increases–I’ll definitely have to experiment with that one.

By the way, if a company announces a forthcoming share dilution, when does P123 take that into account in its figures? Tribune Publishing (TPUB) and BG Staffing (BGSF) are coming up very high on my rankings, and both recently announced the issuance of new shares, which would render all their EPS and value rankings inaccurate. I know enough not to buy them, but my automatically balanced live sim doesn’t. Will Compustat adjust its figures in the next week or so or will they wait until the next quarterly report or when the shares are actually issued?

We’re only able to take it into account when the impact reaches the published financials. And that’s not necessarily a bad thing. Often, these are not buybacks per se but buyback authorizations which may be executed immediately, or more often, gradually over long periods of time.

Also, do not automatically presume anything with EPS. The cost of the capital used to fund share repurchases (i.e. interest on new debt, diminished interest income on cash, etc.) offsets the impact of a lower share base, so you usually have a smaller net income figure being divided by a smaller number of shares. So there is no assurance that a buyback will increase net income. (The CFO and his or her staff will model this and debate this and hope it works well, but nothing is assured.) Conversely, an increase in shares outstanding does not automatically dilute anything. This typically is accompanied by an increase in income (new business opportunities) and/or a reduction in other expenses.

So essentially, since we’re screening and ranking in bulk, we need to adopt a dilution neutral stance re: changes in number of shares. (The only way to do otherwise is to do a company-specific analysis.) If we want to model based on the idea that share buybacks are bullish, we need to do it as a sentiment thing.

Note, too, that we have to be alert to the possibility that the mrket’s attitude toward share buybacks may change going forward. When interest rates fall persistently as they had for 35 years, the market saw net debt (which increases as a result of buybacks) as a good thing – a company skewing more toward the lowest-cost form of capital. If rates start rising, the market may well turn around and reward companies that move away from debt and over time, may punish buybacks and reward secondary offerings. The way to model for the future is to focus not so much on historic share-decrease data relationships but on financial flexibility, that gives the company the capacity to do whatever it is that the market will reward going forward.

Steve,

Agree. In tech bubble 1.0, many companies simply paid people to become customers or “sold dollars for 85 cents.” It’s fairly easy to grow revenues that way. However, many viable tech companies in spaces with network effects or ‘winner take all’ market spaces also seek to race to market dominant positions with negative earnings strategies, so these will be thrown out by many basic ‘positive earnings’ type screens.

So, really need to be (if trying to use a fundamental replication strategy) trying to figure out / calculate the market expectations for growth priced in to current valuations and then comparing your current estimates for growth based on most recent released numbers to those same market expectations.

It would be very helpful to look at ‘key metrics’ for high growth companies - like cost of customer acquisition to see if these are falling or rising over time, and the average profitability per customer by ‘vintage year’ or cohort - but no easy way to do these things on P123. These are what investors are actually looking at.

One of the companies I was following very closely this ‘tech bubble’ was ONDK. It’s an interesting company to look at. They were raising in the private market from top investors even when valuation topped $1B US, based on public company multiples. Those investors started selling at IPO and likely the earliest stage ones did okay.

See:
http://www.portfolio123.com/app/report/panels

But the stock has gotten crushed since IPO, even though their underlying cohort numbers have been pretty good (they are still very profitable to the individual groups they are lending to). They’ve been losing money to try to grow sales - and their cost of customer acquisition is very high - they are profitable on the customers they are serving - they are just paying way too much to get new customers. Now, they can’t grow sales so much anymore. No one wants to hold the stock on the investor level, but the underlying underwriting tech is still performing fairly well last time I checked. The cheaper they get, the more they are a likely acquisition target - as they are an MIT led team who has been doing this (rapid underwriting) for more than 10 years and have strong IP and huge training data set and good technology.

Some of the problems with a simple near term price growth model become clear when looking at them (although Uber was a better example) - assuming you could have invested back in 1/1/2014 - they were still have very high Q/Q growth numbers in many quarters, but those numbers are WAY LESS than the market’s expectations and hopes for them reflected in the valuation. And there was a ‘limit’ potentially in terms of their ability to keep acquiring customers and the costs of scaling those efforts. There stock was getting killed long before they started having low Q-Q growth - but they could continue to raise money and find financing for high cost growth strat’s - as a public company it’s much harder.

They are still a very interesting play that won’t show up on many / any quant screens - but have very high potential value to acquiring company. If they are bought, they are likely to bought for between $520MM to $1.3B. These are huge multiples on current stock price. Enterprise sales acquisition multiples are often 5X sales or more, so it just depends if they can stay solvent and relevant - and how hard their tech and team are to replicate (but they lost CTO to Goldman Sachs last year).

They are an interesting play if you really dig into the numbers. They are currently selling for about 2.5X cash on hand with a good underlying technology and team. But this is all a digression.

Best,
Tom

Thanks, Marc. This is very helpful indeed–I hadn’t thought about it this way. In the case of BGSF, the market reacted to the share offering, which is aimed at reducing the company’s debt, by plunging the price from $16.36 to $13.53. So maybe now it’s a good bargain.

Many thanks for sharing, Yuval!

Looks like it has potential using my 750,000 $ bottom liquidity universe.

:slight_smile: